| ID |
Date |
Author |
Category |
Subject |
|
321
|
Tue Apr 8 23:08:15 2025 |
Sergey Litvinov, Xinliang Yan | General | Tuning of the ion optics |
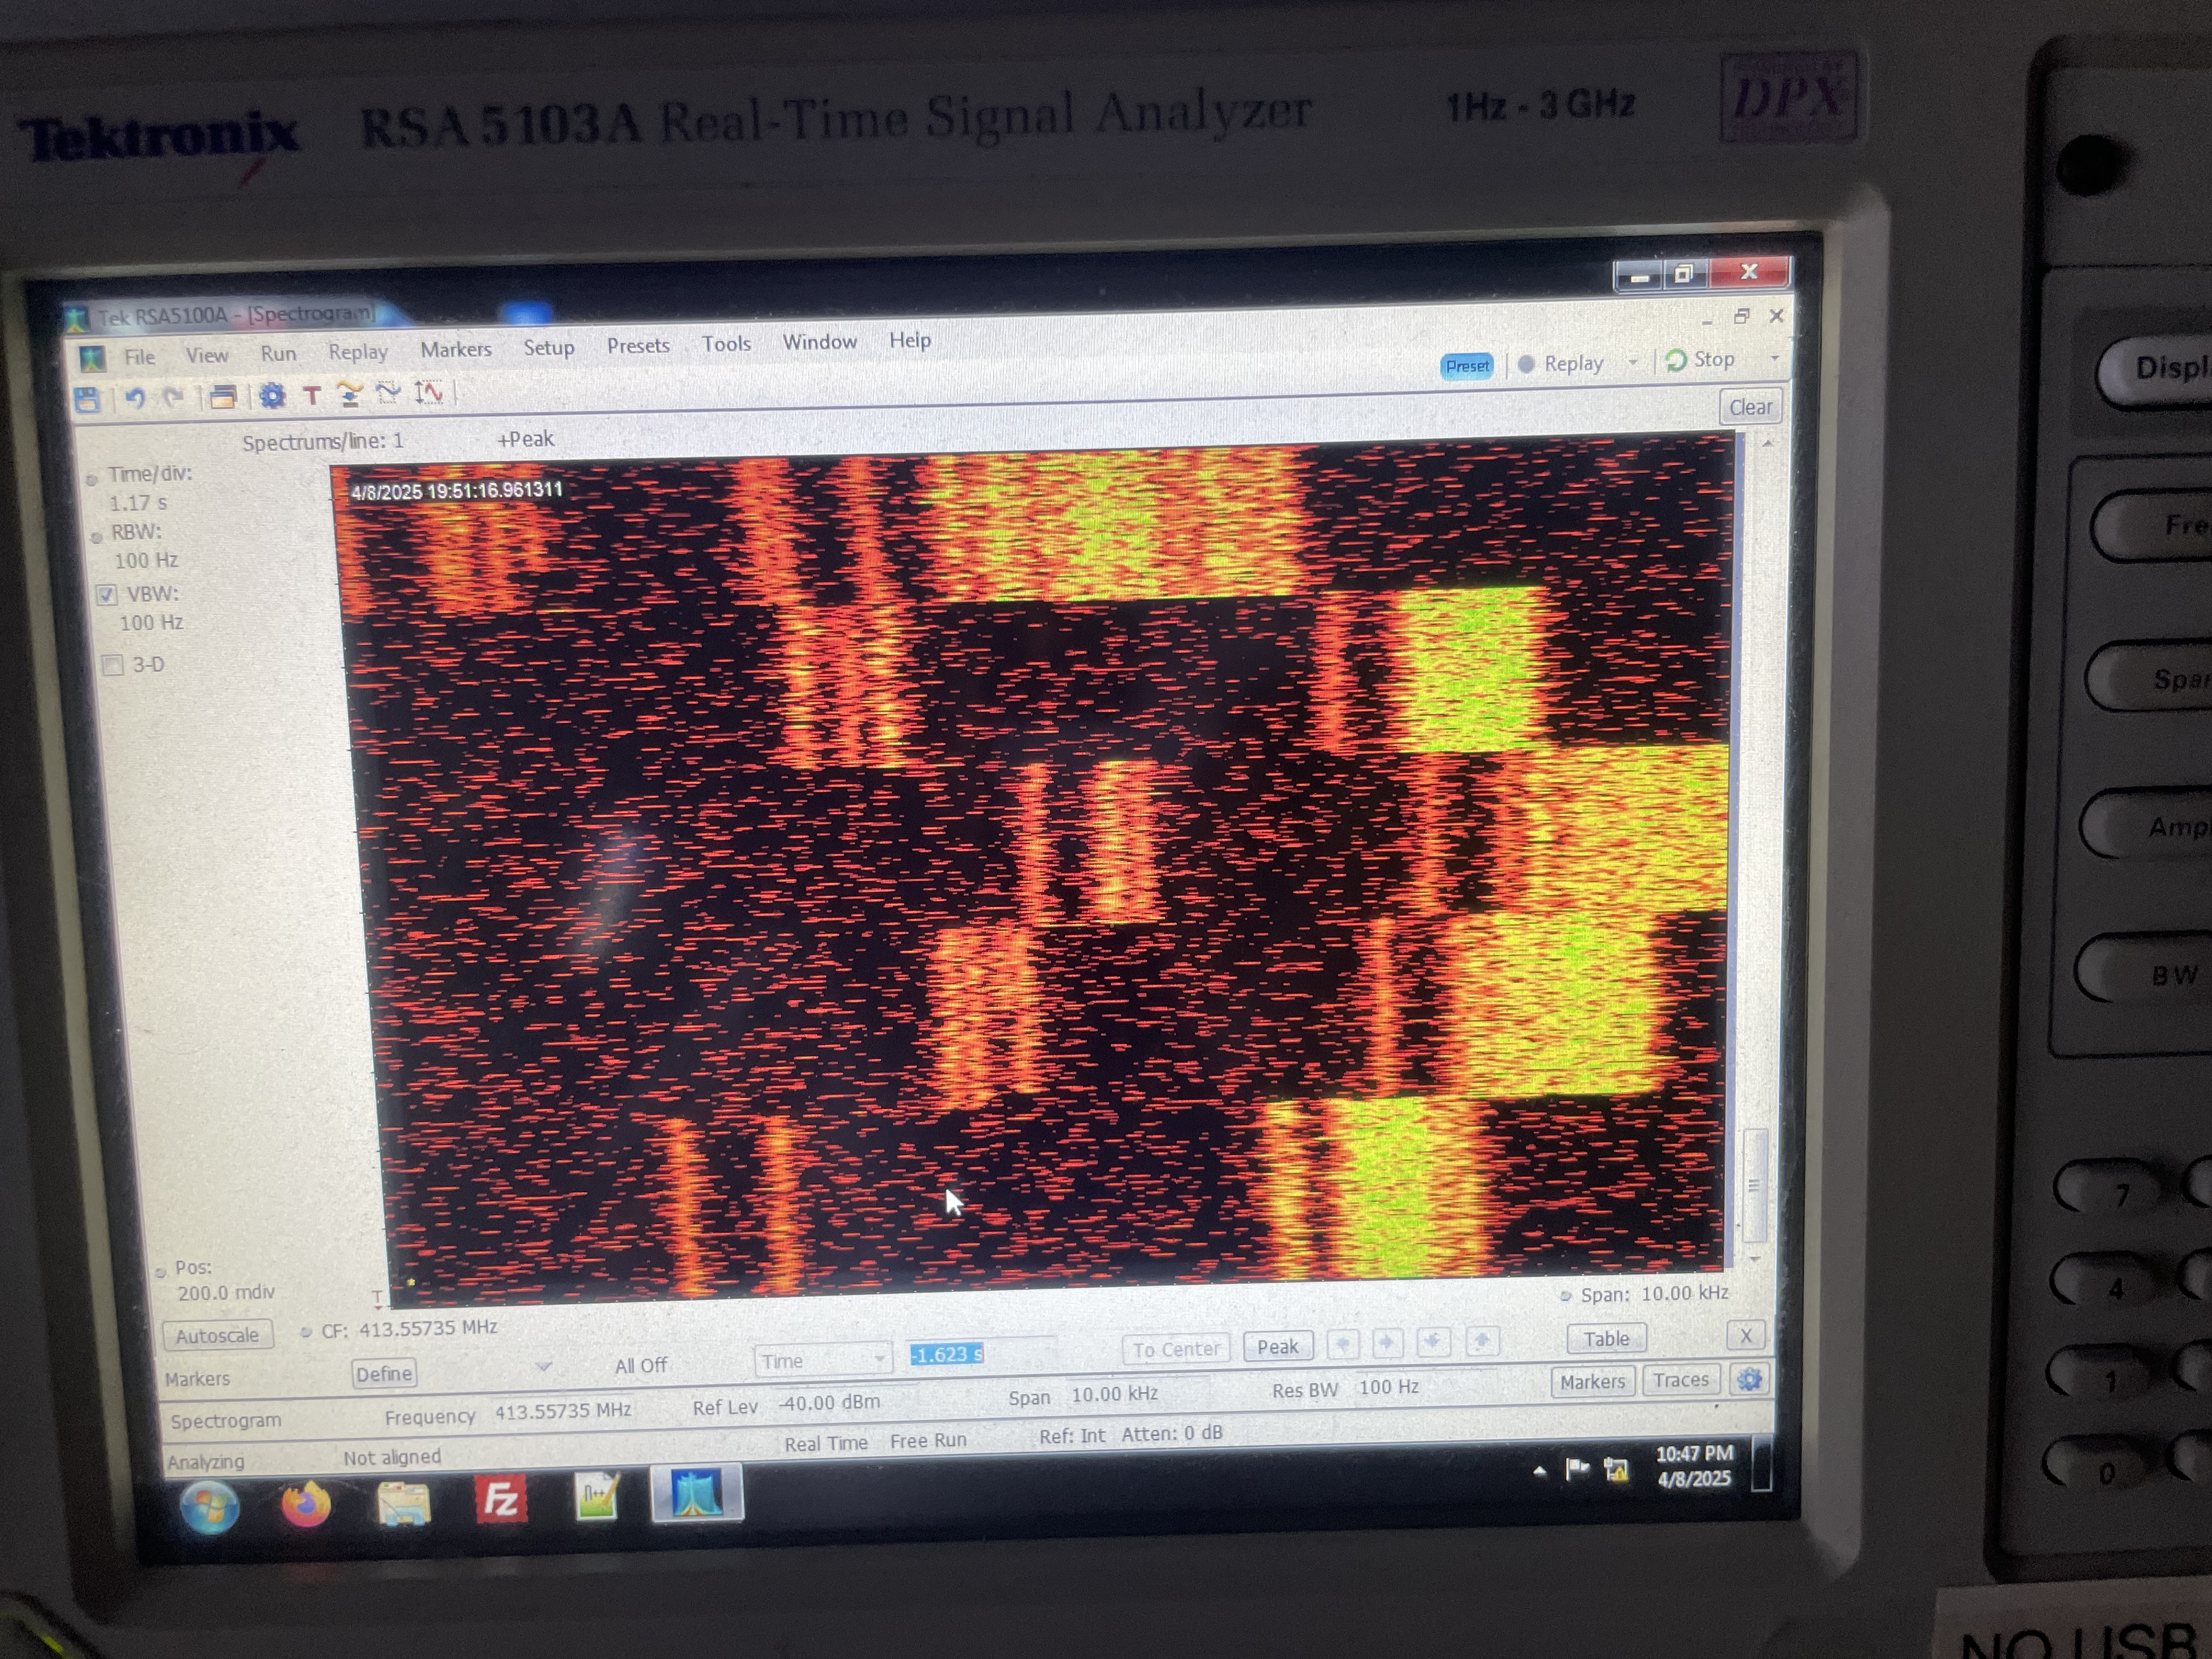
From roughly 10:45 pm to 11:05 pm,  Sergey tuned the
ion optics of the ESR to see if the mass resolution at
413.55735 MHz improves or not. Please note that the
frequencies of ions during the tuning process are not
stable.

Q-magnets and S-magnets have been adjusted, see
accelerator E-logs ID-844 titled ‘ ESR seting for
204Pt77+’ created by Sergey. |
| Attachment 1: IMG_2900.jpeg
|
|
|
272
|
Mon Apr 7 13:18:27 2025 |
Jelena, Guy | General | Tuning |
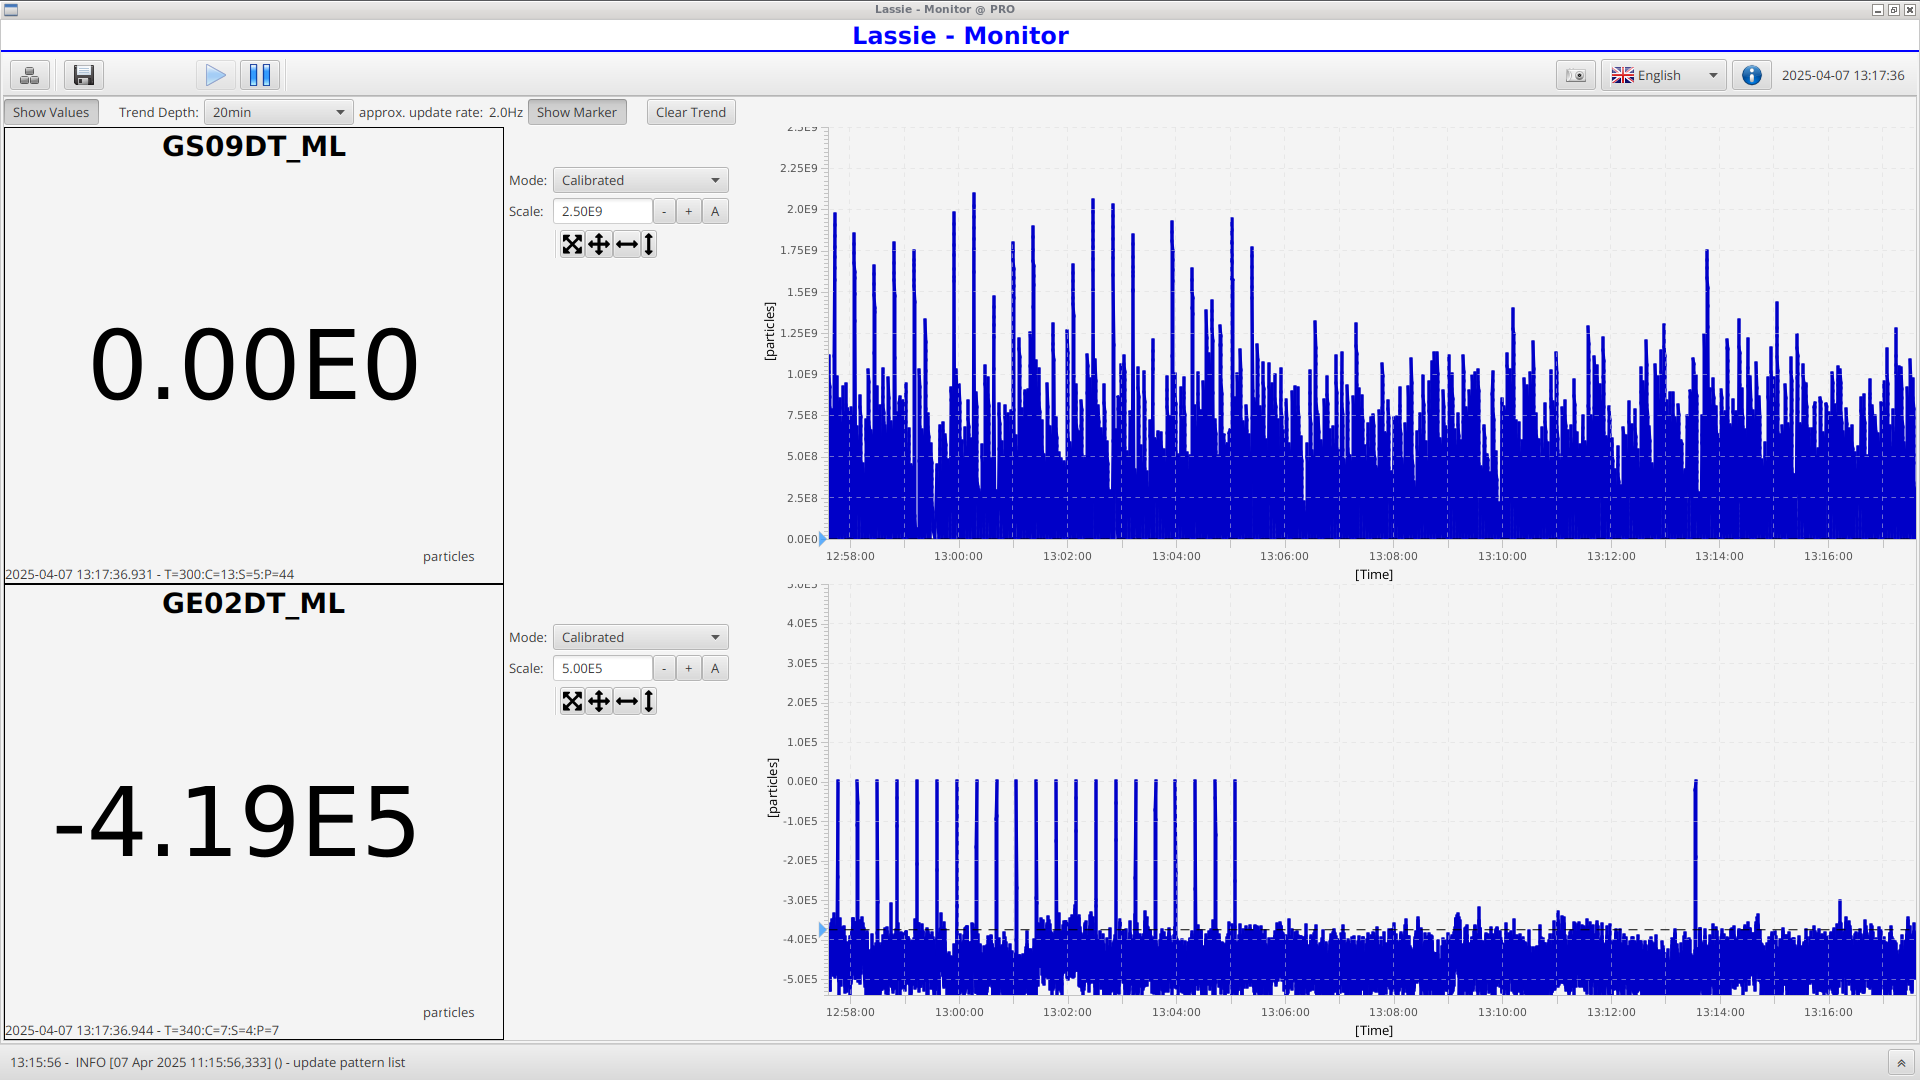
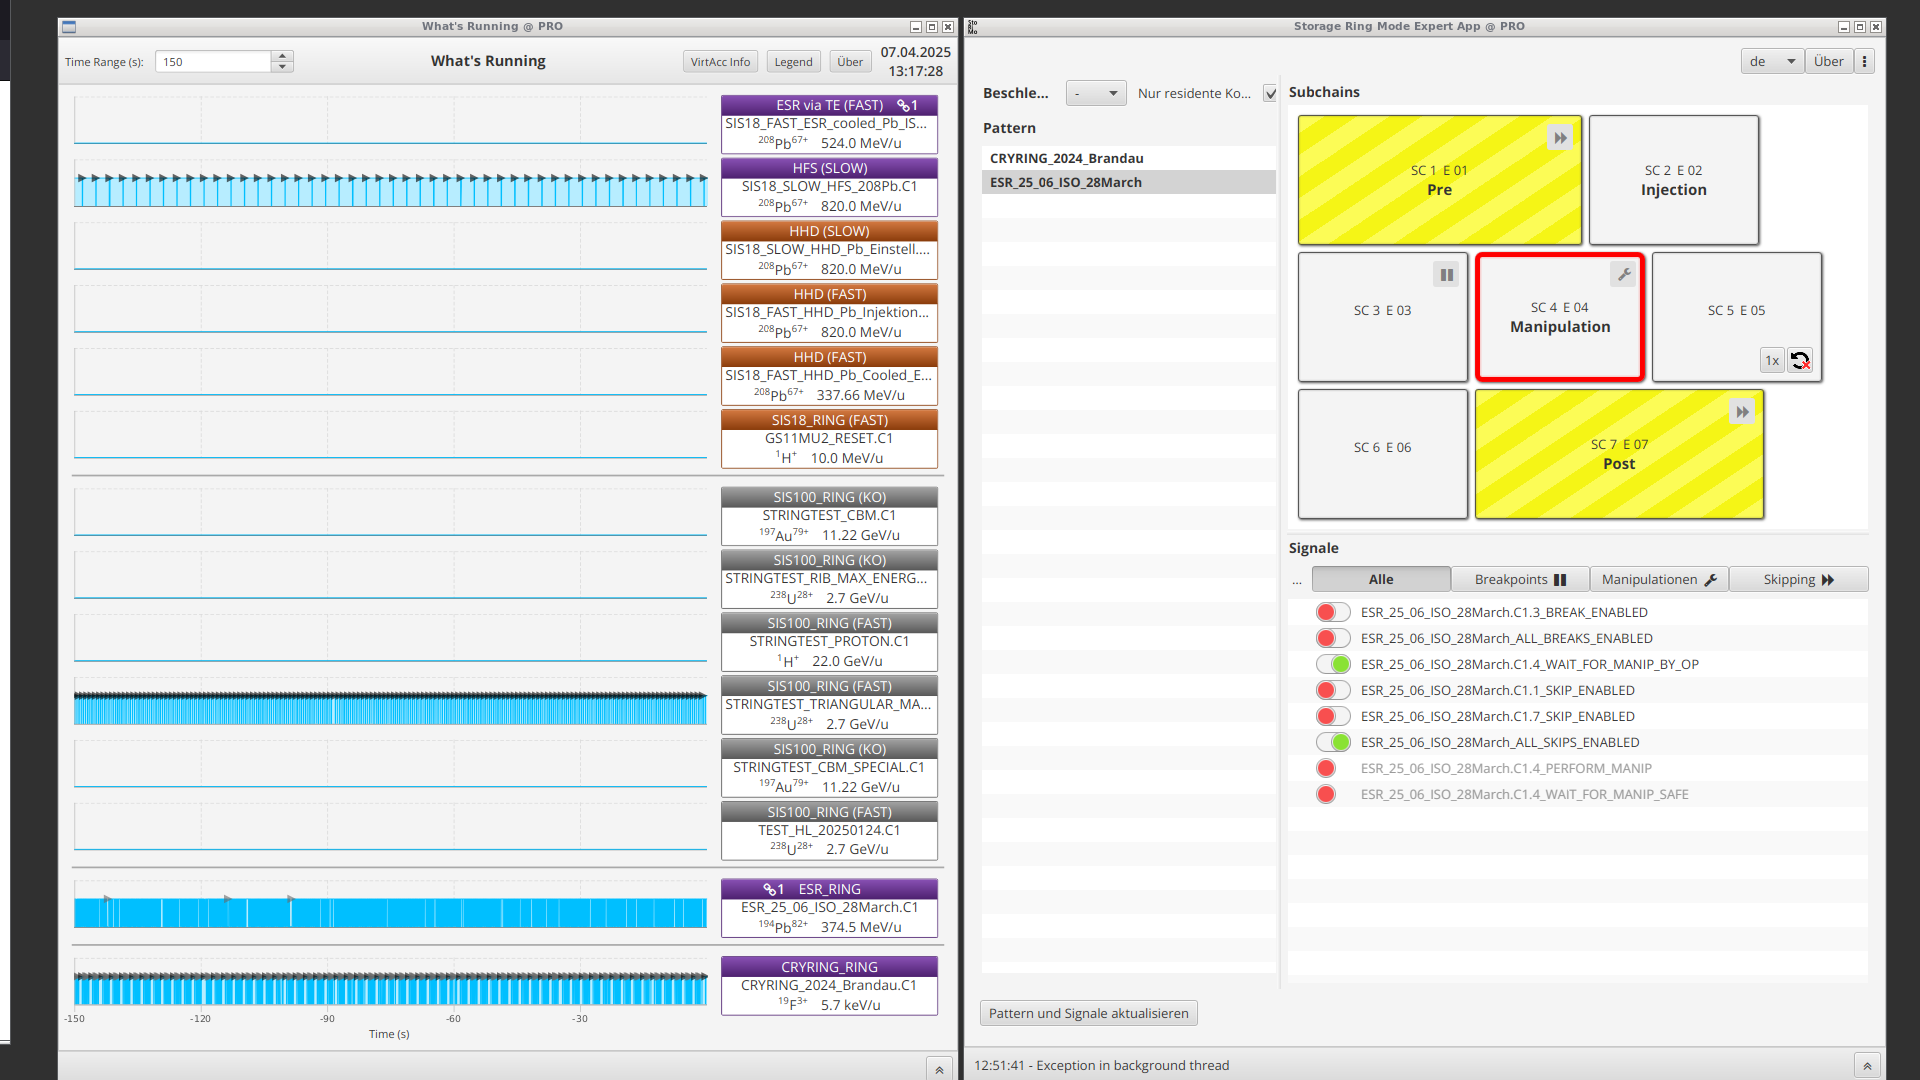
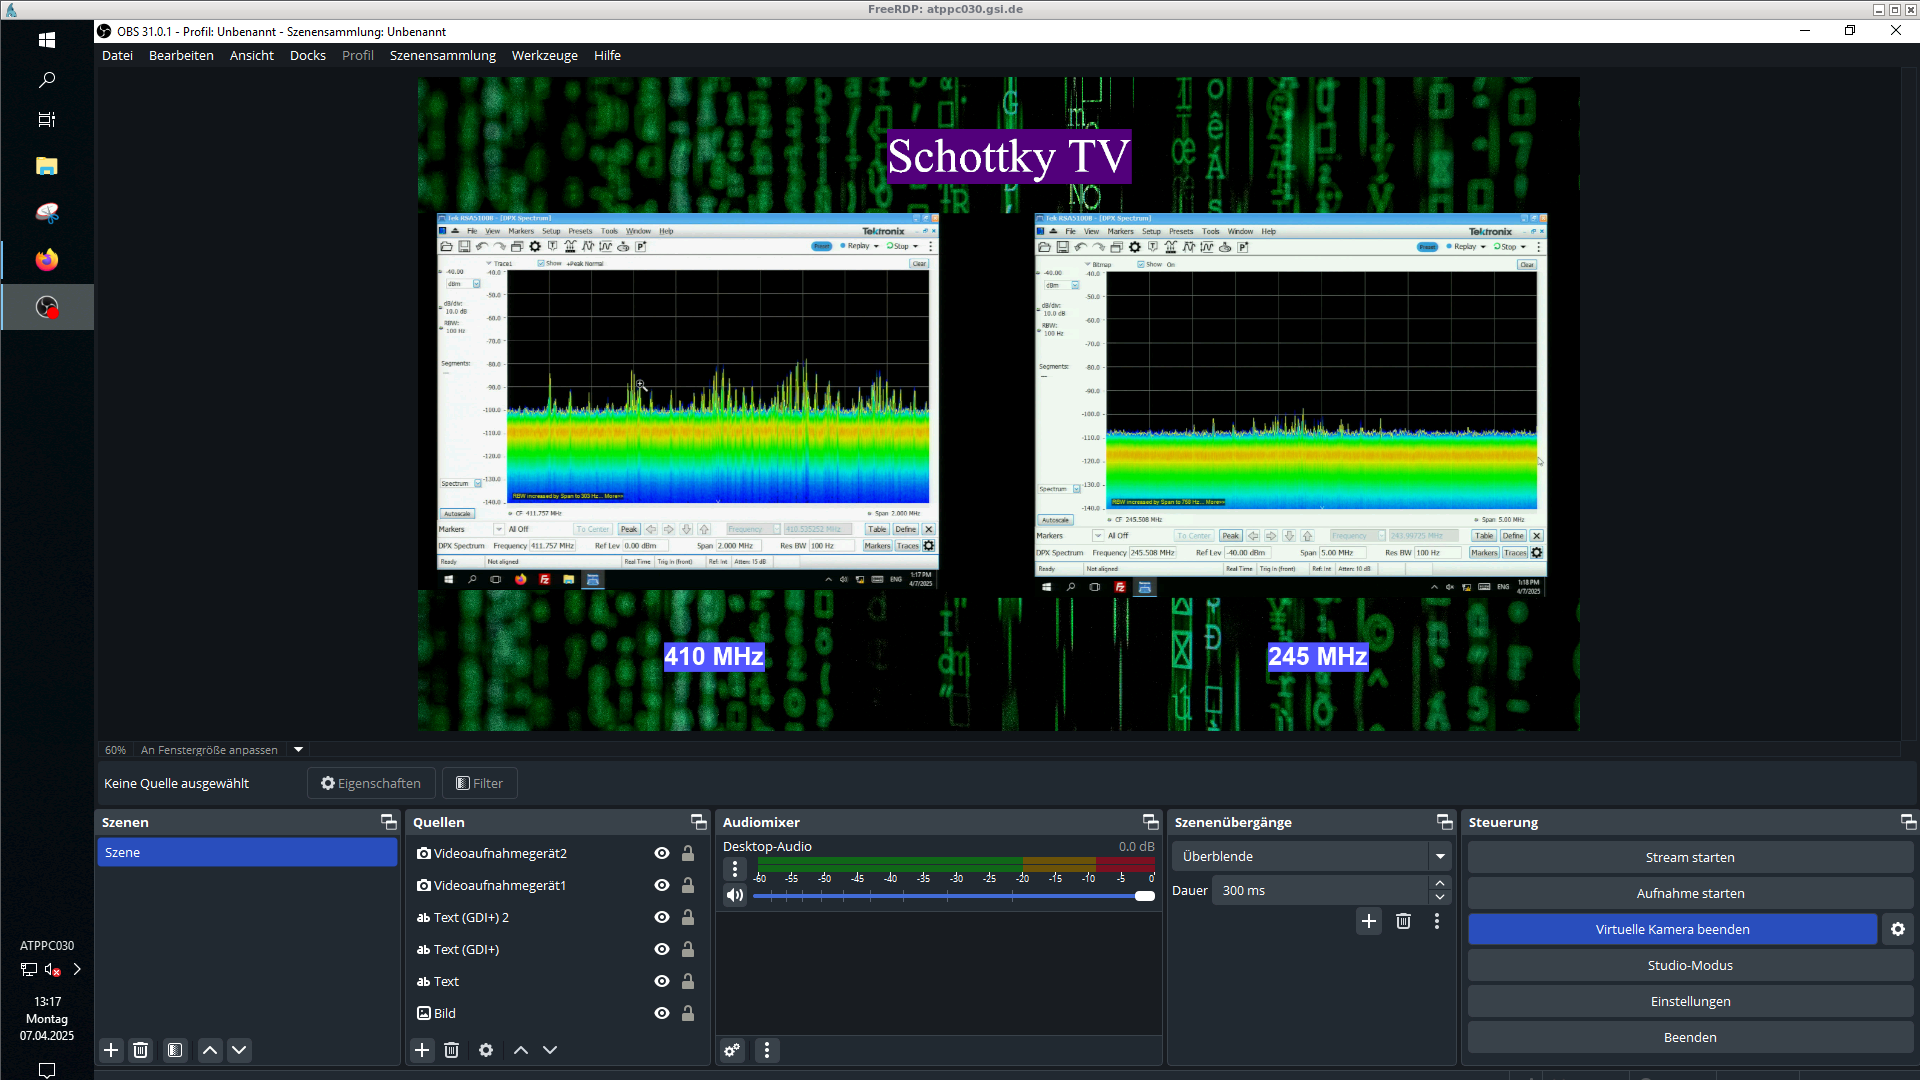
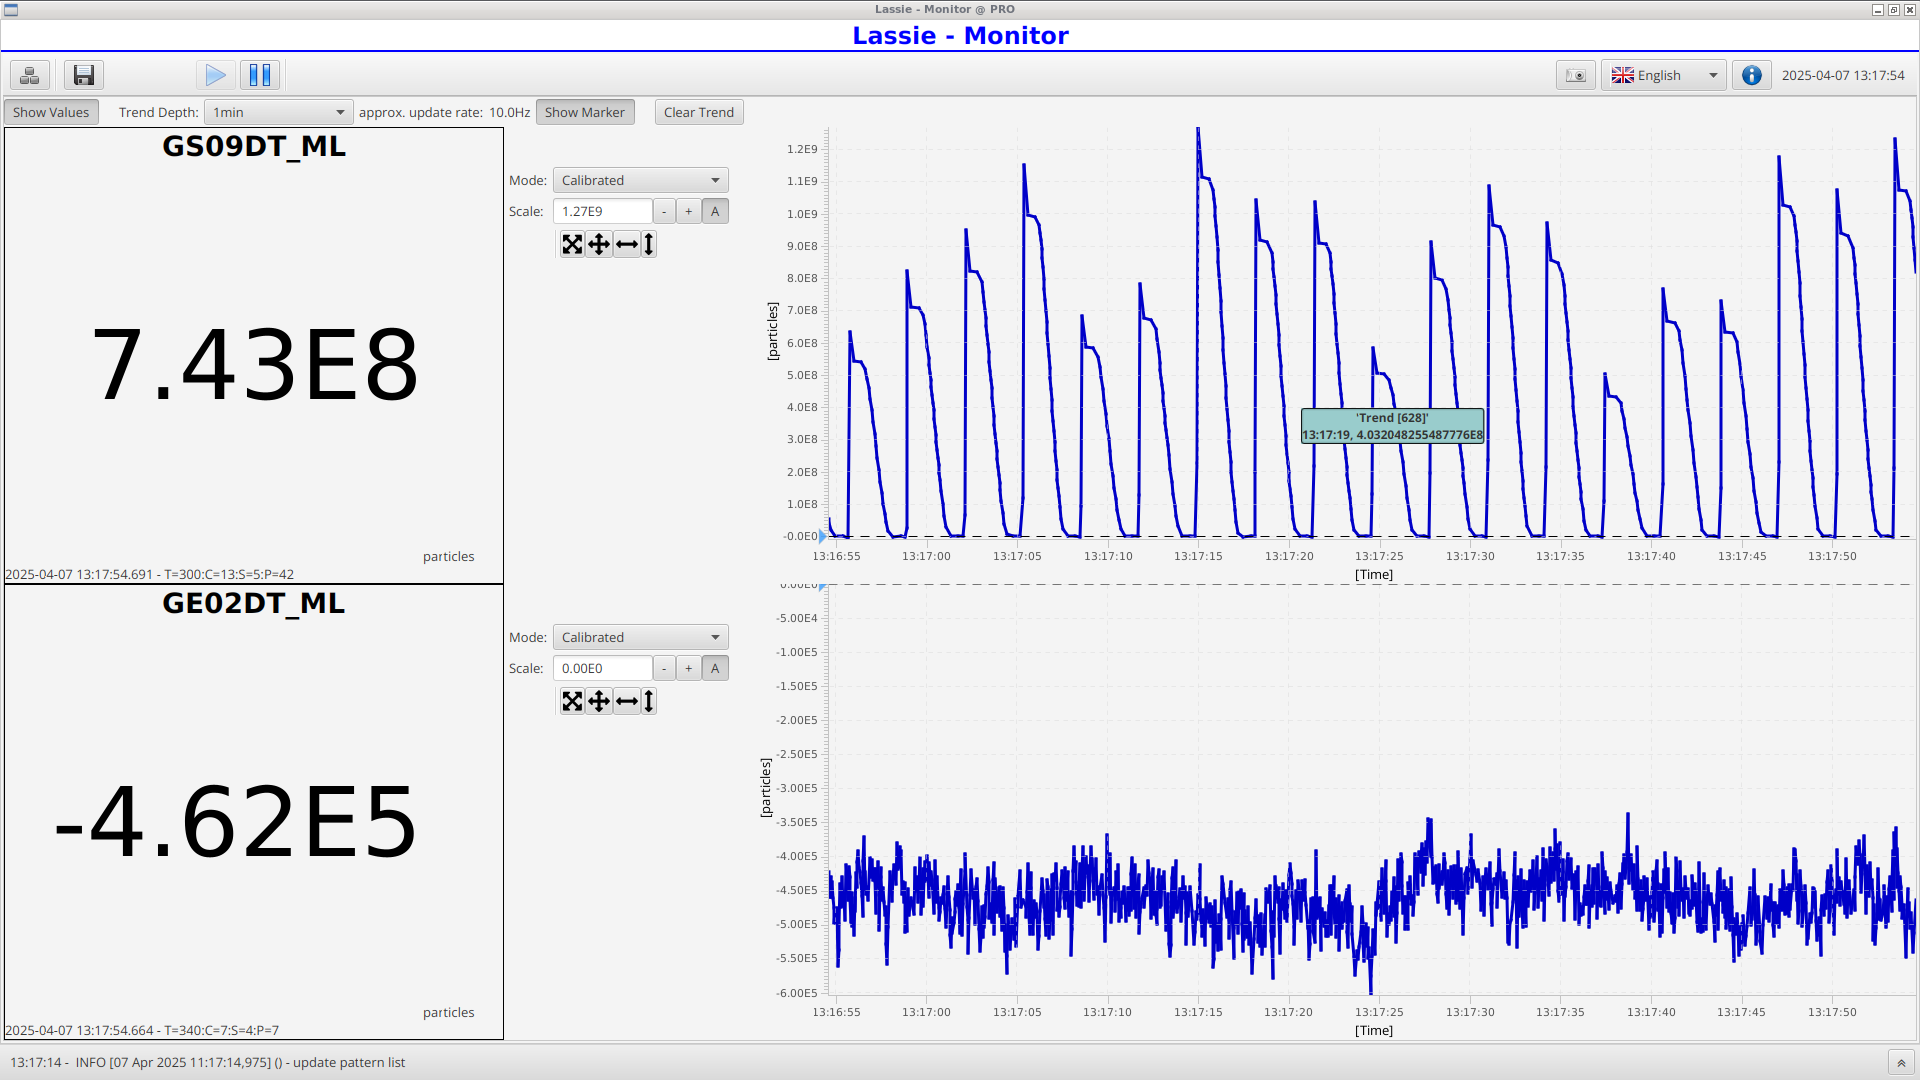
Beam was gone at 13:04 due to fragment tuning. |
| Attachment 1: 2025-04-07_13-17-37-105.png
|
|
| Attachment 2: 2025-04-07_13-17-28-724.png
|
|
| Attachment 3: 2025-04-07_13-17-58-900.png
|
|
| Attachment 4: 2025-04-07_13-17-54-807.png
|
|
|
23
|
Tue Apr 1 03:50:12 2025 |
Shahab, Yue, Carlo, Zac, Esther, Michael | DAQ | Tuners of the both cavities set |
410 MHz cavity resonance frequency tuned. motors both on 50 mm
245 MHz cavity resonance frequency tuned. motors both on 390 mm |
|
315
|
Tue Apr 8 13:46:20 2025 |
Michael | General | Trying new Sextupole settings, all data after 13:44 affected |
|
|
6
|
Mon Mar 31 10:46:43 2025 |
Ruijiu Chen | Analysis | This program is used to combine spectrum which is recored by RSA into one spectrum. |
This program is used to combine spectrum of many injections into one spectrum.

Example of usage:

(pyroot) gpuuser@appc256:/data.local/G22-00018_00203/scripts/OnlineDataAnalysisSystem/shift/20250331/data$ bash generate_data.sh /data.local/G22-00018_00203/results/analyzers/RSA01 RSA01-
'*.tiq_spectrogram.npz' 2025.04.01.04.00.00.000 2025.04.01.19.00.00.000 0.001 408590000 408620000 0.3 |
| Attachment 1: generate_data_1.sh
|
#!/bin/bash

# Check if the correct number of arguments are provided
if [ "$#" -ne 6 ]; then
    echo "Usage: $0 <dir> <prefix> <pattern> <start_time> <end_time> <value1>"
    echo "Example: sh generate_data.sh /lustre/astrum/experiment_data/2024-05_E018/rsa_processor_online/RSA02/tiq RSA02- '*.tiq' 2024.05.15.13.10.00.000 2024.05.15.13.11.00.000 0.001"
    exit 1
fi

# Assign arguments to variables
dir=$1
prefix=$2
pattern=$3
start_time=$4
end_time=$5
value1=$6

# Print the variables
echo "Directory: $dir"
echo "Prefix: $prefix"
echo "Pattern: $pattern"
echo "Start time: $start_time"
echo "End time: $end_time"
echo "Value 1: $value1"

# Create and change to a new directory named after the time range
mkdir "${start_time}_${end_time}"
cd "${start_time}_${end_time}"

# Call the combine_injection command with the provided arguments
combine_injection accumulate "$dir" "$prefix" "$pattern" "$start_time" "$end_time" "$value1"
|
|
86
|
Wed Apr 2 17:46:12 2025 |
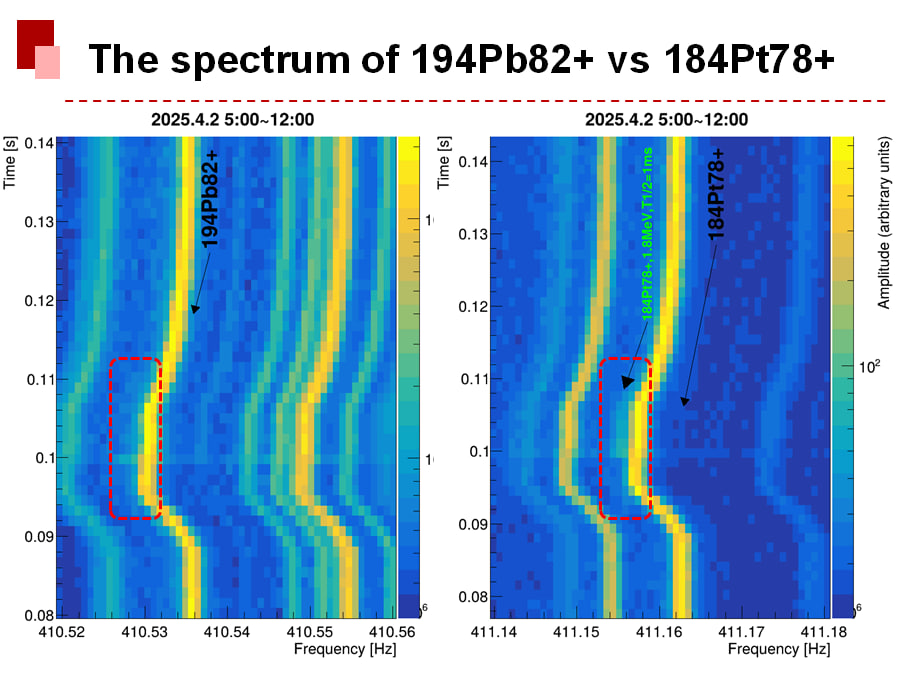
Ruijiu, Wolfram, Xinliang, Wangqian | Analysis | The spectrum of 194Pb82+ vs 184Pt78+ |
In summary, the statistical results collected between 5:00 and 12:00 AM on April 2, 2025. For each injection, we calculate the frequency mean value
(f_mean) and the peak height (P) of 194Pb ions for frames with t > 0.14 s, correct each injection’s frequency by subtracting f_mean, and only sum
the
spectra from injections with P > 100; moreover, by comparing the 194Pb82+ spectrum with that of 184Pt78+—whose isomer at 1.8 MeV (T1/2 = 1 ms) is
clearly visible—the setup is demonstrated to be suitable for detecting an isomer with a lifetime of about 1 ms.
===================================================================
How to dod analysis and plot this result:
1. Add up injections and create accumulated spectrum.
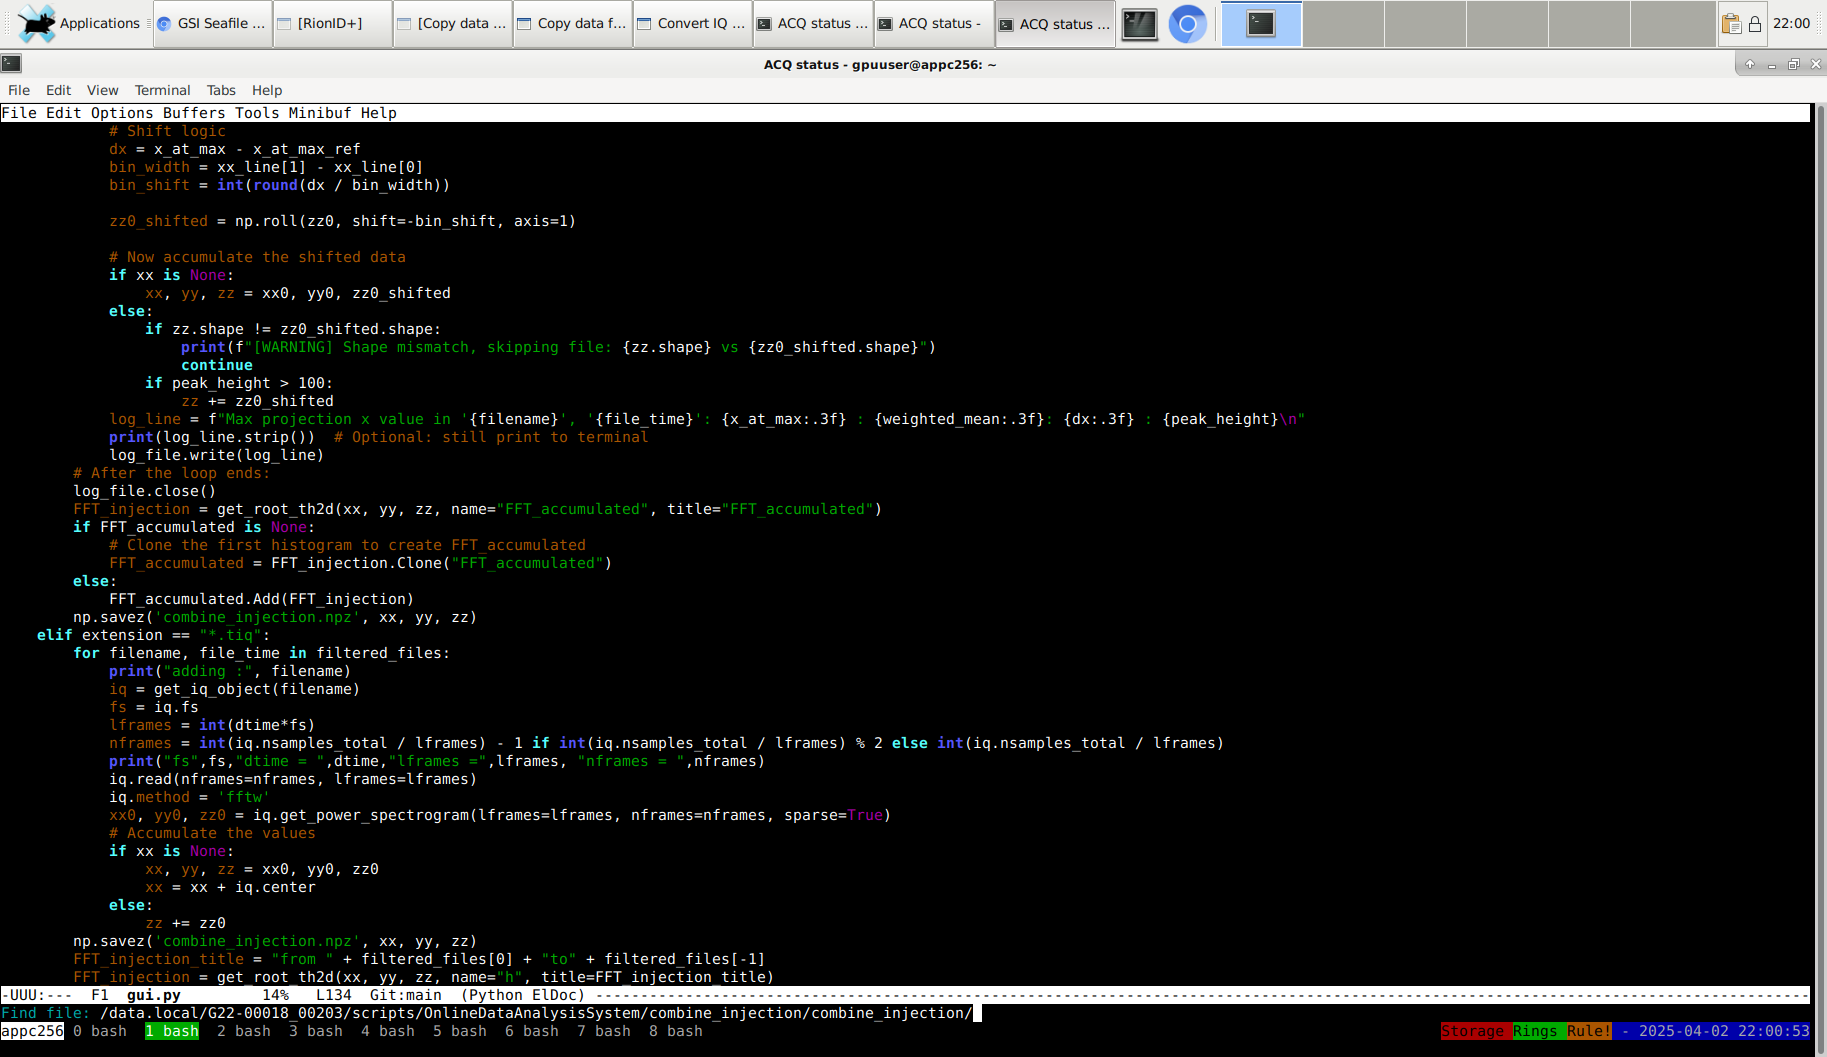
(pyroot) gpuuser@appc256:/data.local/G22-00018_00203/scripts/OnlineDataAnalysisSystem/shift/20250331/data$ sh generate_data.sh /data.local/G22-
00018_00203/results/analyzers/RSA01 RSA01-
'*.tiq_spectrogram.npz' 2025.04.02.05.00.00.000 2025.04.02.12.00.00.000 0.001 408.59e6 408.62e6 0.1 1

After run this command, you will create the accumulated spectrum under the folder with time stamp of start time and stop time.

2. Download the code "plot_fft.cxx" and plot the spectrum with following command:
...2025.04.02.05.00.00.000_2025.04.02.12.00.00.000$ root
   ------------------------------------------------------------------
  | Welcome to ROOT 6.32.10                        https://root.cern |
  | (c) 1995-2024, The ROOT Team; conception: R. Brun, F. Rademakers |
  | Built for linuxx8664gcc on Feb 12 2025, 01:50:41                 |
  | From tags/6-32-10@6-32-10                                        |
  | With                                                             |
  | Try '.help'/'.?', '.demo', '.license', '.credits', '.quit'/'.q'  |
   ------------------------------------------------------------------

root [0] .L plot_fft.cxx
root [1] plot_fft("2025.4.2 5:00~12:00",411.14e6,411.18e6,0,100) |
| Attachment 1: photo_2025-04-02_17-47-24.jpg
|
|
| Attachment 2: plot_fft.cxx
|
// plot_fft.C
// This macro opens the ROOT file "combine_injection.root", retrieves the TH2D histogram
// named "FFT_accumulated", and draws it on a canvas with a logarithmic Z-axis.
// The canvas size is set to 800 x 1000, with the top margin set to 0.05 and the right margin increased.
// Additionally, the histogram title and statistics box are removed.
// You can specify the frequency (x-axis) and time (y-axis) ranges via the function parameters.

void plot_fft(const char* canvasTitle = "FFT Accumulated",double x_min = 0, double x_max = 0, double y_min = 0, double y_max = 0) {
    // Open the ROOT file
    TFile* file = TFile::Open("combine_injection.root");
    if (!file || file->IsZombie()) {
        std::cerr << "Error: Unable to open file combine_injection.root" << std::endl;
        return;
    }

    // Retrieve the TH2D histogram named "FFT_accumulated"
    TH2D* hist = dynamic_cast<TH2D*>(file->Get("FFT_accumulated"));
    if (!hist) {
        std::cerr << "Error: Histogram 'FFT_accumulated' not found in the file" << std::endl;
        file->Close();
        return;
    }

    // Remove the histogram title
    hist->SetTitle("");

    // Remove the statistics box
    gStyle->SetOptStat(0);

    // If valid ranges are provided (non-zero and x_min < x_max, etc.), apply them to the axes
    if (x_max > x_min) {
        hist->GetXaxis()->SetRangeUser(x_min, x_max);
    }
    if (y_max > y_min) {
        hist->GetYaxis()->SetRangeUser(y_min, y_max);
    }

    // Create a canvas with size 800 x 1000
    TCanvas* canvas = new TCanvas("canvas", canvasTitle, 800, 1000);

    // Adjust canvas margins: top margin 0.05, increased right margin (e.g., 0.15)
    canvas->SetTopMargin(0.05);
    canvas->SetLeftMargin(0.12);
    canvas->SetRightMargin(0.15);

    // Set axis titles (if desired, you can modify these)
    hist->GetXaxis()->SetTitle("Frequency [Hz]");
    hist->GetYaxis()->SetTitle("Time [s]");
    hist->GetZaxis()->SetTitle("Amplitude (arbitrary units)");
    hist->GetZaxis()->SetTitleOffset(1.2);

    // Set log scale for the Z-axis (color scale)
    canvas->SetLogz();

    // Draw the histogram using the "COLZ" option to display a color palette
    hist->Draw("COLZ");

    // Update the canvas to show the plot
    canvas->Update();
    // Add the canvas title at the top using TLatex
    TLatex latex;
    latex.SetNDC();             // Use normalized coordinates
    latex.SetTextAlign(22);     // Center alignment
    latex.SetTextSize(0.04);      // Adjust text size as needed
    // Draw the title at (x=0.5, y=0.95) in normalized device coordinates
    latex.DrawLatex(0.5, 0.98, canvasTitle);

    // Optionally, you can save the canvas as an image file (e.g., PNG)
    // canvas->SaveAs("FFT_accumulated.png");
}
|
| Attachment 3: Screenshot_2025-04-02_22-00-57_1.png
|
|
|
45
|
Tue Apr 1 16:47:32 2025 |
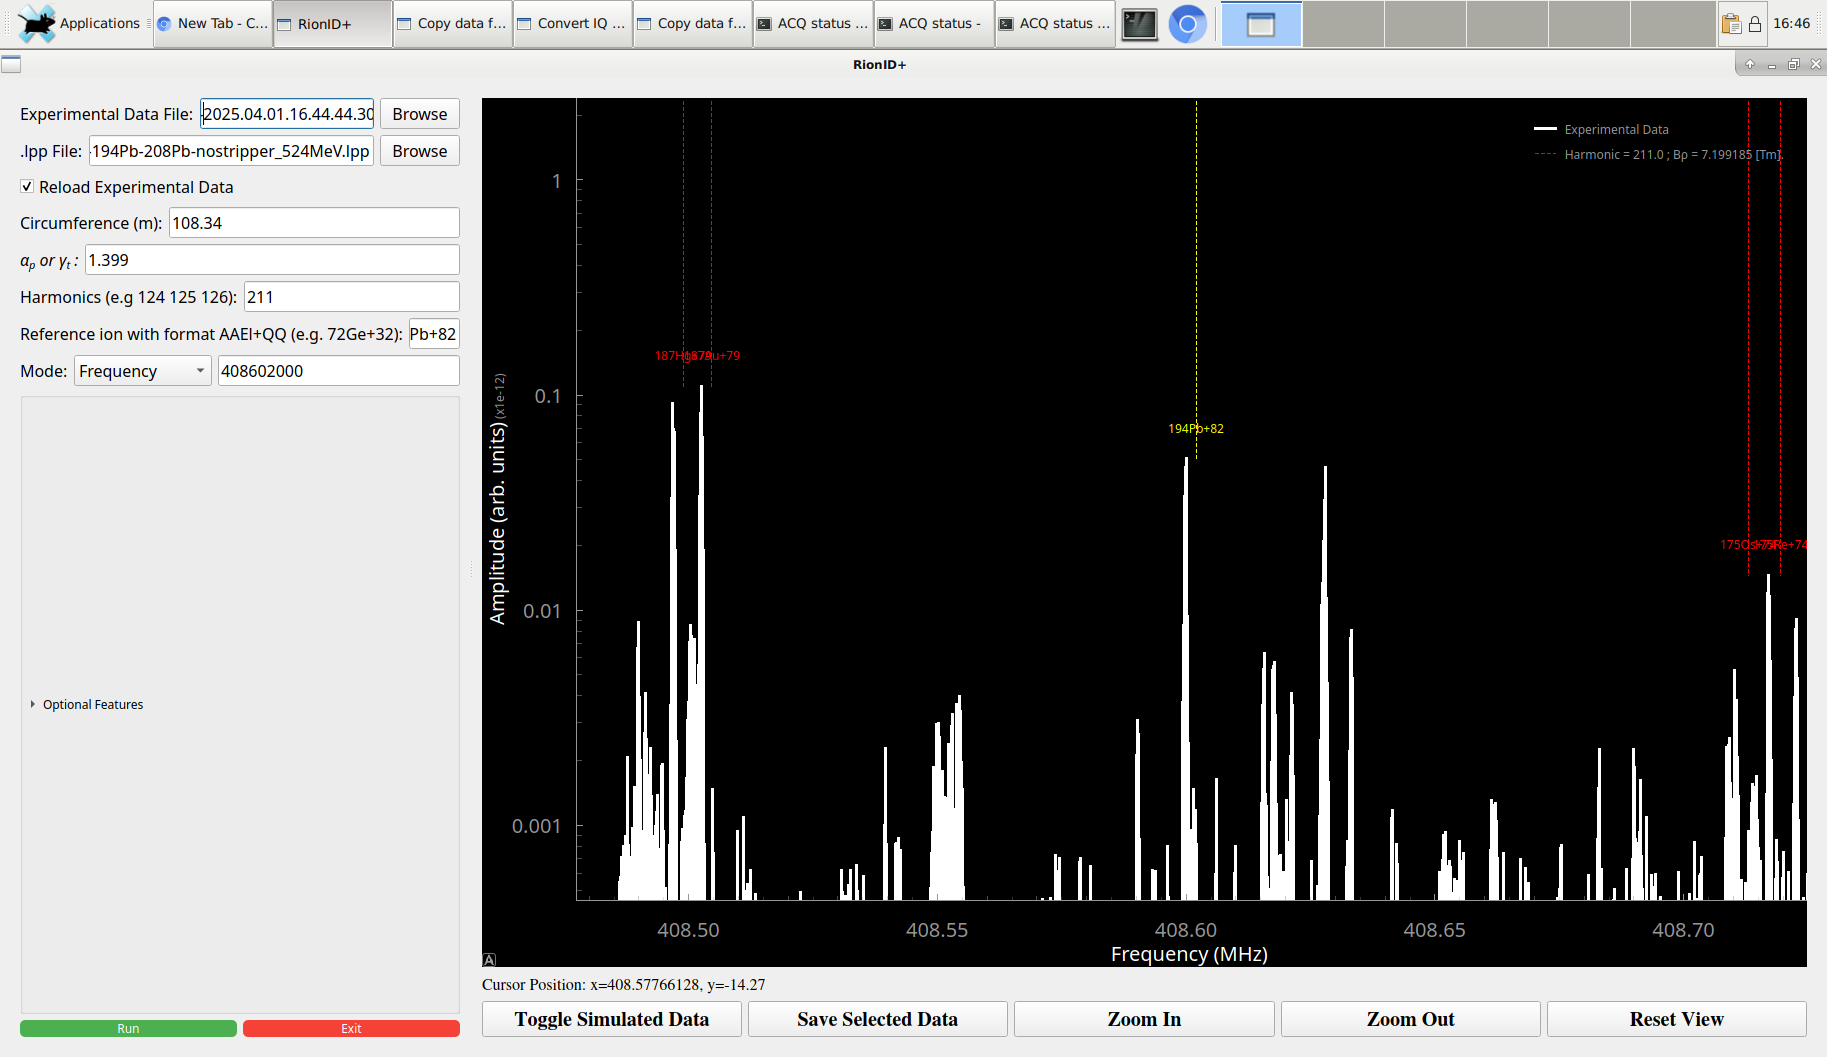
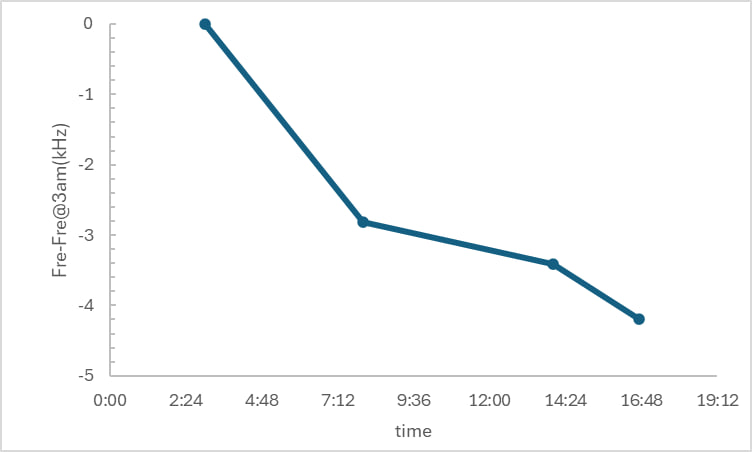
Ruijiu, Jan, Shahab | Analysis | The frequency of 194Pb82+ is changed to 408.600 MHz |
|
| Attachment 1: Screenshot_2025-04-01_16-46-56.png
|
|
| Attachment 2: photo_2025-04-01_16-54-20.jpg
|
|
|
40
|
Tue Apr 1 14:25:21 2025 |
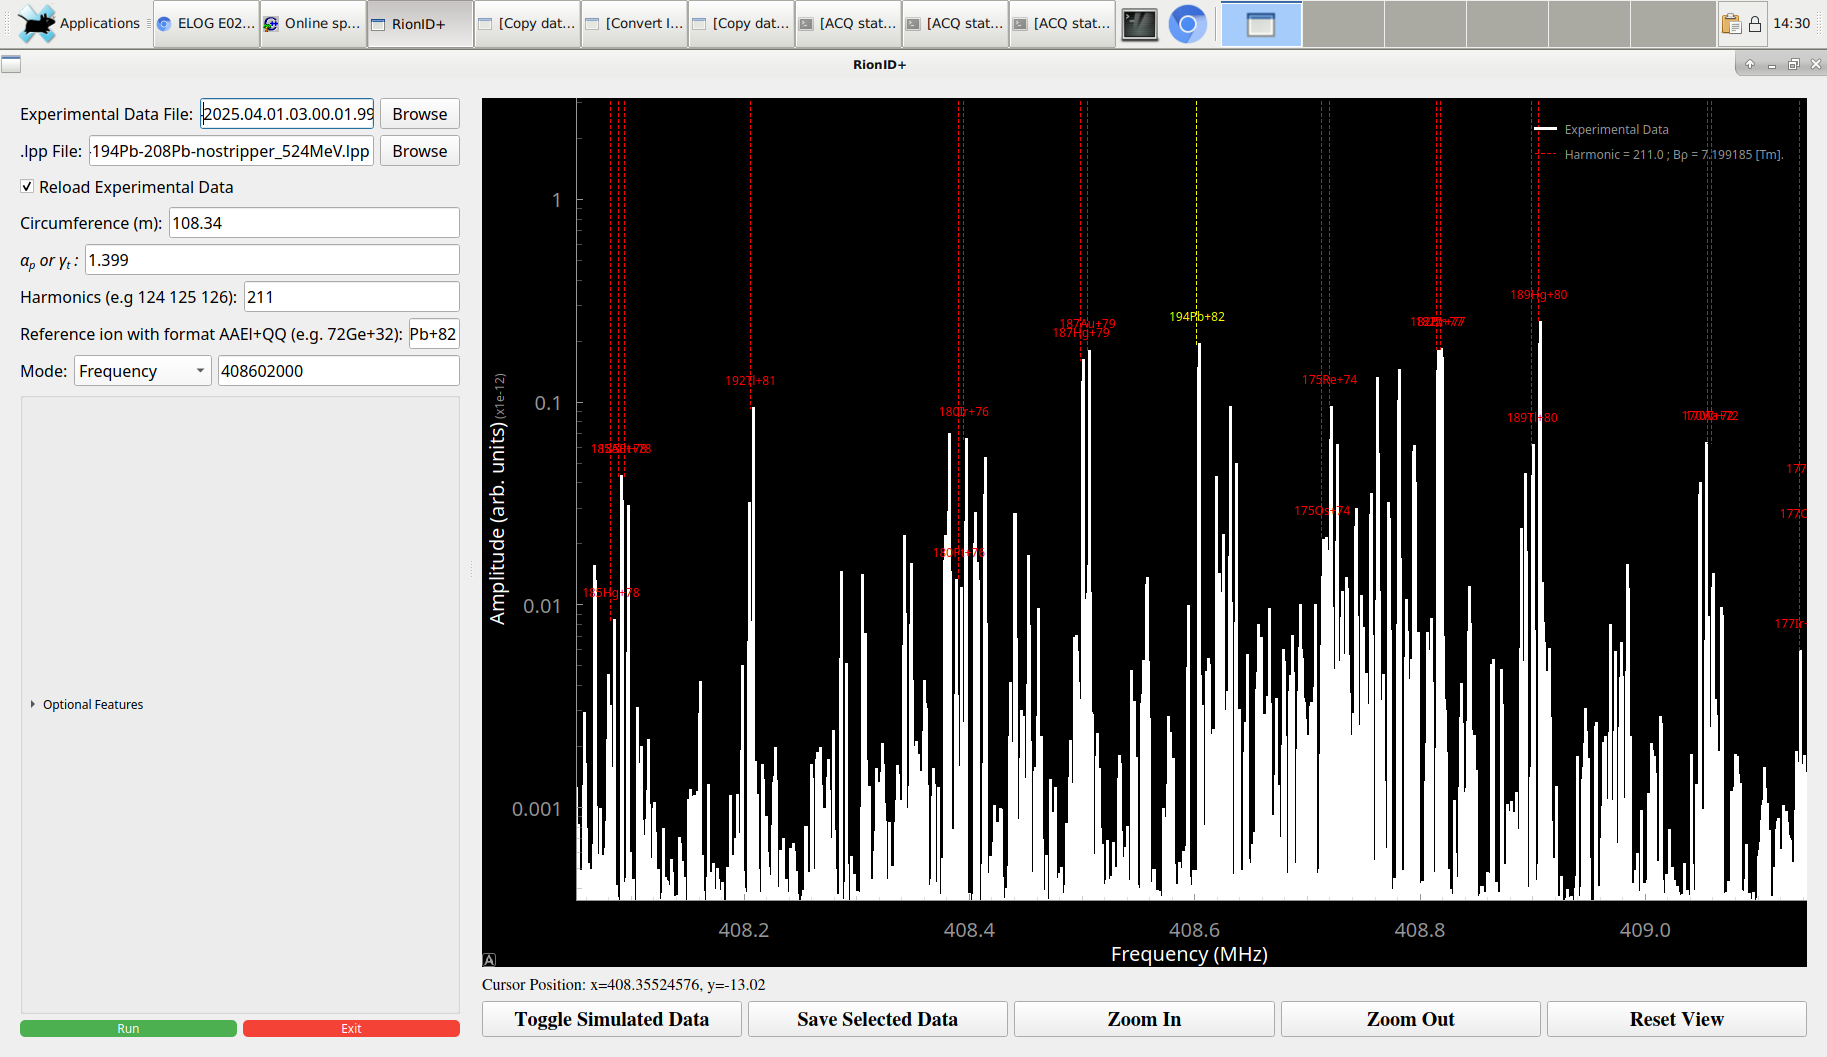
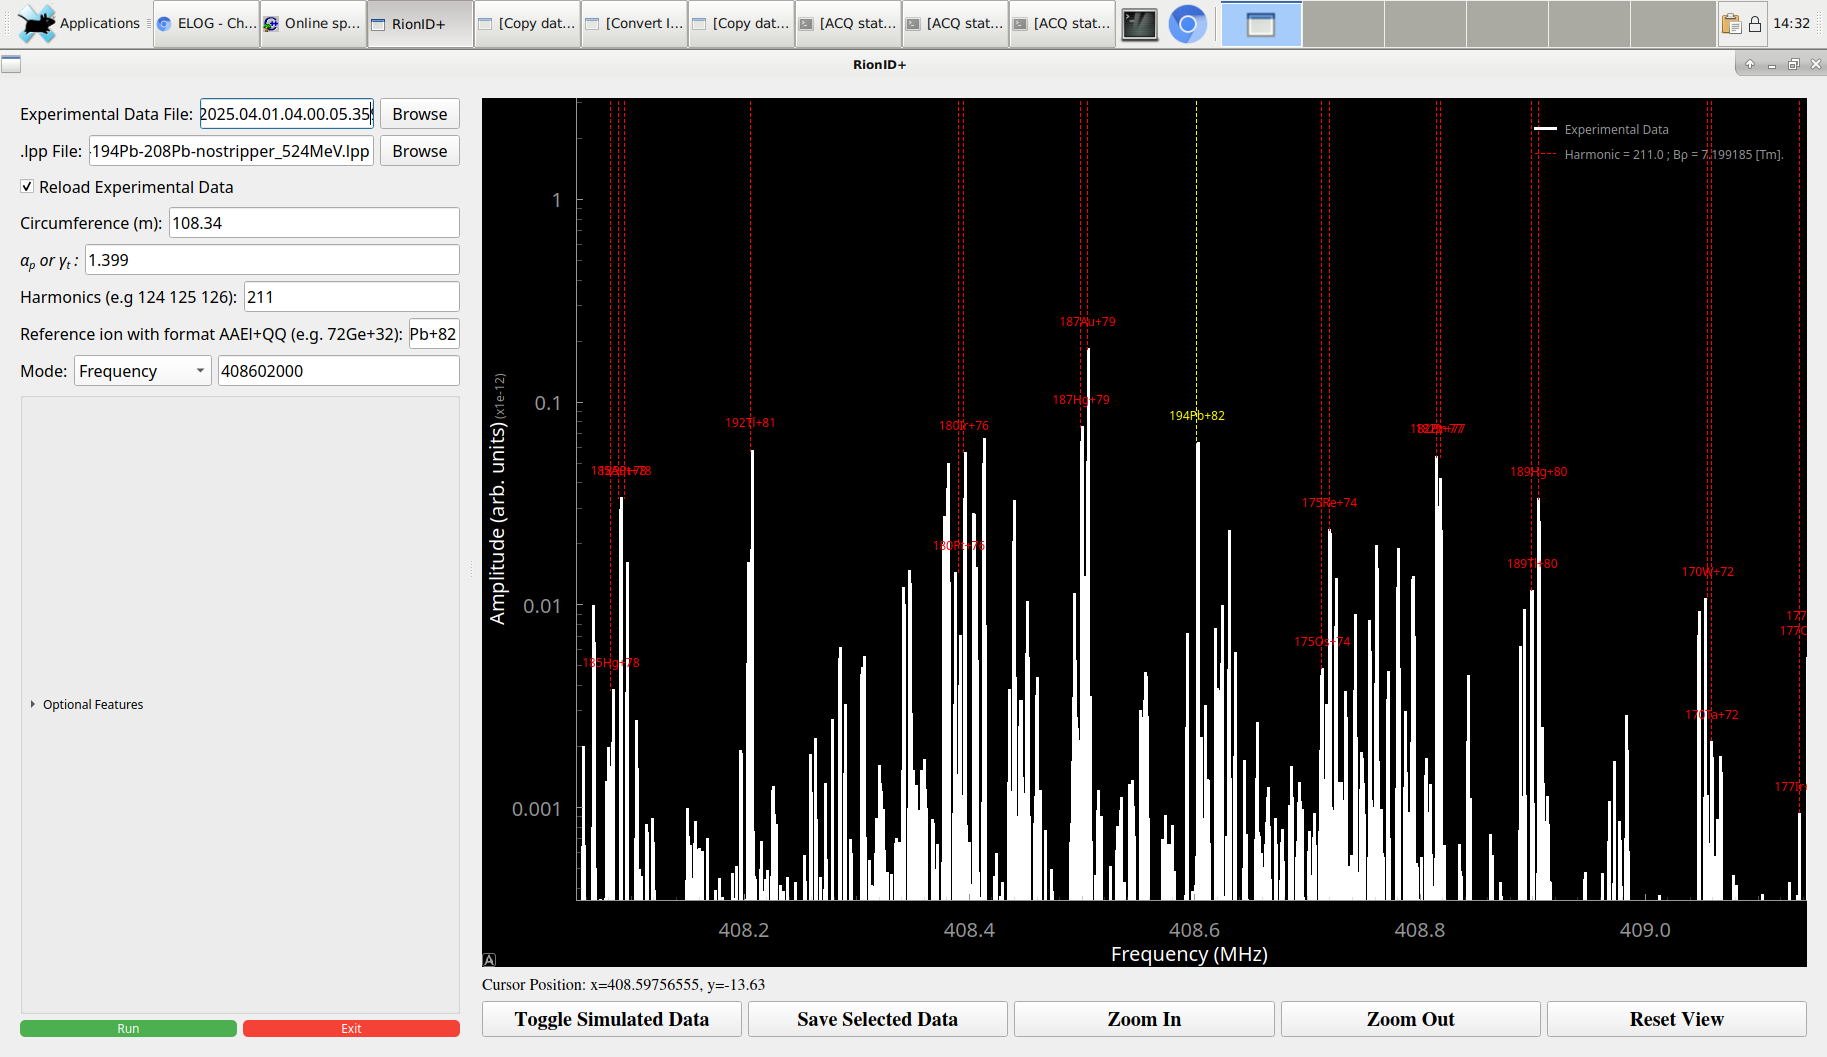
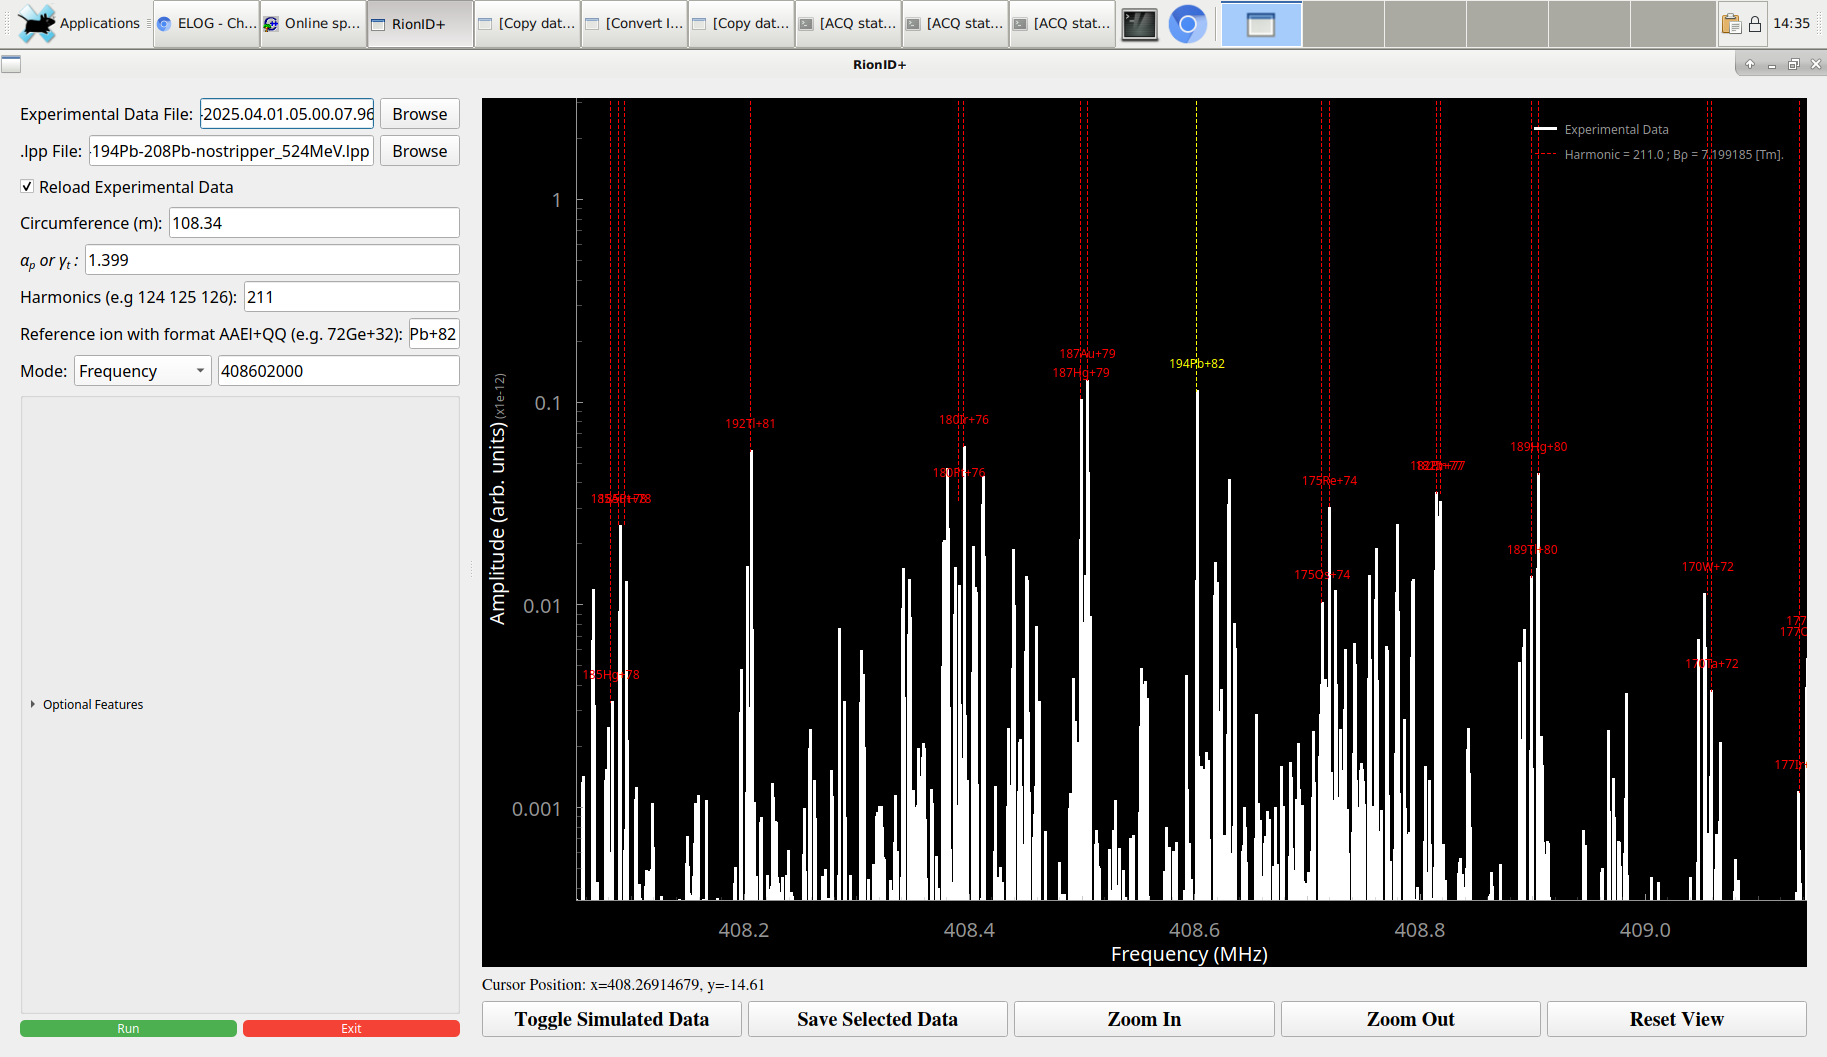
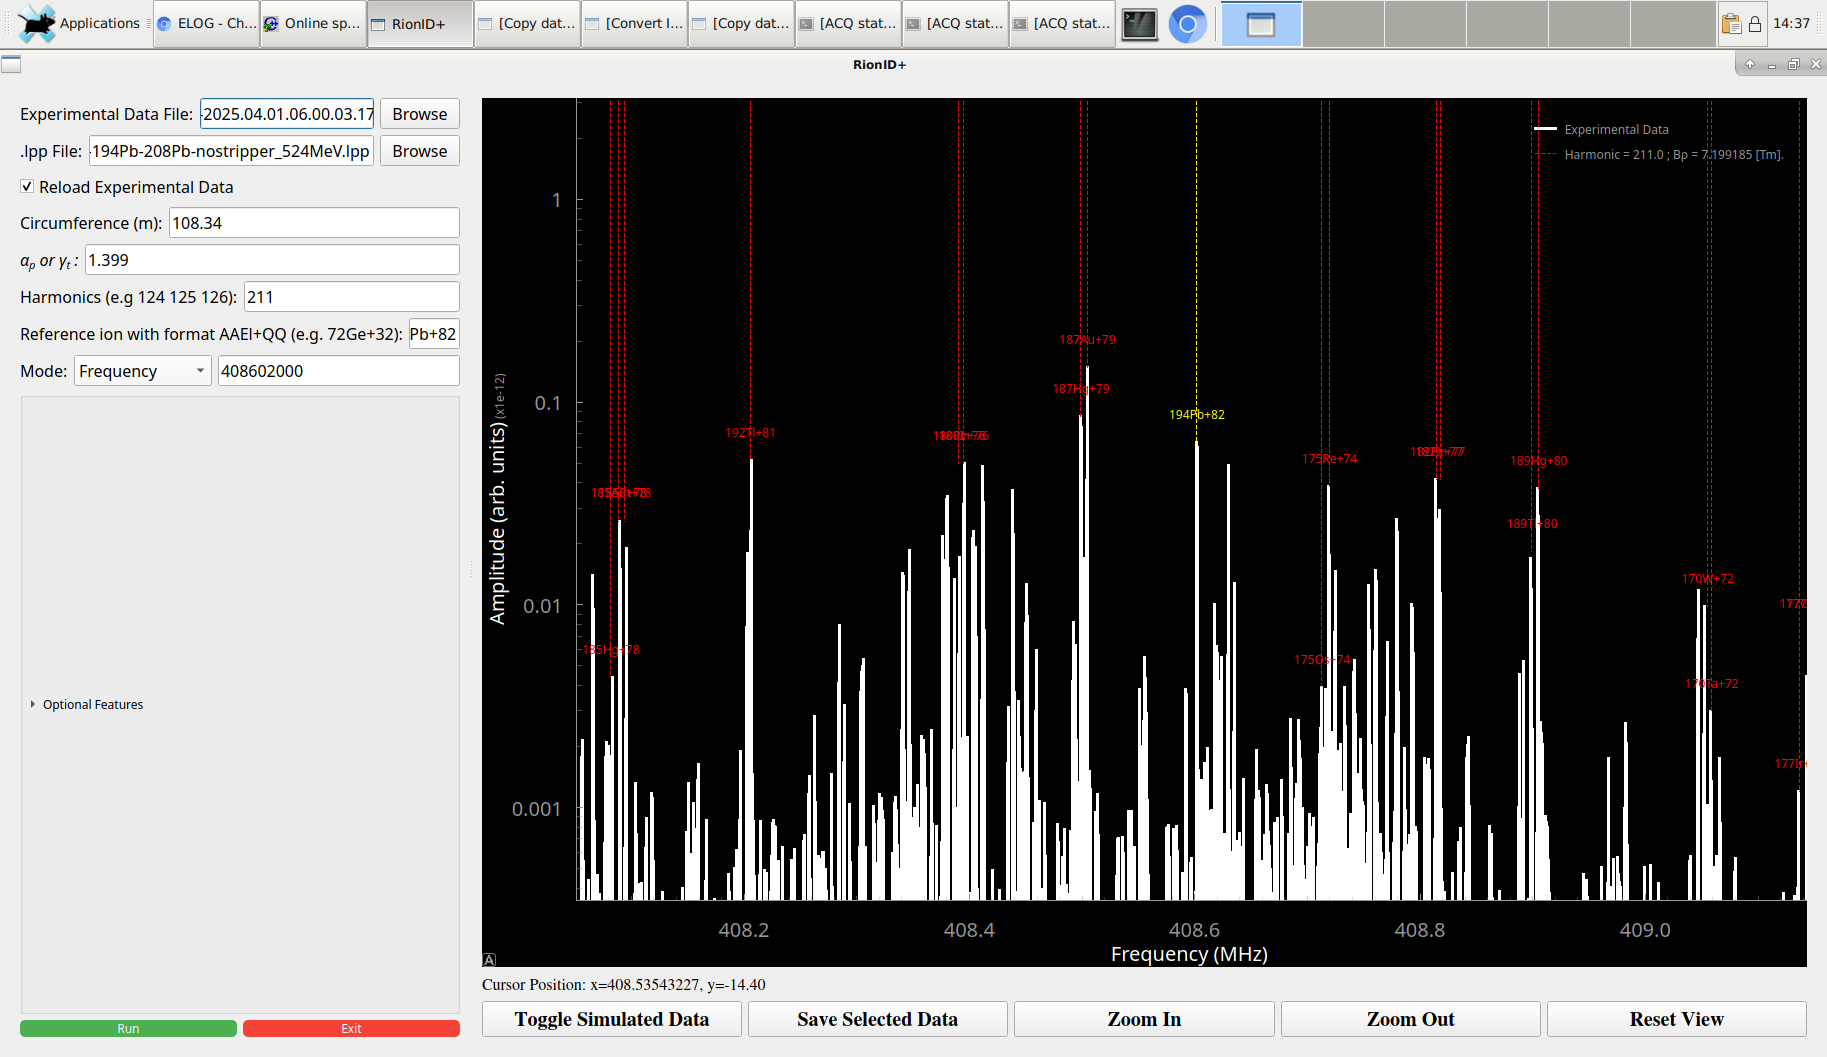
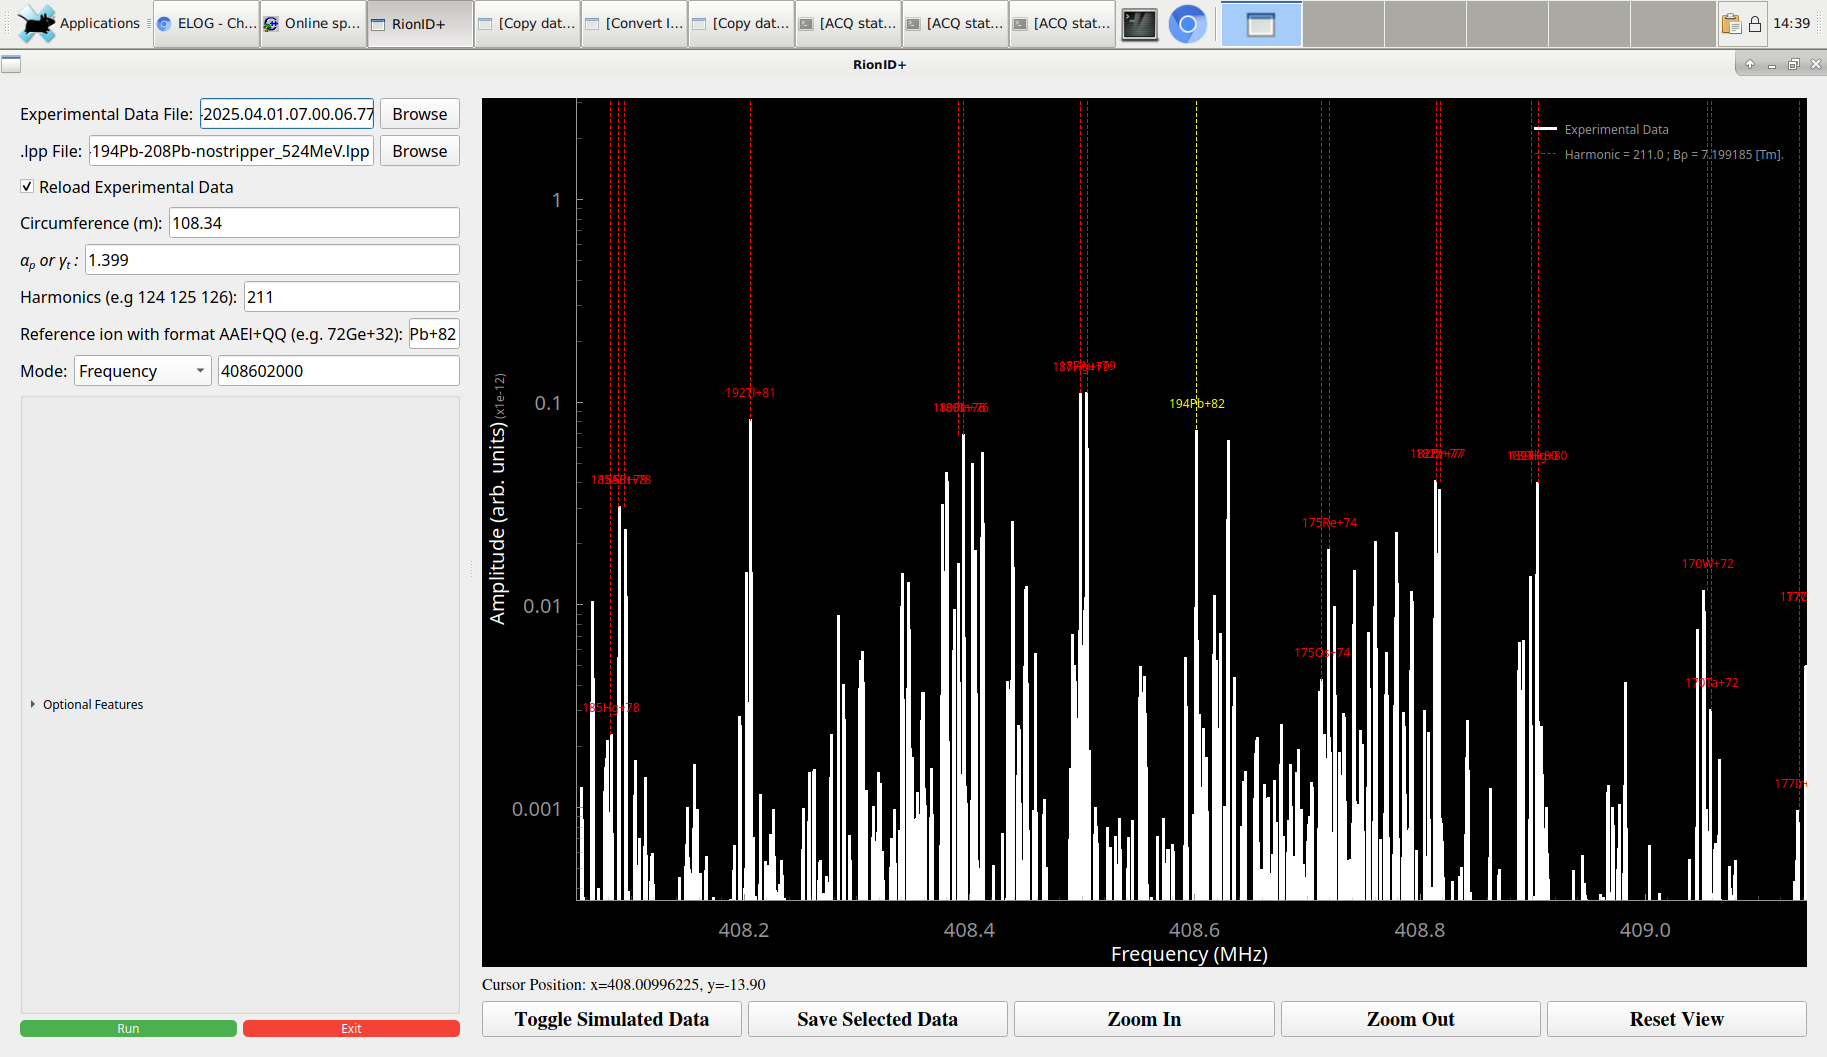
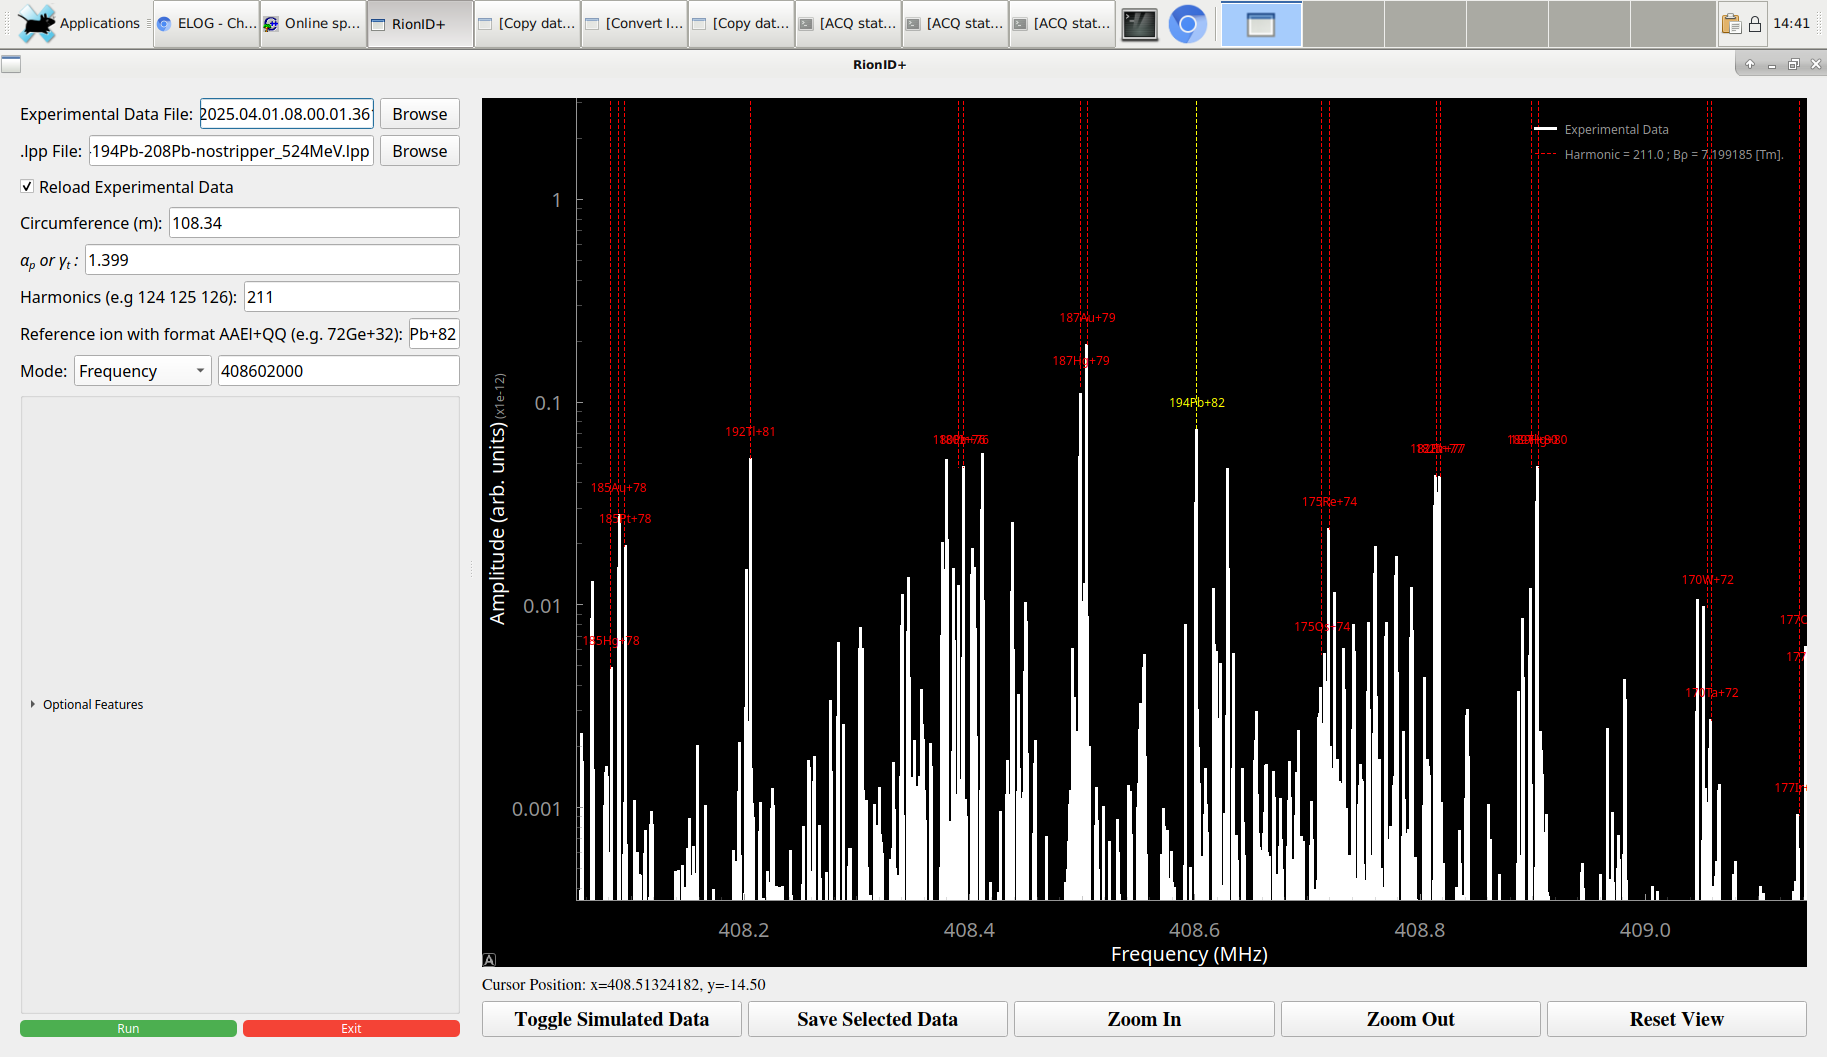
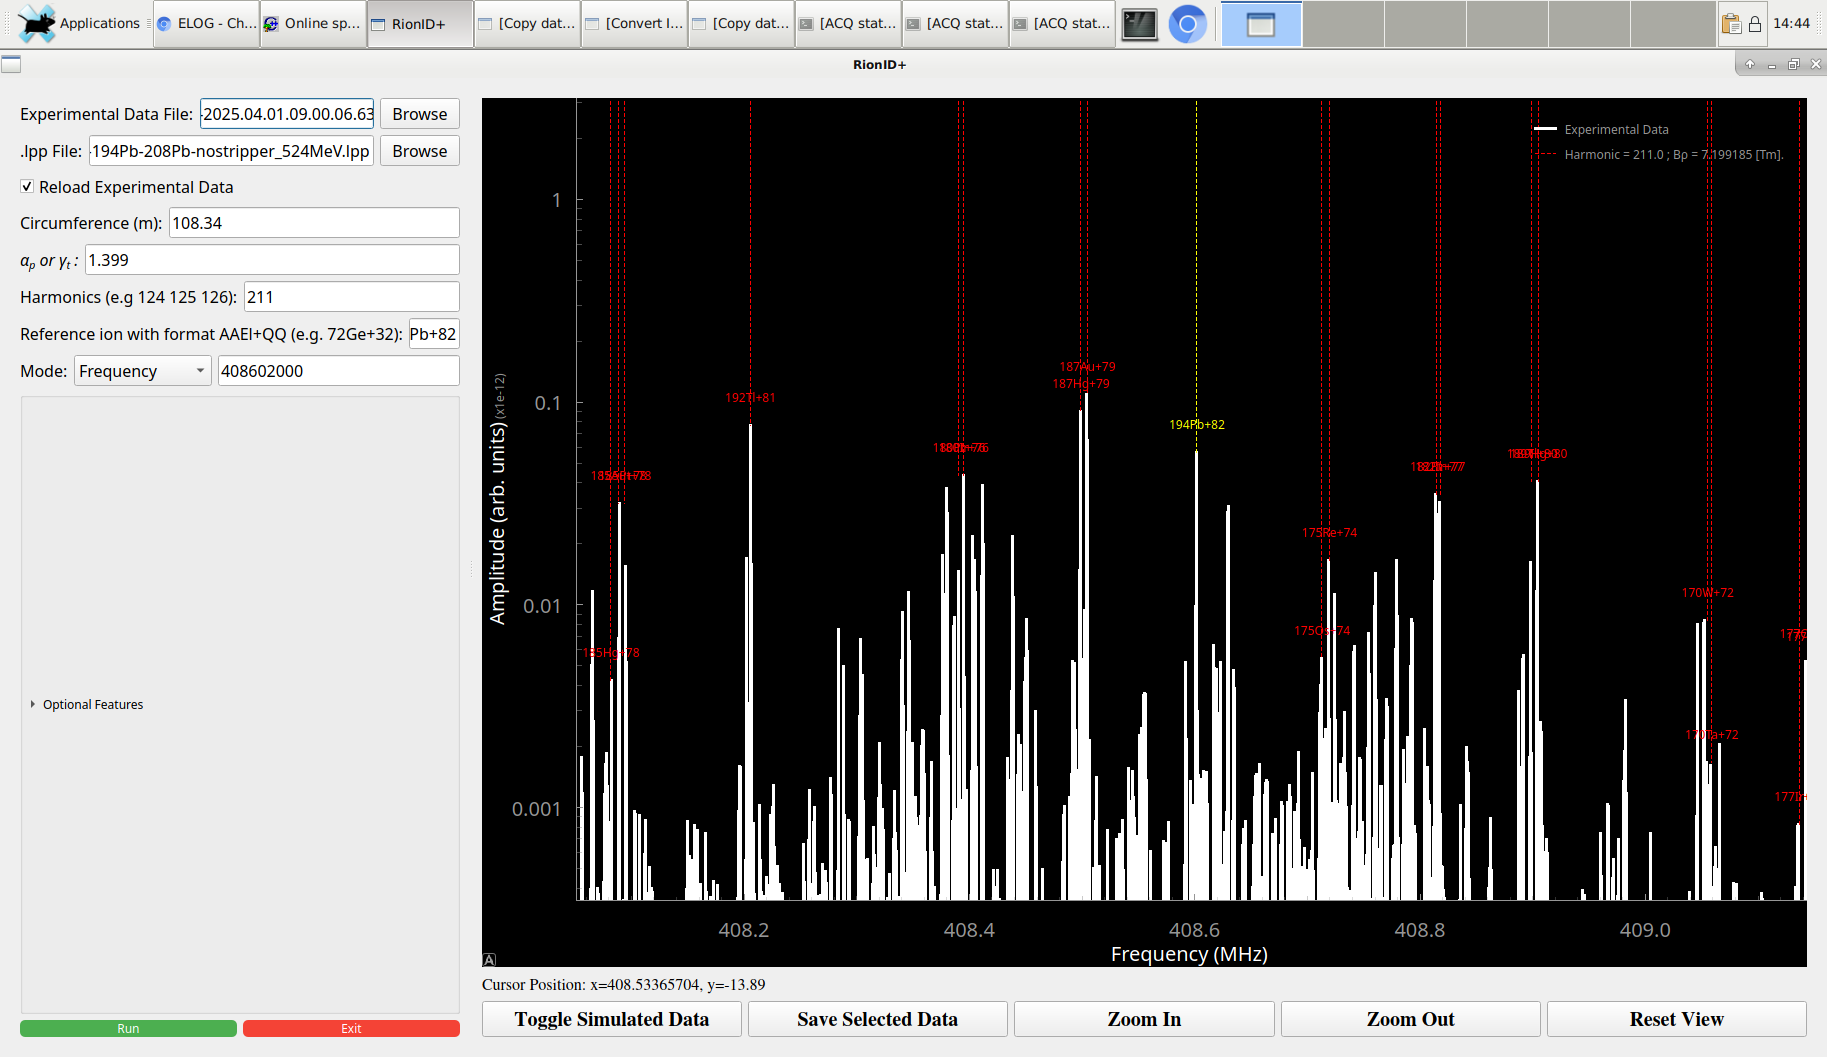
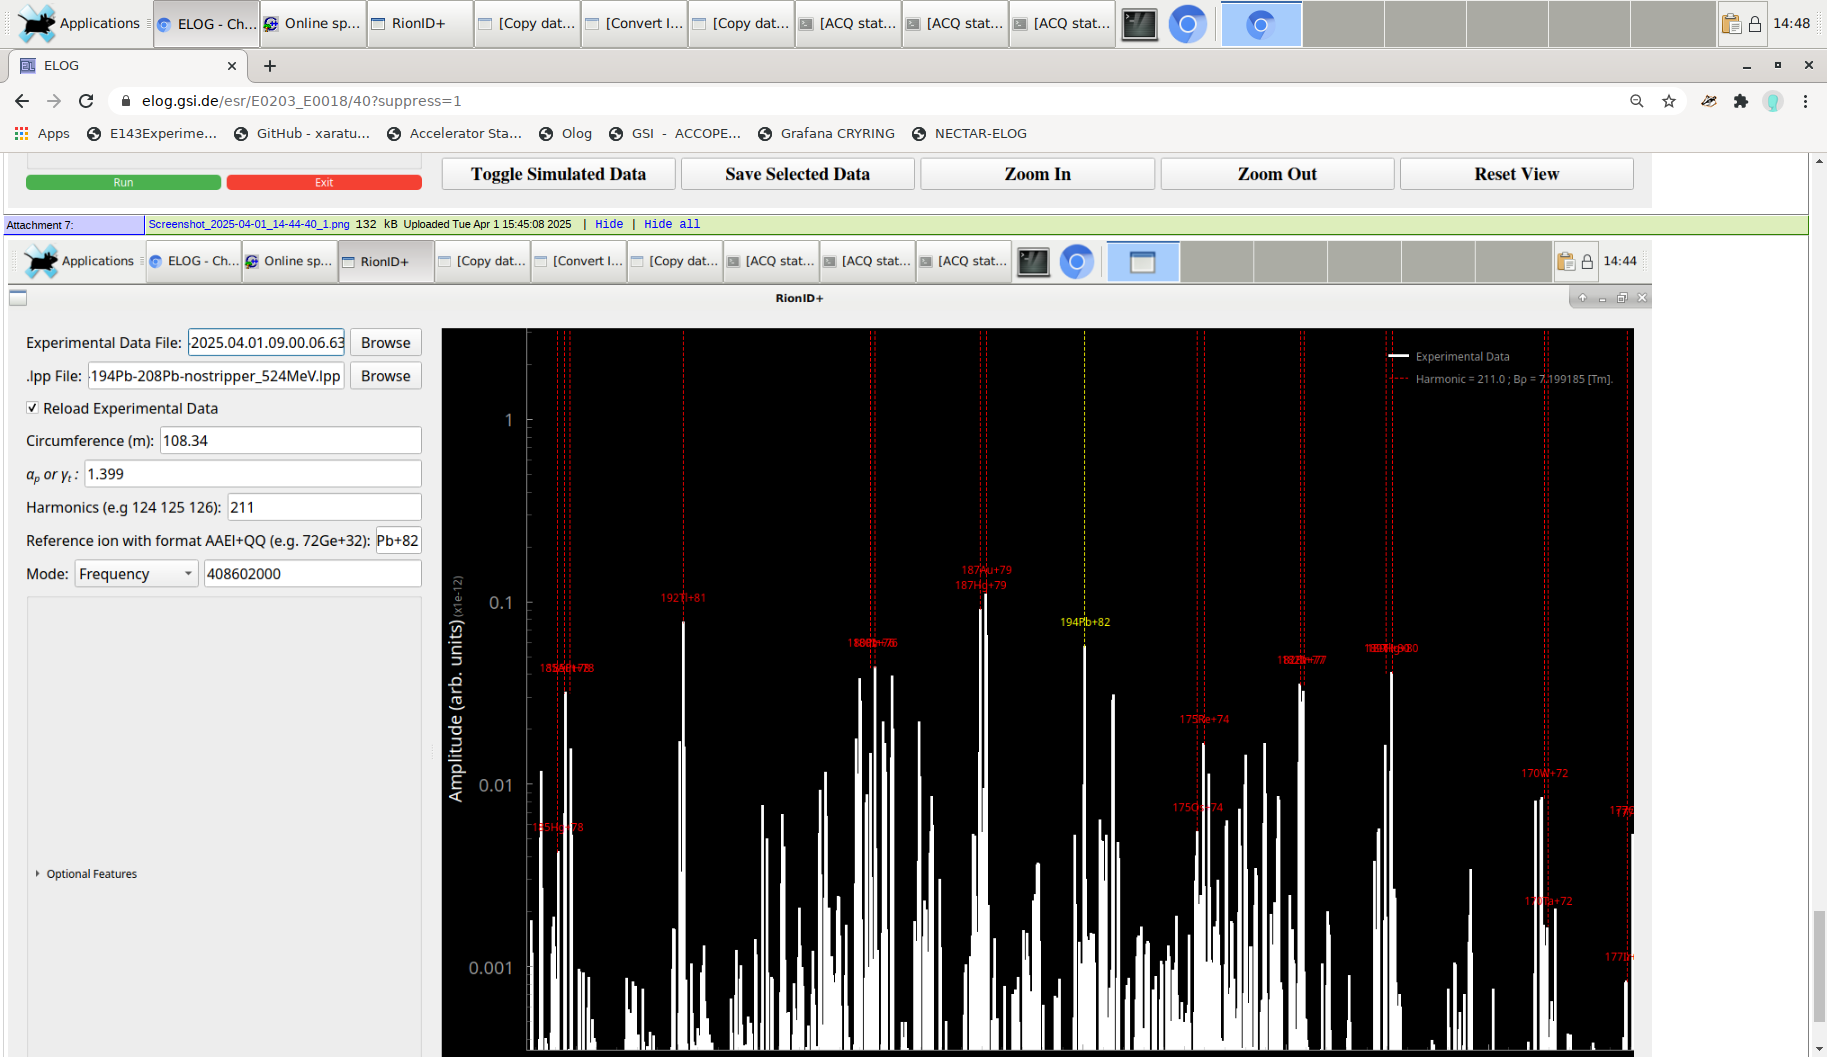
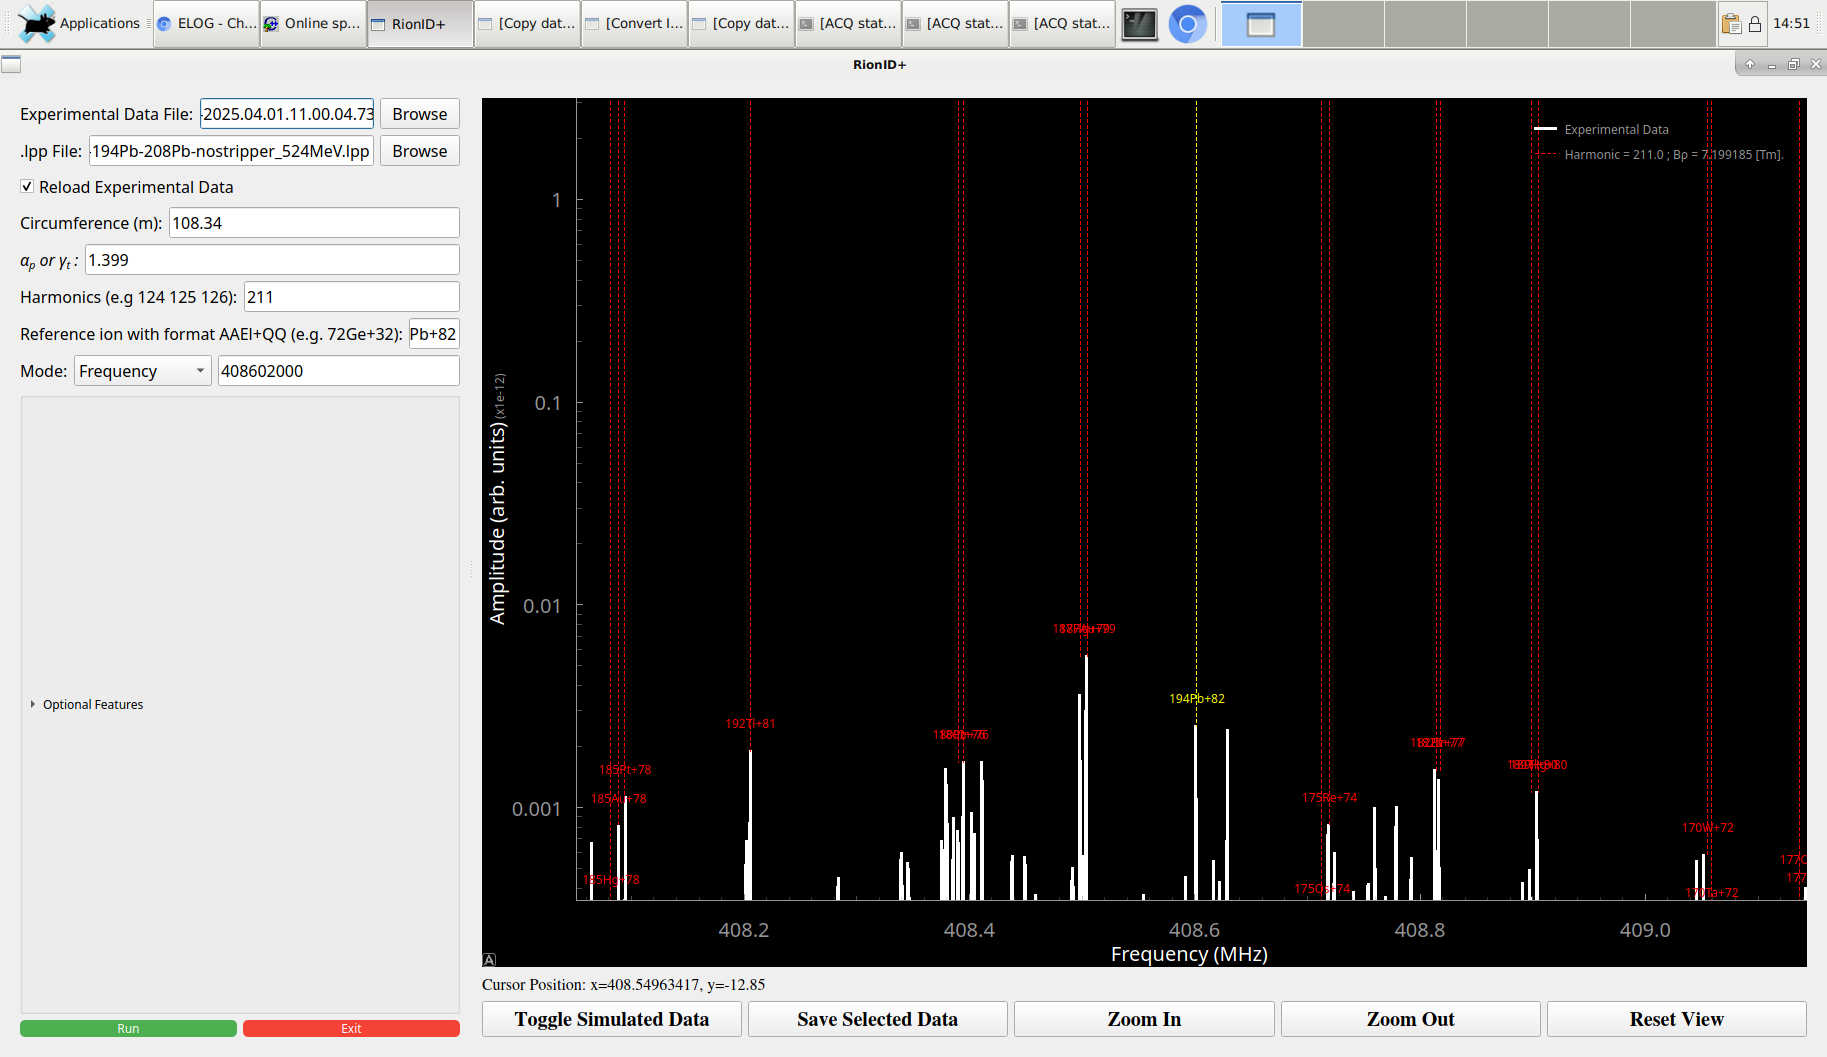
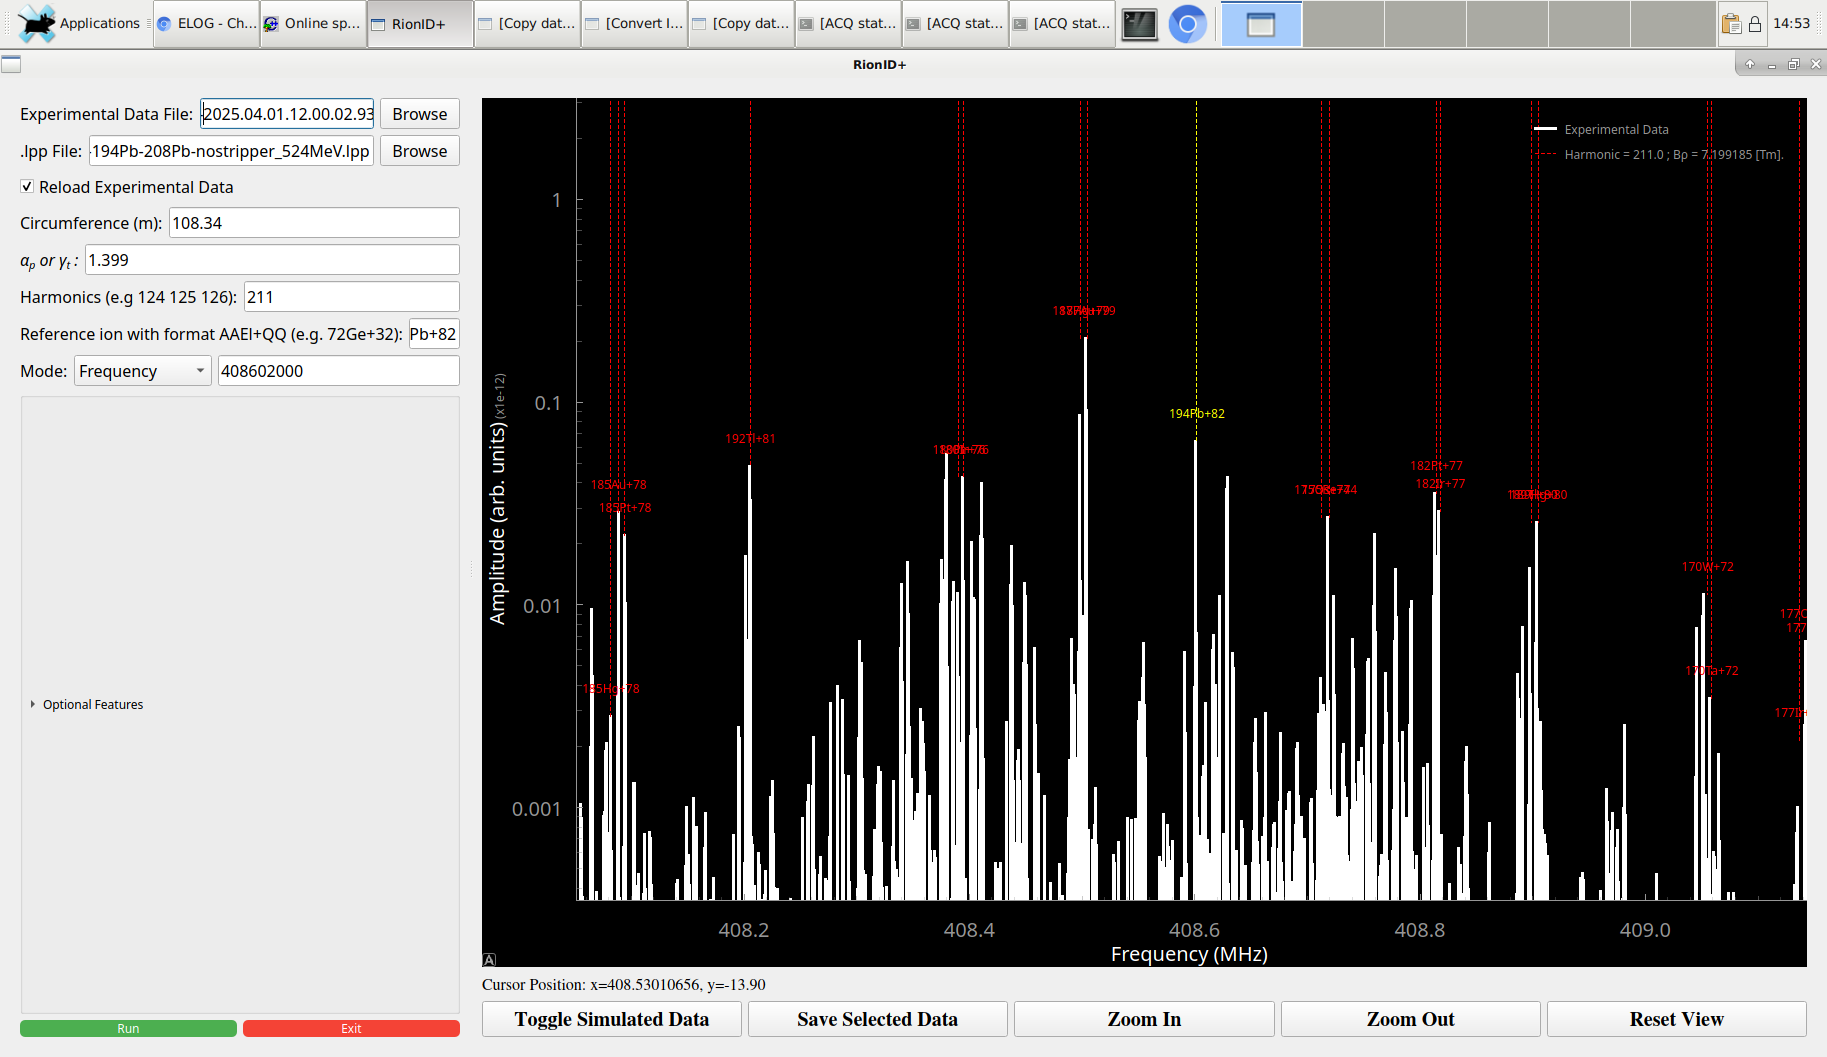
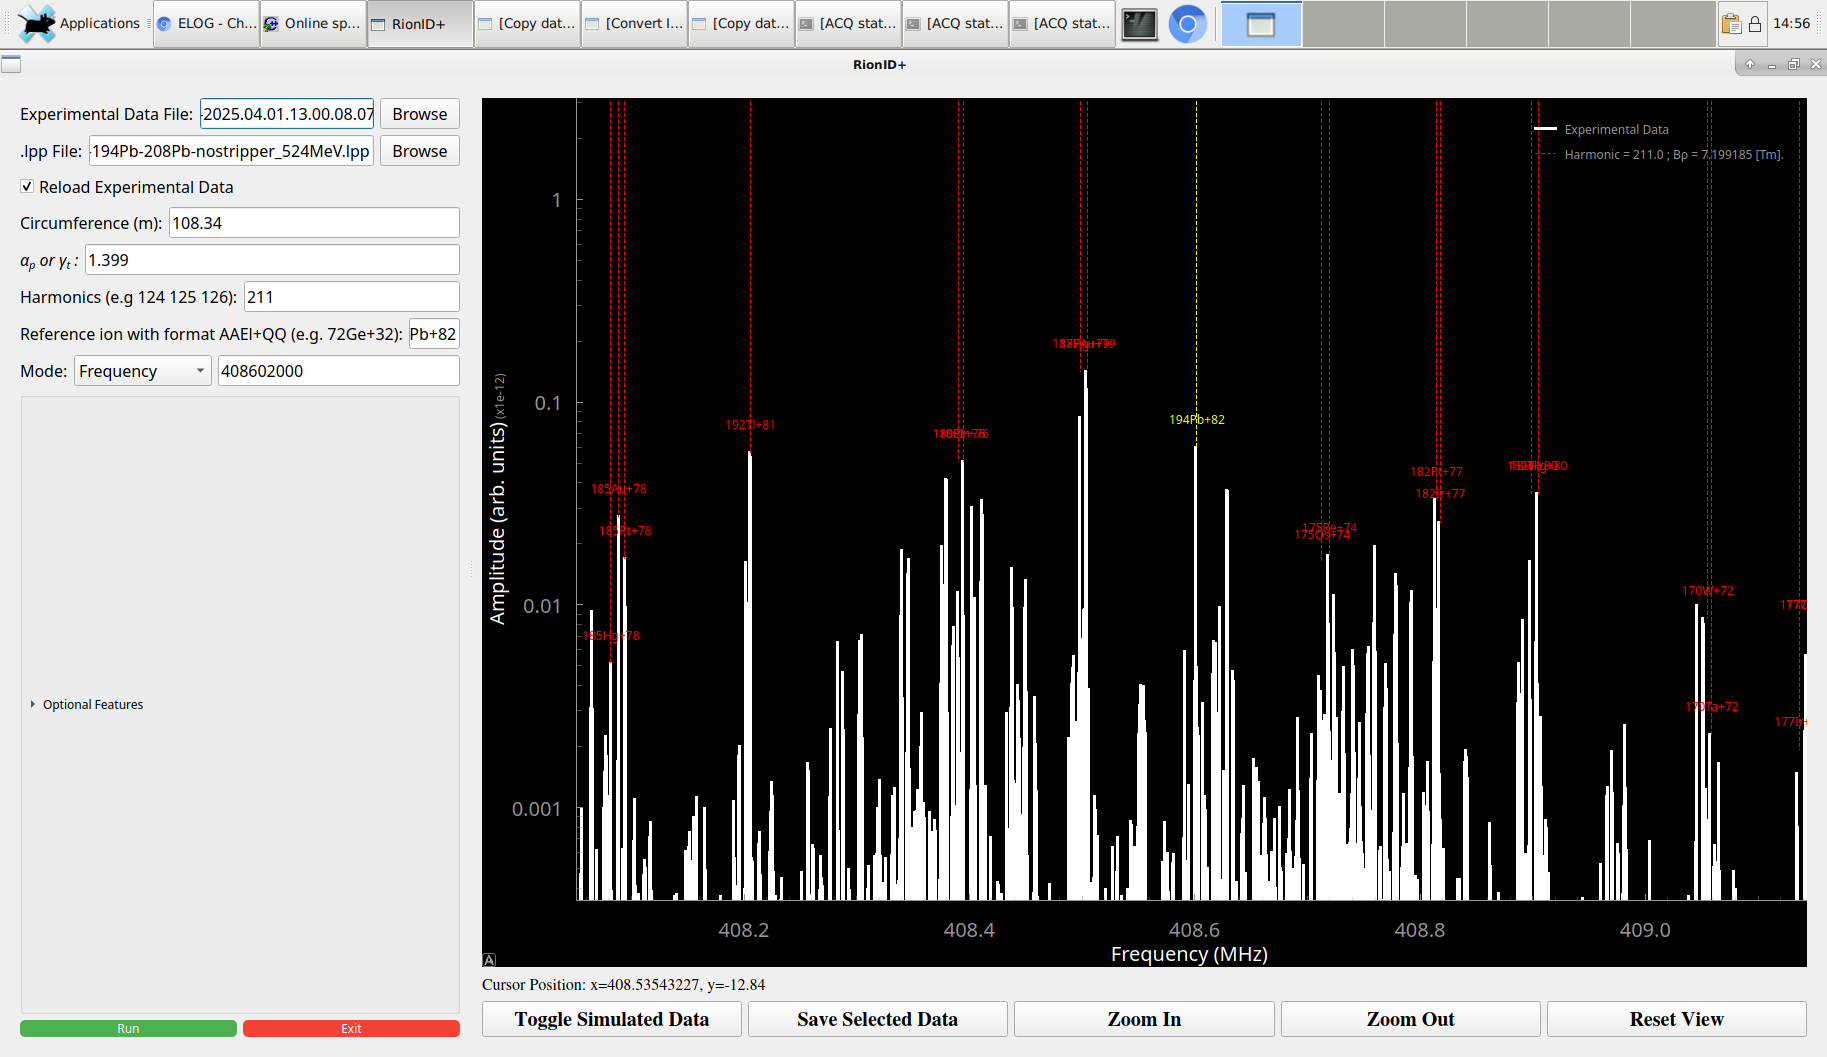
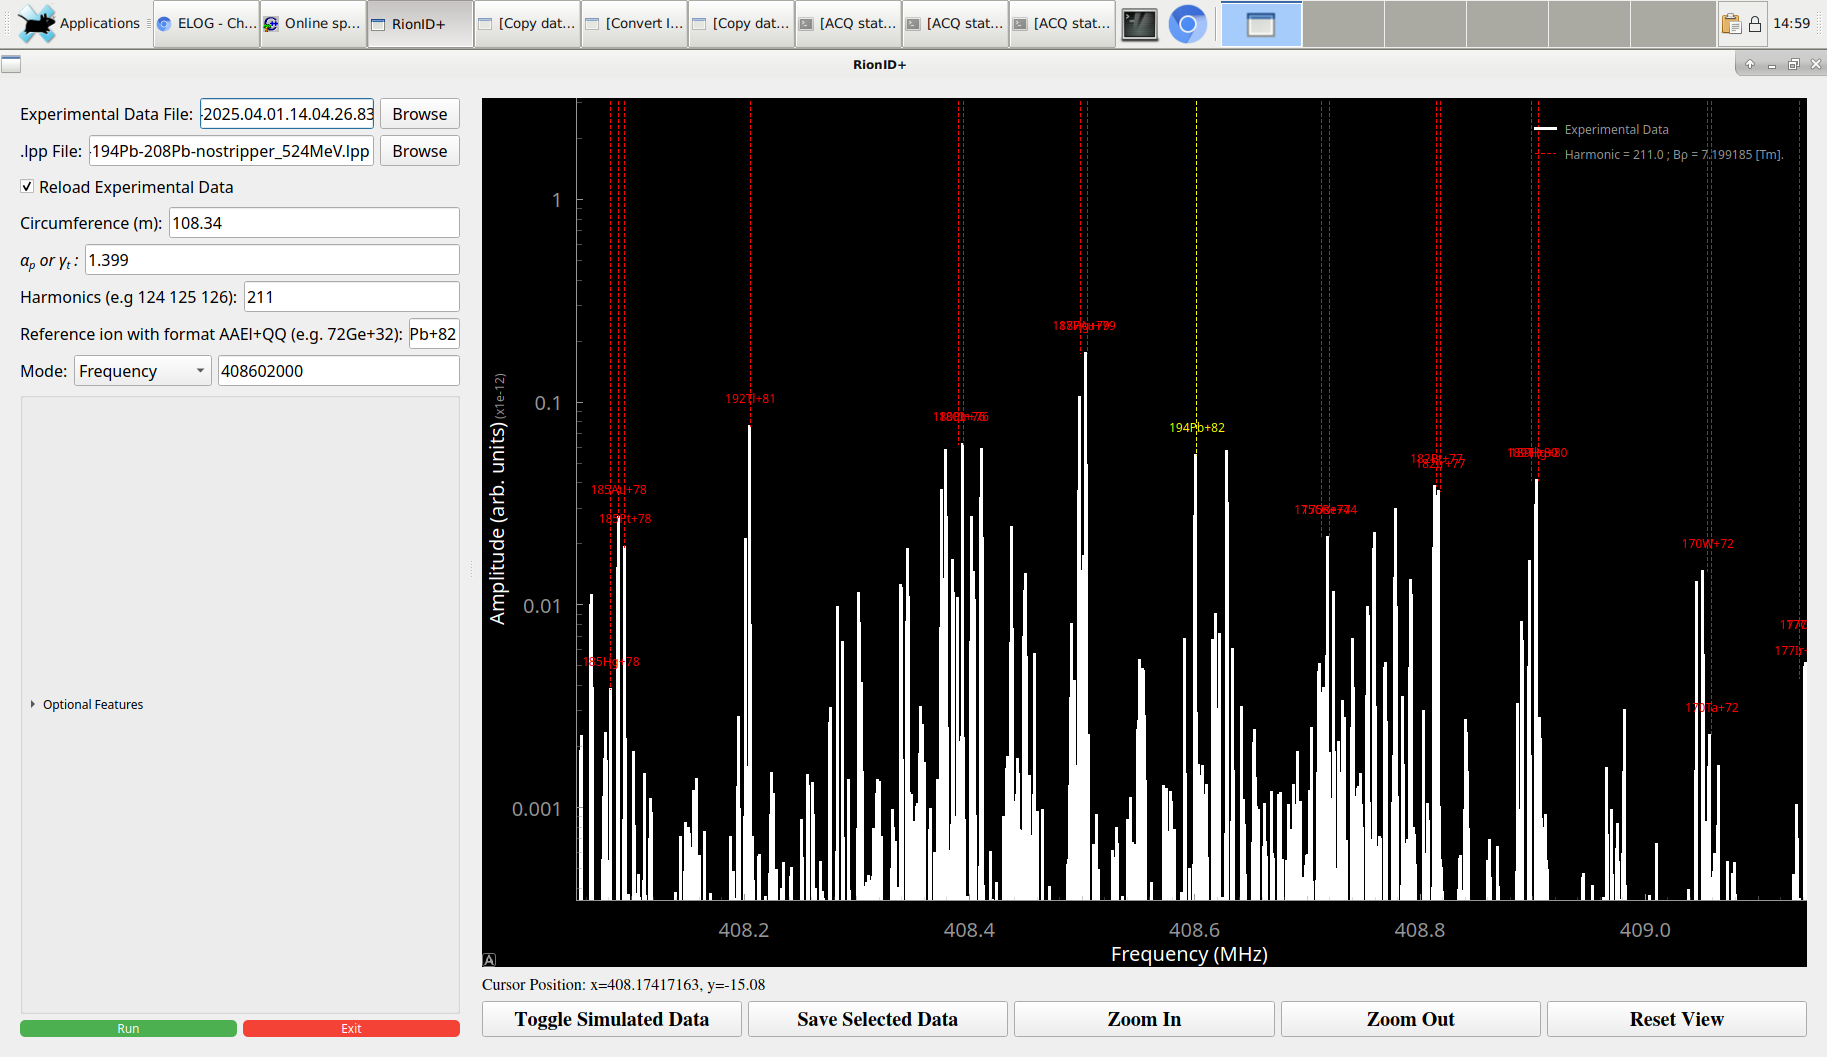
ruijiu | Analysis | The frequency of 194Pb82+ has been changed from 408.606MHz to 408.602MHy during last 12 hours |
The following images display the frequency spectrum at the start of every hour from 3:00 to 14:00. |
| Attachment 1: Screenshot_2025-04-01_14-30-33.png
|
|
| Attachment 2: Screenshot_2025-04-01_14-33-01.png
|
|
| Attachment 3: Screenshot_2025-04-01_14-35-35.png
|
|
| Attachment 4: Screenshot_2025-04-01_14-37-57.png
|
|
| Attachment 5: Screenshot_2025-04-01_14-40-03.png
|
|
| Attachment 6: Screenshot_2025-04-01_14-41-58_1.png
|
|
| Attachment 7: Screenshot_2025-04-01_14-44-40_1.png
|
|
| Attachment 8: Screenshot_2025-04-01_14-48-49_1.png
|
|
| Attachment 9: Screenshot_2025-04-01_14-51-11_1.png
|
|
| Attachment 10: Screenshot_2025-04-01_14-54-02.png
|
|
| Attachment 11: Screenshot_2025-04-01_14-56-15.png
|
|
| Attachment 12: Screenshot_2025-04-01_14-59-24.png
|
|
|
18
|
Tue Apr 1 02:03:33 2025 |
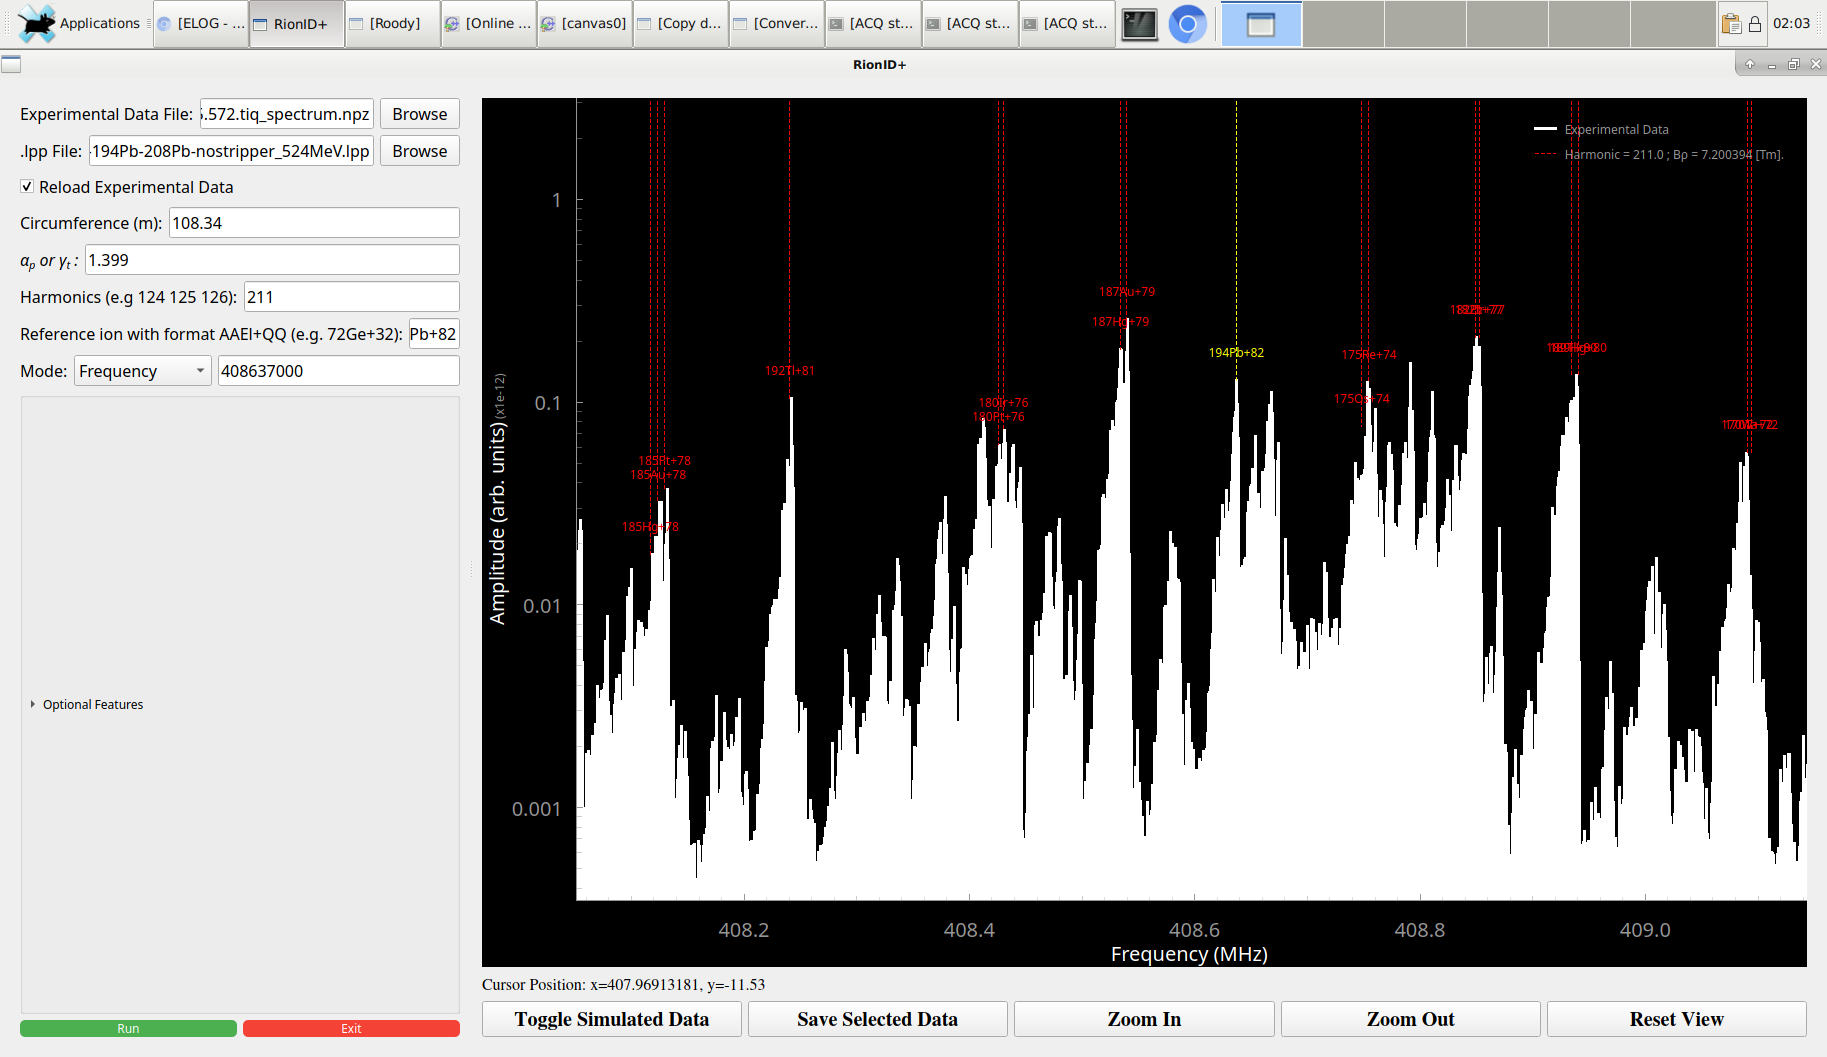
ruijiu | Analysis | The frequency of 194Pb82+ has been changed from 408.522 MHz to 408.637 MHz |
this is the new setting after we lost the old one.


datafile = "/data.local/G22-00018_00203/results/analyzers/RSA01/RSA01-2025.04.01.00.55.55.572.tiq_spectrum.npz"
filep = "/data.local/G22-00018_00203/scripts/OnlineDataAnalysisSystem/rionid_exercises/exercise_194Pb_Exp_2025/New_TEline2022-ESR-194Pb-208Pb-nostripper_524MeV.lpp"
alphap = "1.399"
harmonics = "211"
refion = "194Pb+82"
circumference = "108.34"
mode = "Frequency"
value = "408637000"
reload_data = true
nions = "100" |
| Attachment 1: Screenshot_2025-04-01_02-03-14.png
|
|
|
77
|
Wed Apr 2 11:09:42 2025 |
Michael, Alex | Accelerator | The beam is back in the ESR |
We have the beam again the ESR since around 11:00.
The Schottky spectra look the same as before.
The ESR experts could not exactly identify the problem which caused this loss of the beam. |
|
75
|
Wed Apr 2 10:31:15 2025 |
Michael, Alex | Accelerator | The beam is back from 10:10 |
|
|
68
|
Wed Apr 2 07:39:41 2025 |
Michael, Alex | General | The beam is back at 07:35 |
|
|
71
|
Wed Apr 2 08:47:27 2025 |
Michael, Alex | General | The beam is back |
The beam is back. But, the experts have found a problem with one of the modules of the SIS kicker magnet. And, currently they have disabled this module. This fixed the problem. However, since the kicker system is not running with full power, it is not clear by how much this can affect the extracted beam intensity for the ESR. Therefore,  the ESR experts have been called and they will look at the injected beam intensity in the ring, in order to know if its still the same as before disabling the module.
The experts will discuss at the upcoming meeting how to proceed with the damaged module, i.e. when to repair it.
In addition, the FRS started to take the beam now (again) which means that we will be getting less pulses from SIS as compared to the previous night. |
|
328
|
Wed Apr 9 11:09:48 2025 |
Wolfram | General | Thanks to everybody for their committment to perform this experiment |
|
|
33
|
Tue Apr 1 10:03:56 2025 |
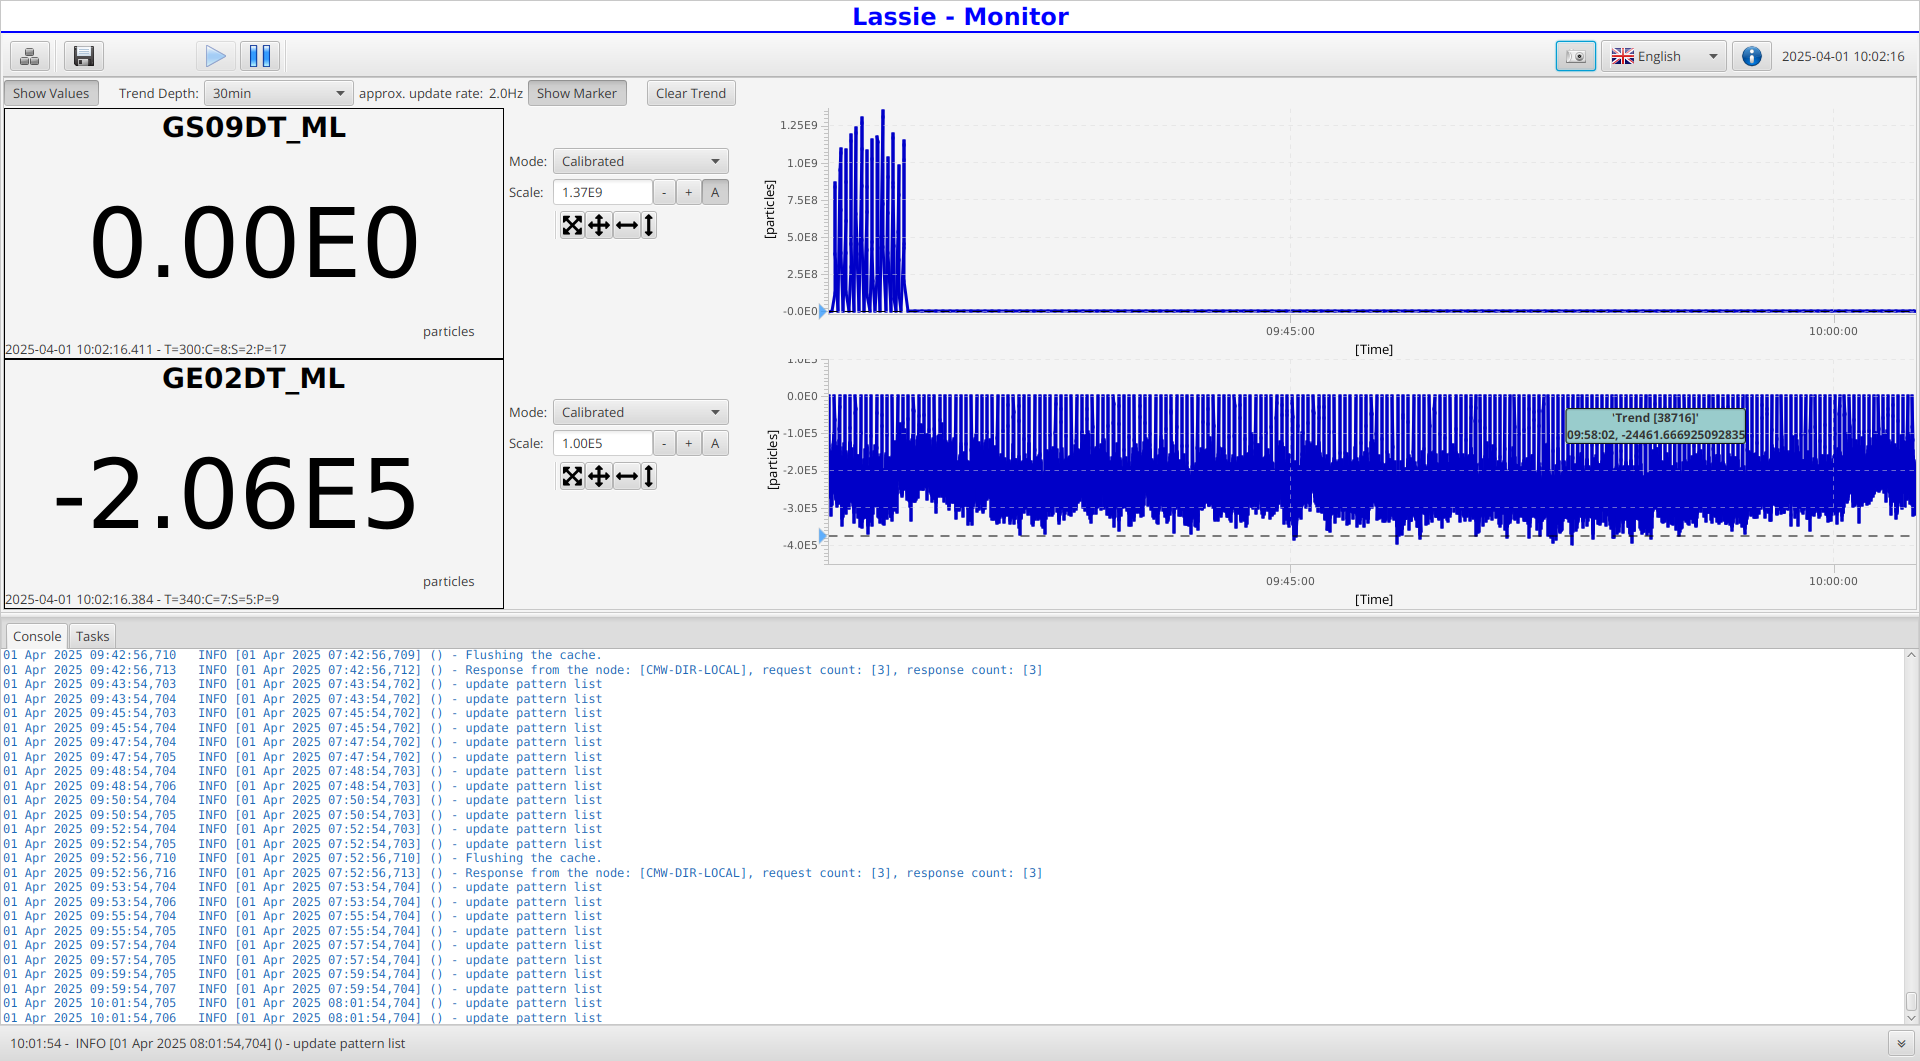
Jelena B, Siddharth | General | Technical issue with SIS18 |
From HKR info: there is a technical issue with SIS18 and we will have no beam for next 25 minutes. |
| Attachment 1: 2025-04-01_10-02-16-454_tcl1064.png
|
|
|
116
|
Thu Apr 3 09:43:14 2025 |
All | Accelerator | Stop 194Pb, switch to 208Pb82+ |
The repair of SIS electron cooler power supplies

In the meantime we received a few injections and confirmed that 194Pb setting is still as it was before entering into the ESR

Now we change to 208Pb82+ to do several ESR accelerator tests

Esis = 517 MeV/u
Change the beamline to 208 Pb 82+ and the ESR to 208 b 82+ and NO other changes |
|
82
|
Wed Apr 2 15:07:52 2025 |
Michael, Alex, Maeve | Accelerator | Still not a good beam in the ESR |
The (power supply of) SIS kicker magnet has been repaired and the beam has been restored from about 14:20.
But, the Schottky spectrum in the ESR looked pretty bad, so the measurement can not be restarted.
The accelerator experts are currently looking into this problem. |
|
89
|
Wed Apr 2 18:22:30 2025 |
ID | General | Spill cycle distribution |
The spill cycle distributions is absolutely nuts since beginning of the shift. On the positive side: we got a lot of spills since FRS did not take many, so I think we got more than our parasitic 1:10 share... |
|
246
|
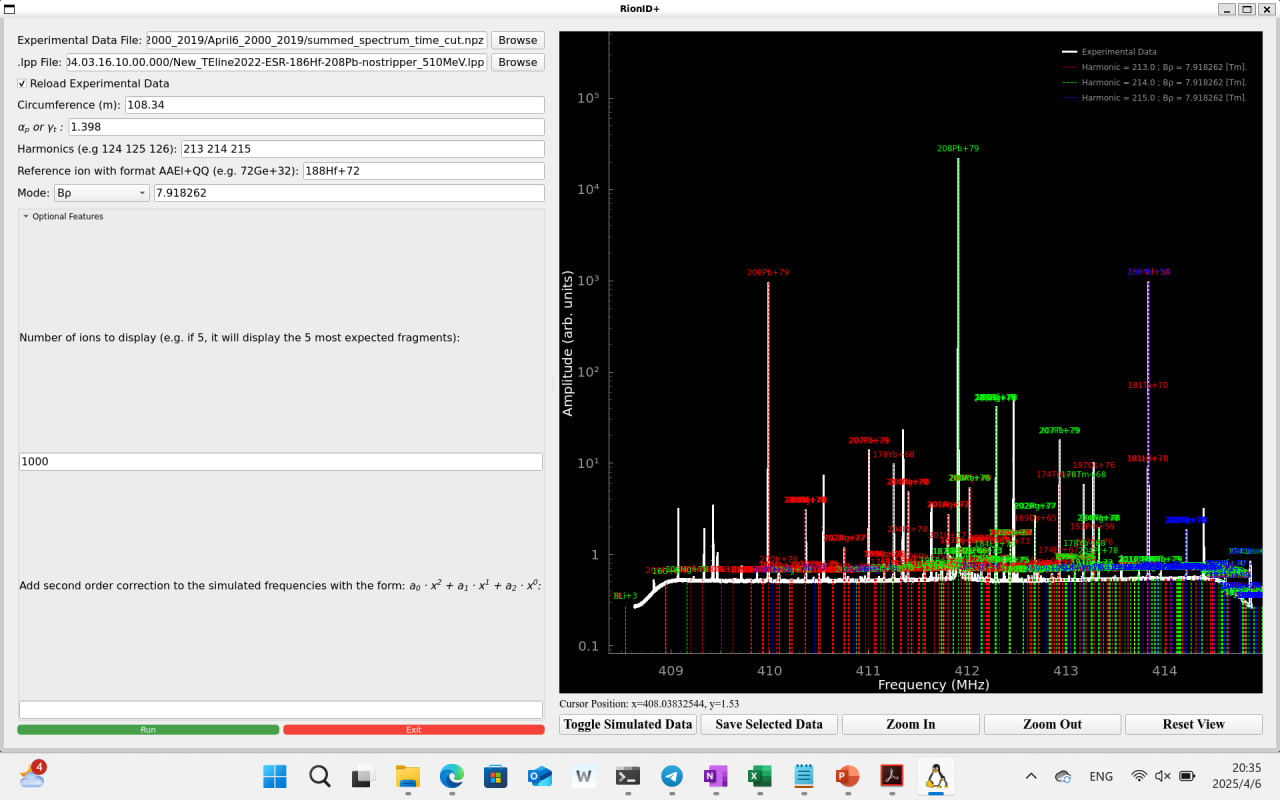
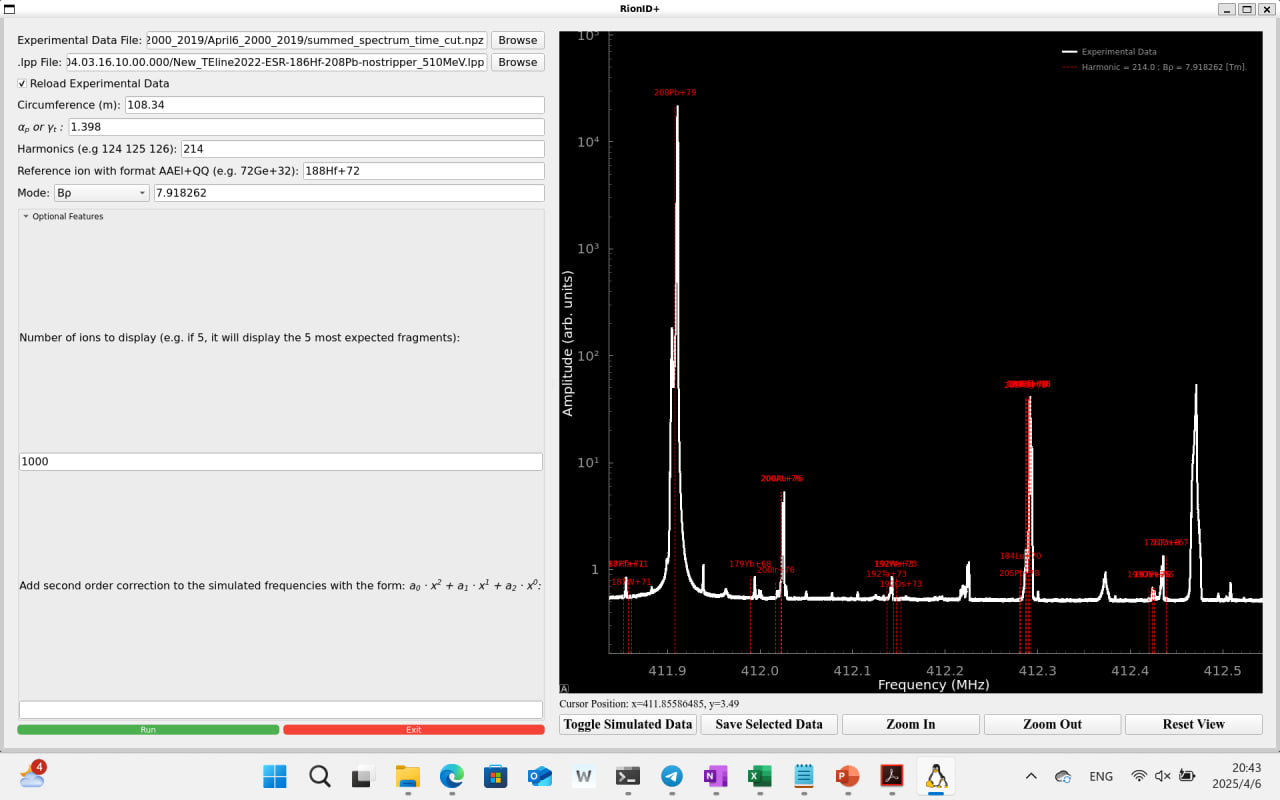
Sun Apr 6 20:49:25 2025 |
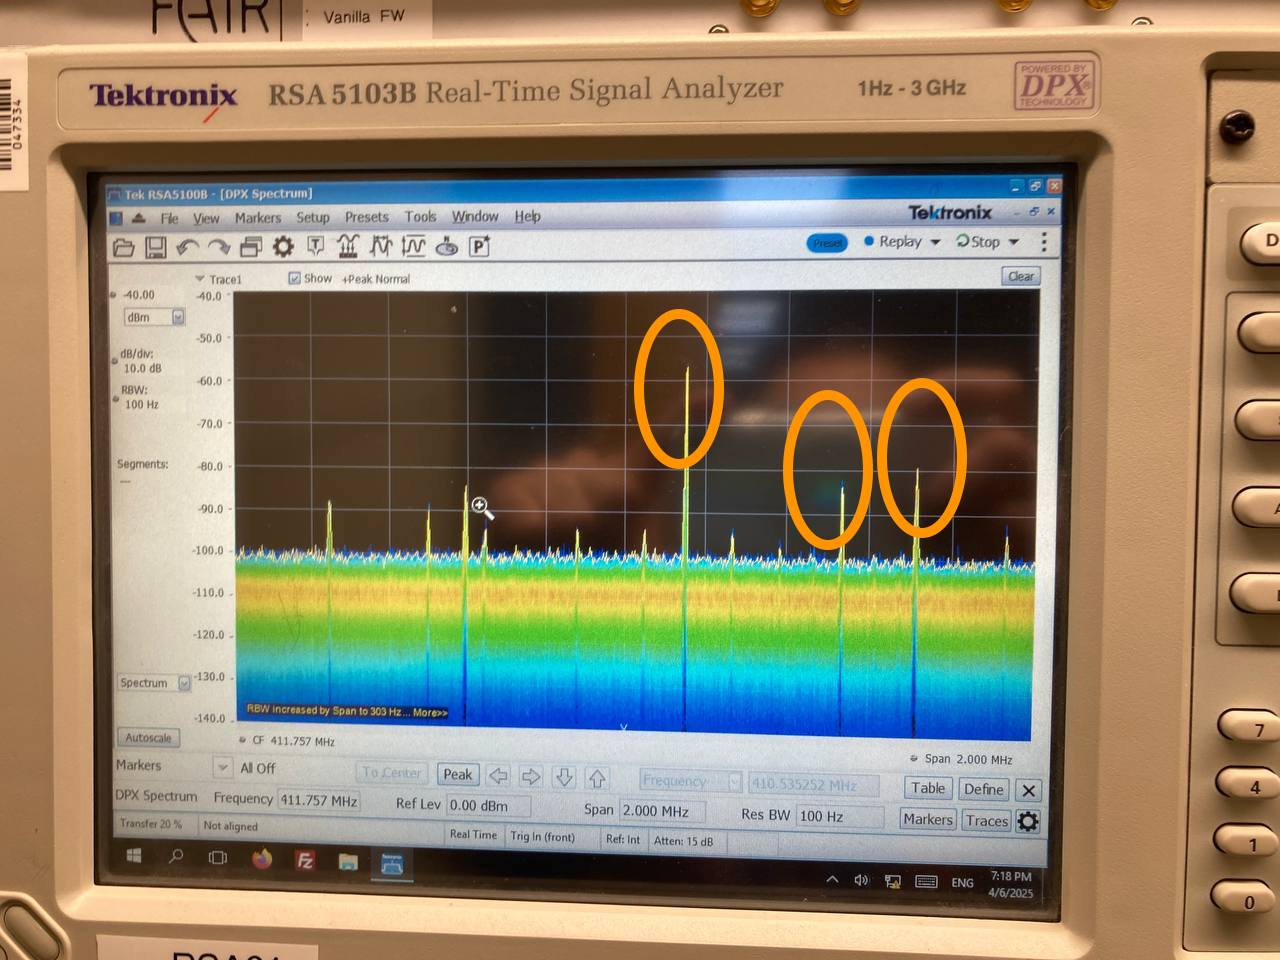
Ruijiu Chen | Analysis | Spectrum during April 6 20:00- 20:19 |
|
| Attachment 1: photo_2025-04-06_20-50-27.jpg
|
|
| Attachment 2: photo_2025-04-06_20-50-50.jpg
|
|
| Attachment 3: photo_2025-04-06_20-51-02.jpg
|
|
| Attachment 4: summed_spectrum_time_cut.npz
|
|
78
|
Wed Apr 2 12:13:57 2025 |
Michael, Alex | Accelerator | Some empty injections triggered while beam patterns are changed |
Operators seem to play with spill cycles, we get every 1:1 shot, then 1:10 again. During this, we noticed a few "empty injections" beeing triggered in the RSAs. They light up green, but spectrum is flat. Then it returns to normal operation again. |