|
HOME
ESR
EXPERIMENTS
LABS etc
|
|
E121
E127
E132
E125
E143
laser_cooling_2021
E142
Ê128
E146
E0052
E0018
E0028
E0038
E0075
E0203_E0018
E0052_2025
E0281 - NEEC
|
| Nuclear hyperfine mixing in 229Th89+ |
Not logged in |
 |
|
|
|
Message ID: 147
Entry time: Fri Apr 8 01:48:57 2022
|
| Author: |
Patrick |
| Category: |
DAQ |
| Subject: |
Bugged Trending plots? |
|
|
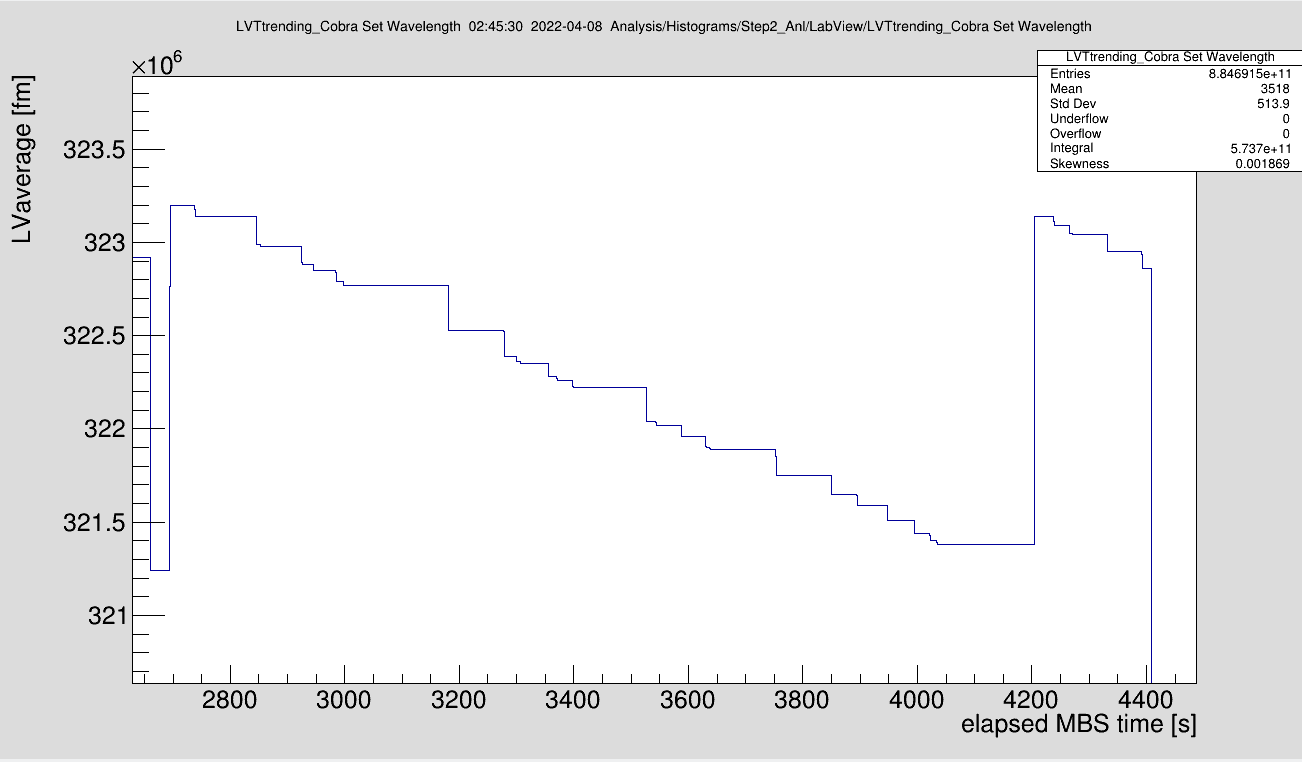
The wavelengths/frequencies shown in the graph in the labview window do not match the wavelengths/frequencies in go4.
Compare the picture which shows an incomplete laser scan although the scans in the labview window are completed (The measurement was started at an 'elapsed MBS time' of 2700s and took 1700s/28min).
However, the displayed time is correct. Only the data seems to be "stretched".
The same is true for the 'XUV anode' detector. The counter in the electronic module is ahead of the displayed count rate in go4.
Additional Note: The 'Cobra set wavelength' plot shows wavelengths which seem to be measured. However, we would expect deterministic setpoints from the software, see picture. |
|

|