| ID |
Date |
Author |
Category |
Subject |
|
113
|
Sun May 9 20:39:17 2021 |
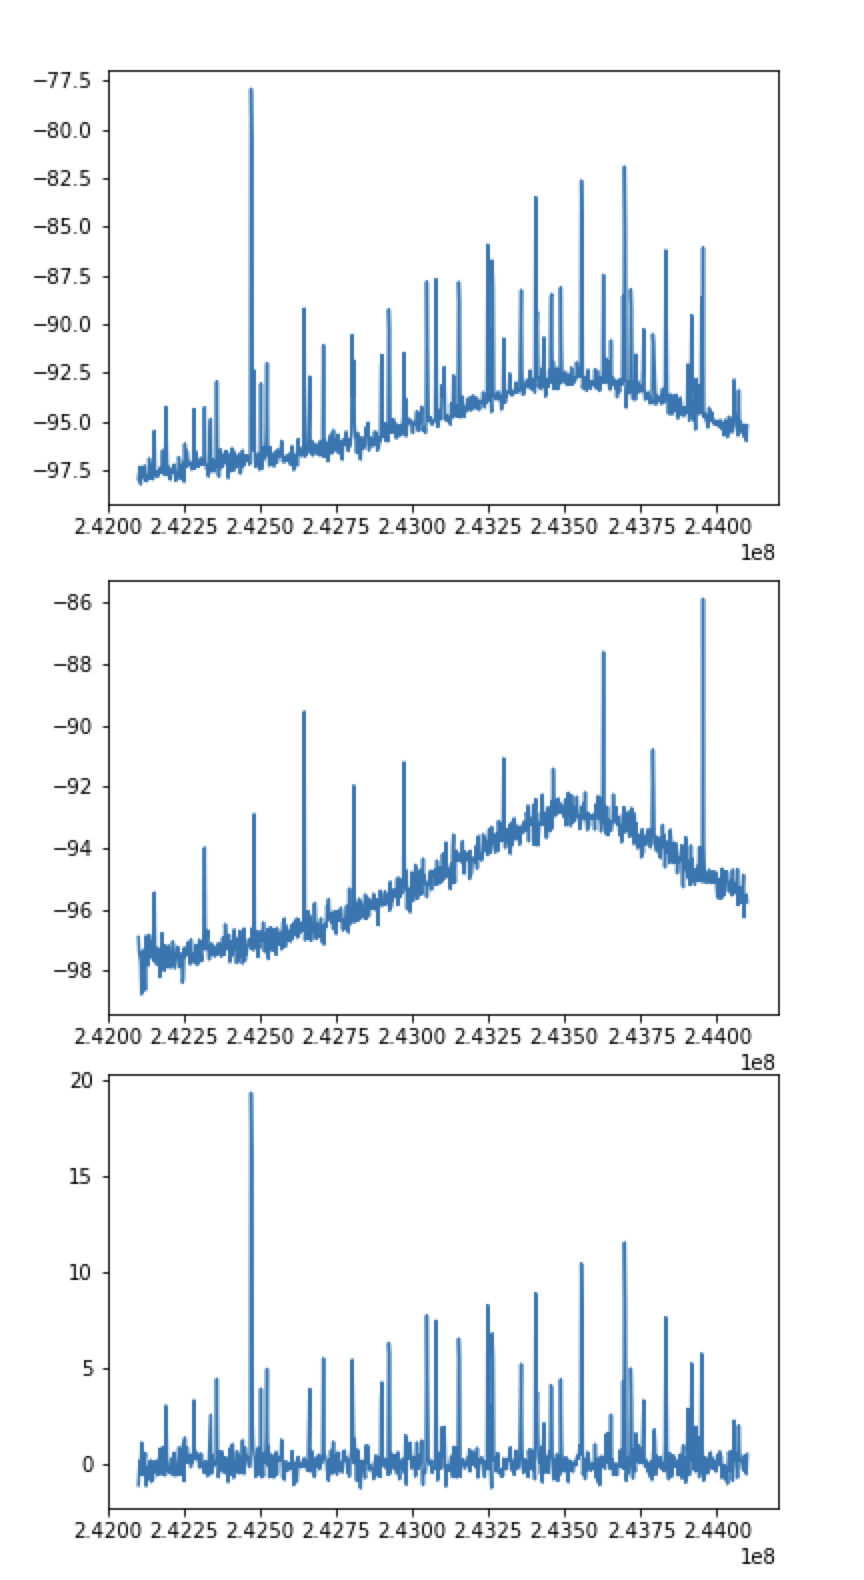
Shahab | Runs | Subtracting the background |
still in the search of 70-Se |
| Attachment 1: spectrum_subtraction.png
|
|
|
140
|
Tue Jun 29 21:10:30 2021 |
Shahab | Runs | 72-Ge setting |
the new setting is roughly 400 khz lower in frequency.
Previous beam time Ge was on 243.100 now it is on 242.74

we decided to use the higher harmonic:

expecting it on 244.66 MHz |
|
145
|
Wed Jun 30 01:38:20 2021 |
Shahab | Runs | beam is back from Linac but not in the ESR |
|
|
146
|
Wed Jun 30 02:12:46 2021 |
Shahab | Runs | still no beam in ESR: quadrupole magnets are down |
still no beam in ESR: quadrupole magnets are down |
|
151
|
Wed Jun 30 13:04:40 2021 |
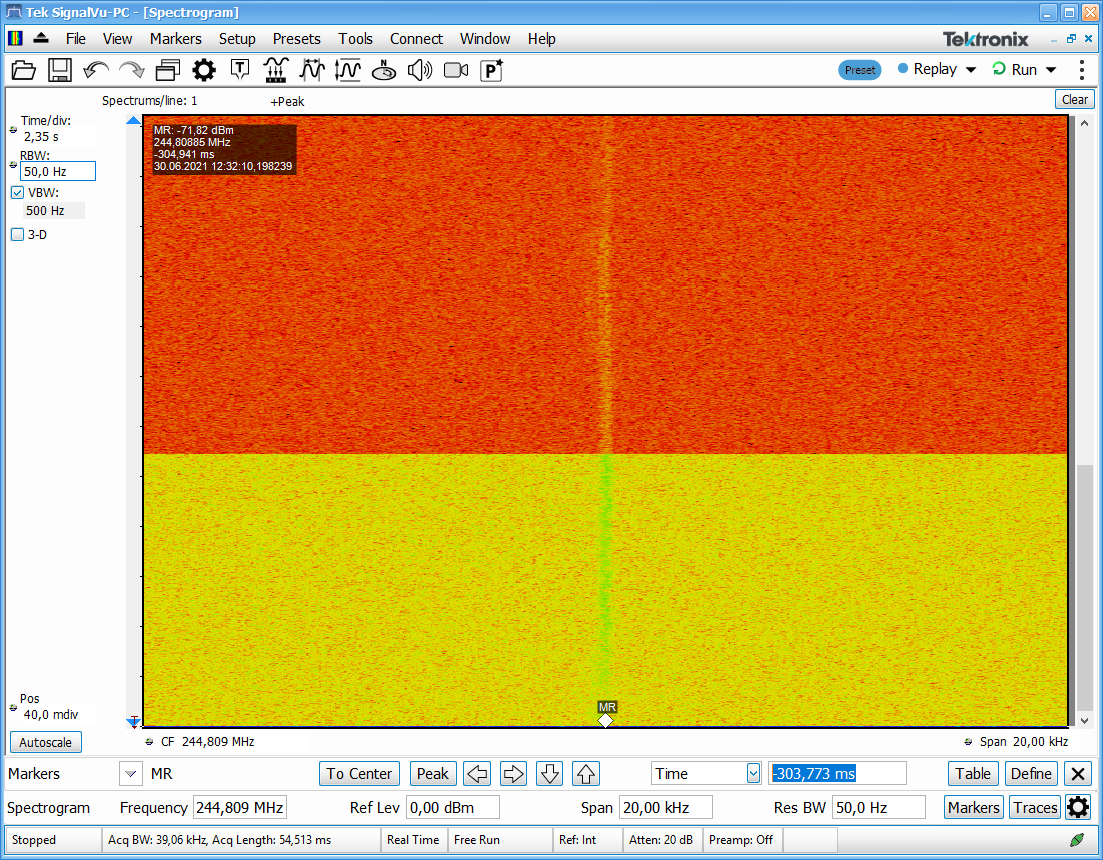
Shahab | Runs | 245 Amplifier on |
turned on extra 20dB amplifier for the 245 Resonator around 12:32 |
| Attachment 1: amplification_on245.png
|
|
|
156
|
Wed Jun 30 15:21:44 2021 |
Shahab | Runs | data synch on WWW server |
Data is being shared on the WWW server.
Time difference between the analyzers is in order of seconds:

time stamp of the 245MHz data is leading those of 410MHz by 21.733 [s] |
|
158
|
Wed Jun 30 19:59:39 2021 |
Shahab | Runs | Scraper positions |
current scraper positions suggested by Sergey:

GEEXDS2HA = -11mm
GE01DS-H (innen) = -58mm |
|
173
|
Thu Jul 1 18:07:10 2021 |
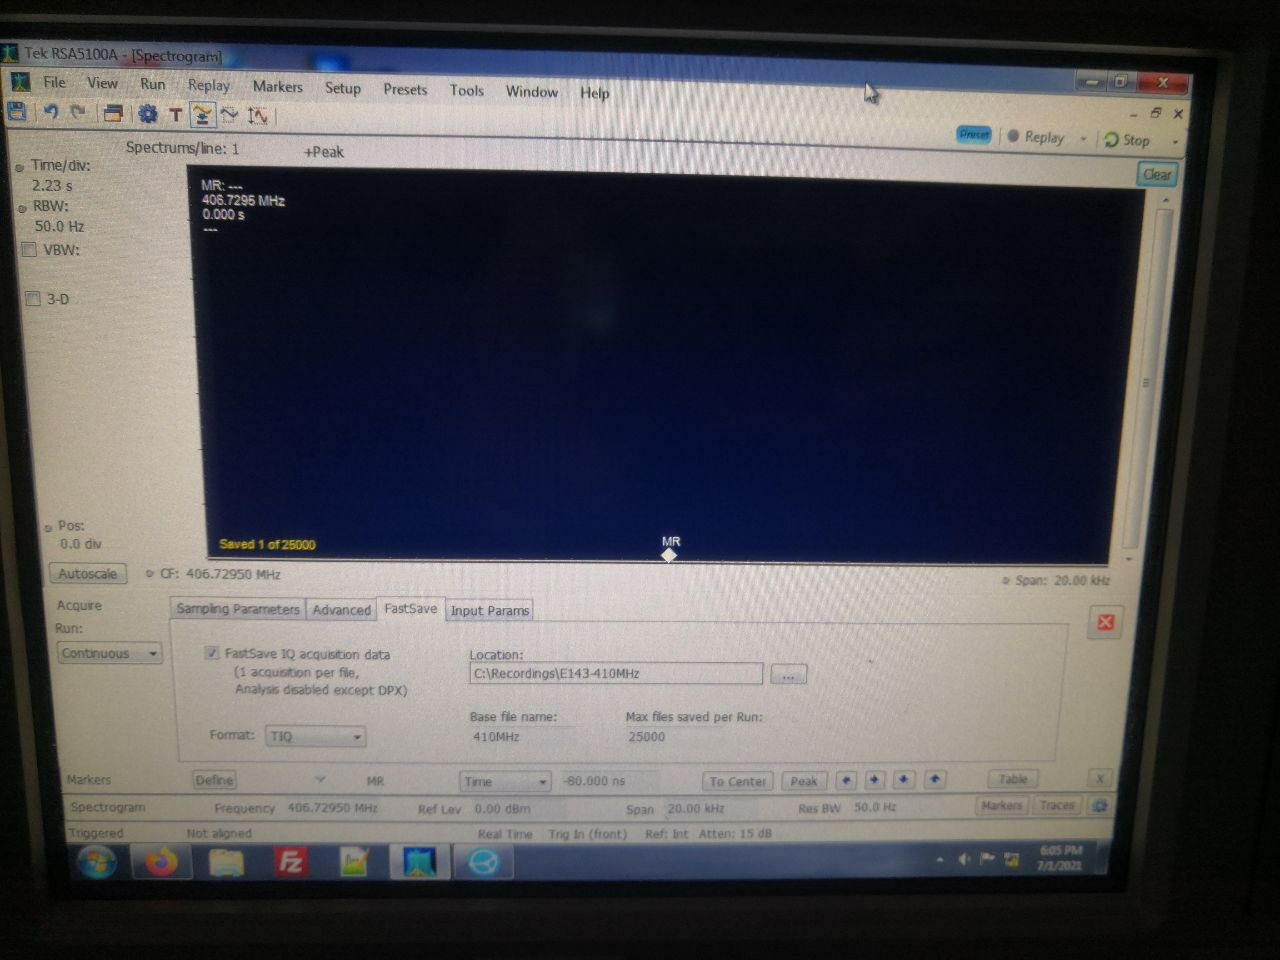
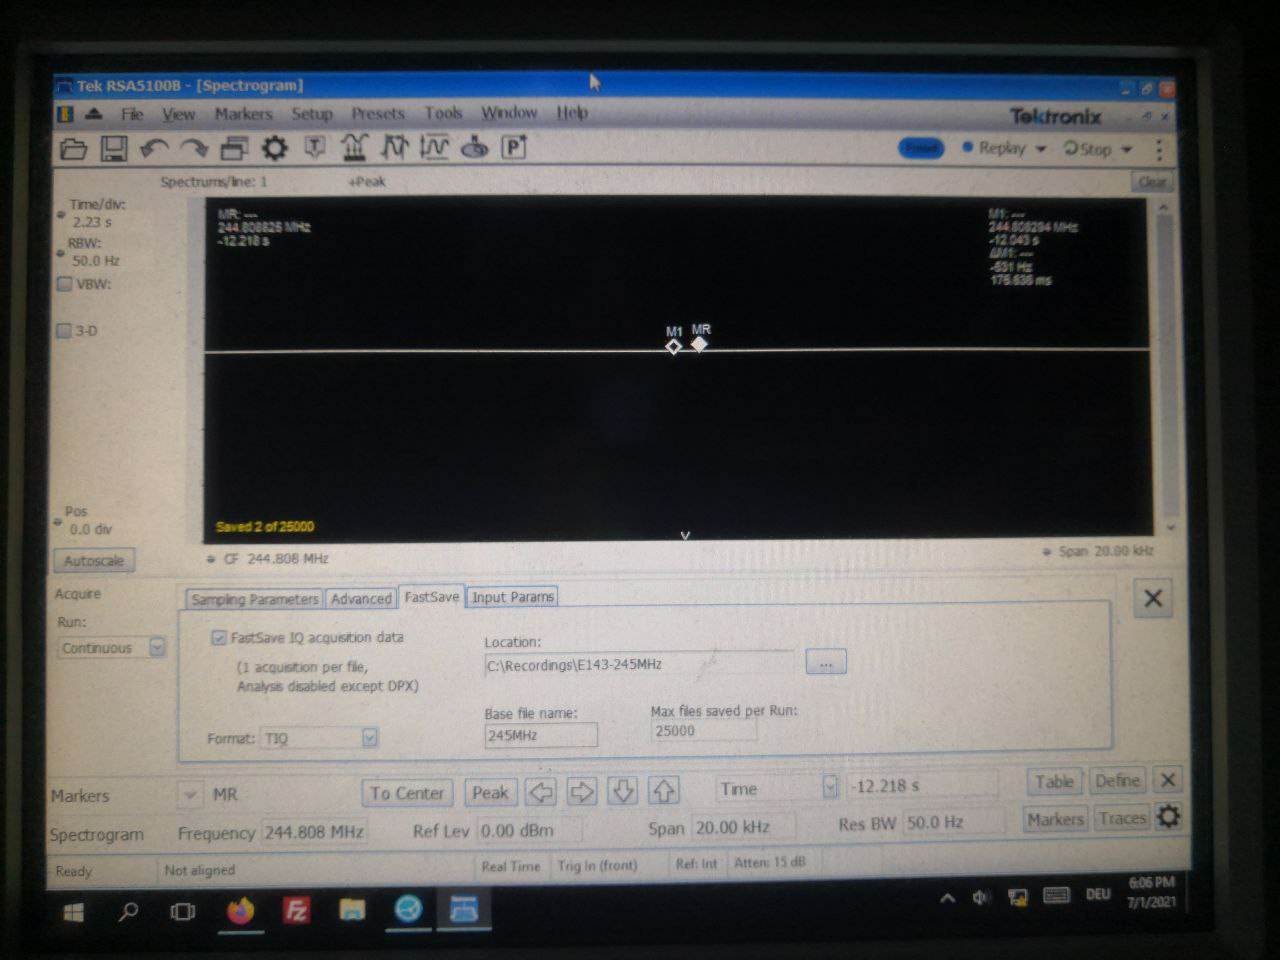
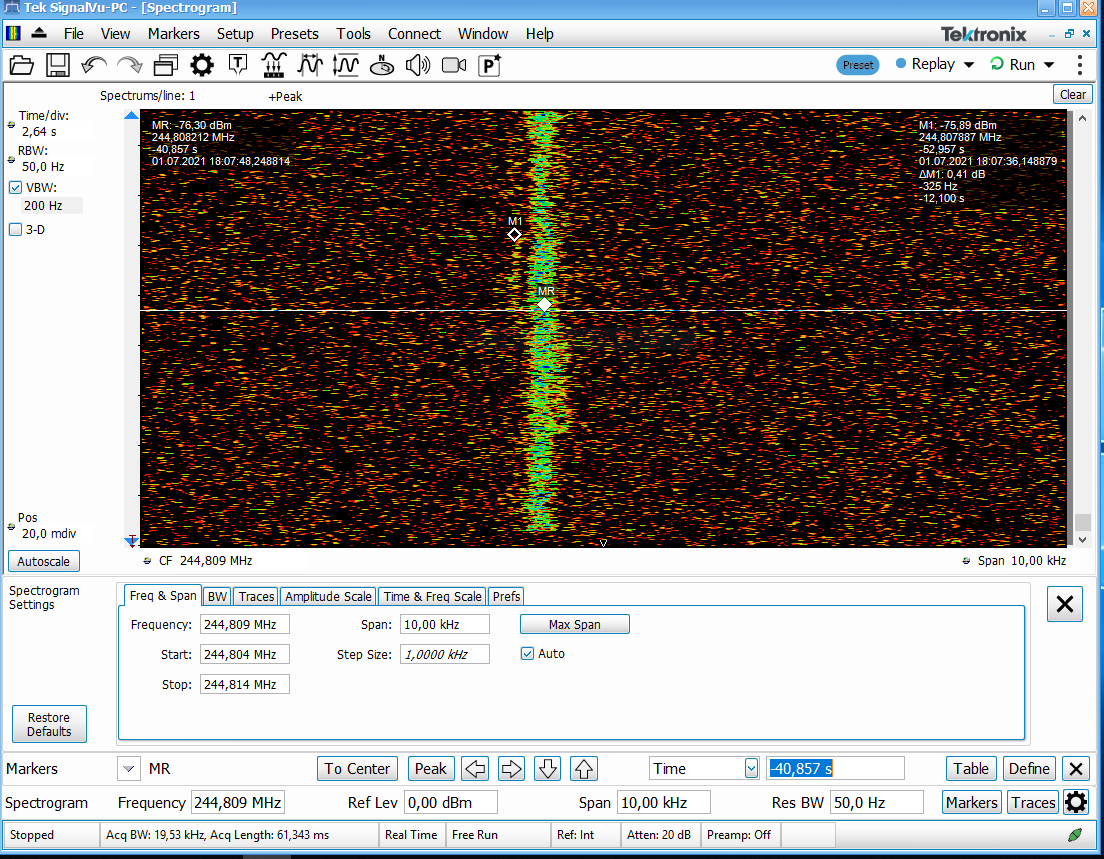
Shahab | Runs | settings of the analyzers after changing the trigger position |
|
| Attachment 1: asd.jpg
|
|
| Attachment 2: asd2.jpg
|
|
|
174
|
Thu Jul 1 18:49:59 2021 |
Shahab | Runs | possible isomer? |
|
| Attachment 1: possible_isomer.png
|
|
|
176
|
Thu Jul 1 18:56:49 2021 |
Shahab | Runs | Short interruption in recording |
DAQs and NTCAP |
|
178
|
Thu Jul 1 19:34:11 2021 |
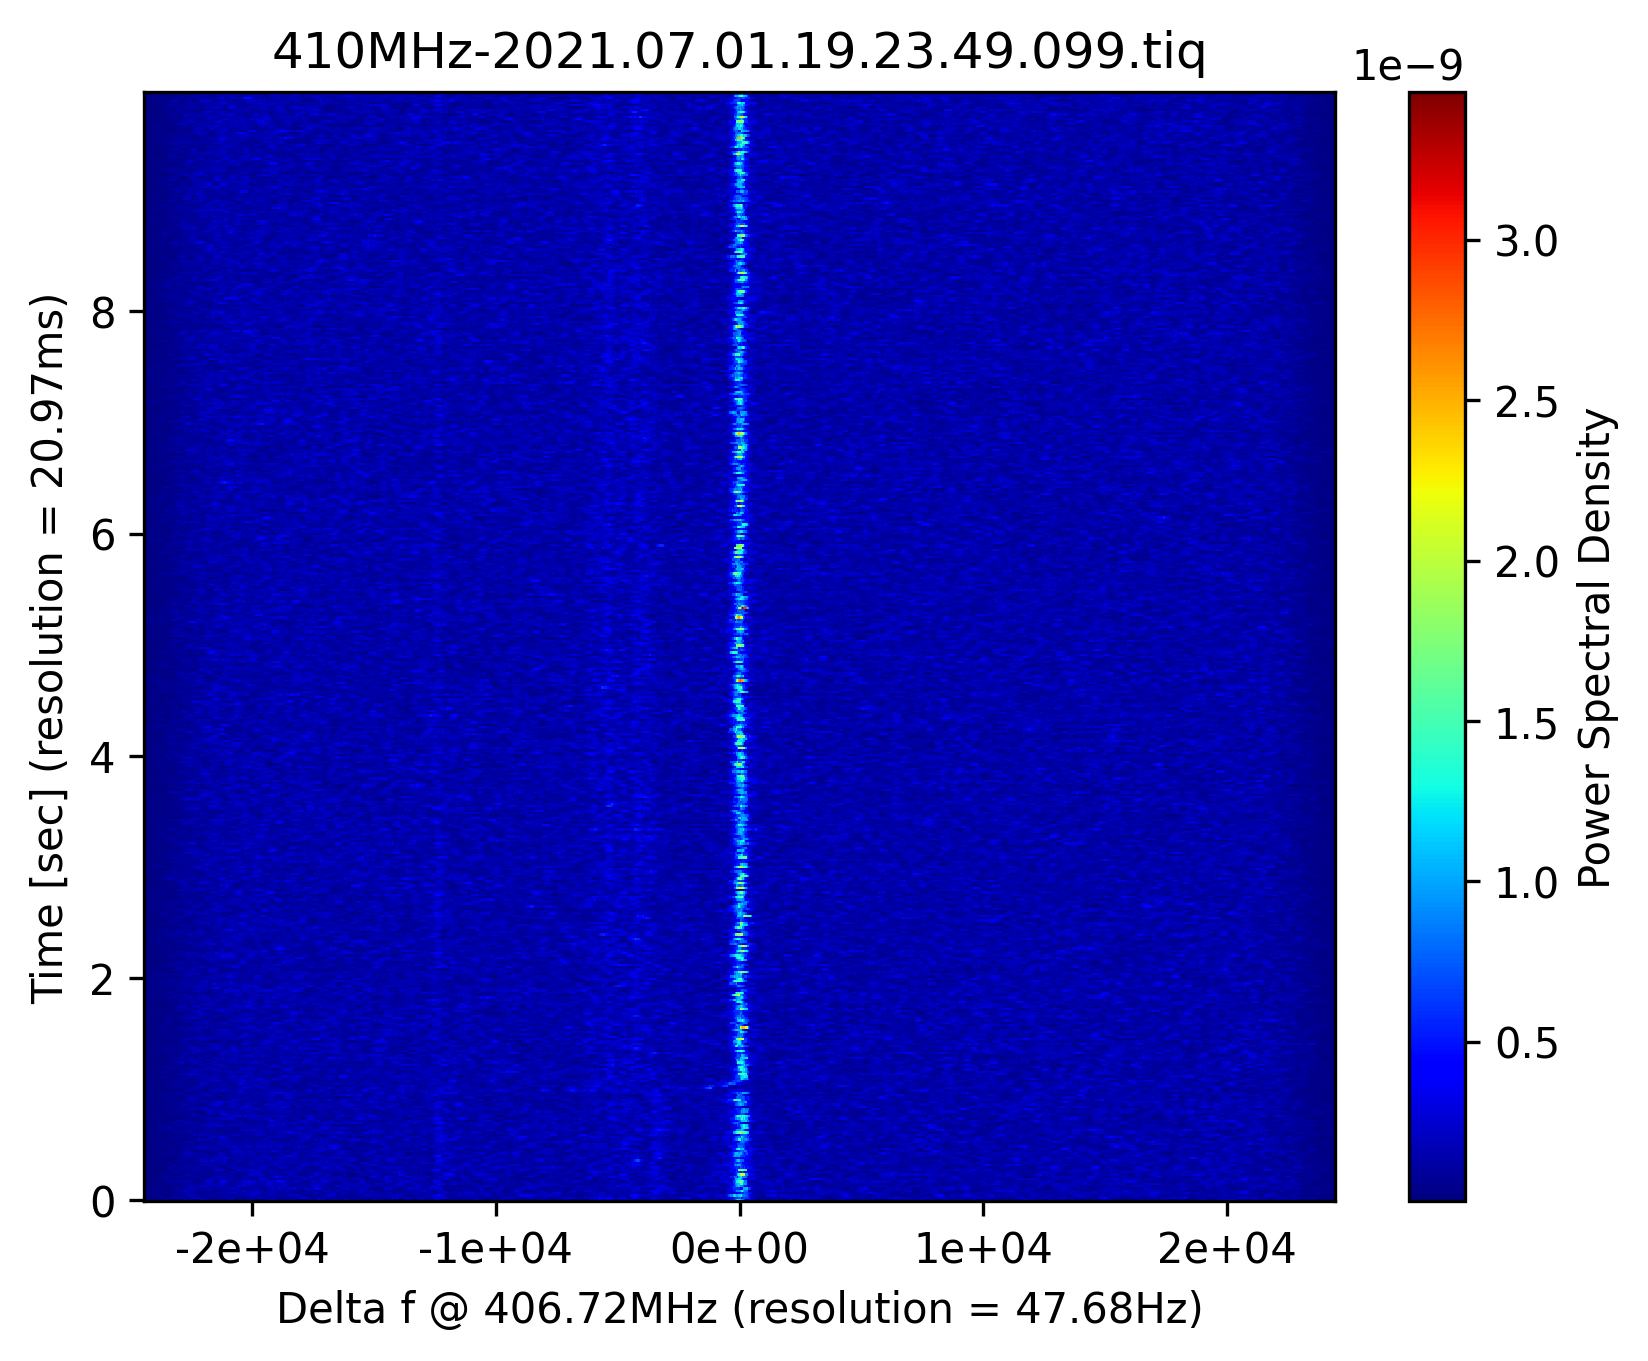
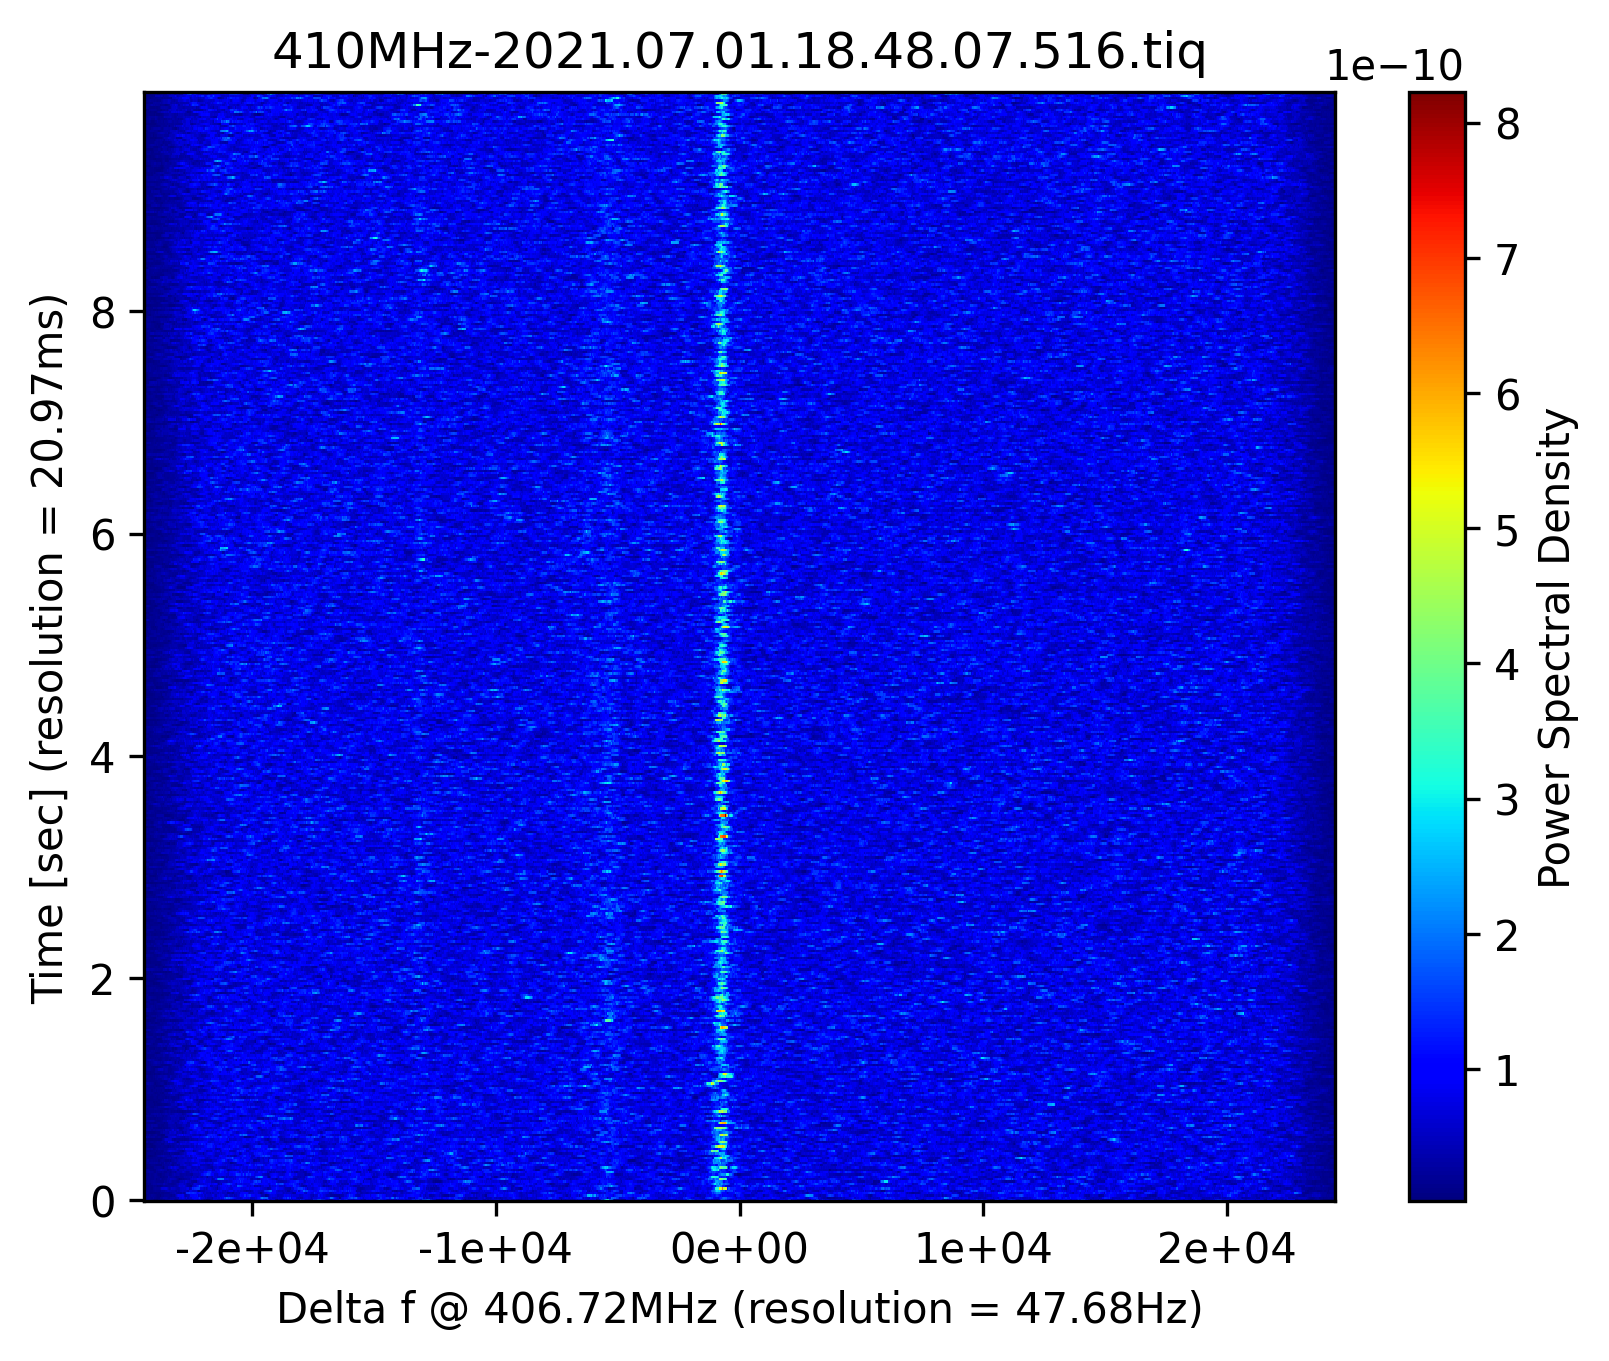
Shahab | DAQ | increase factor 4 in power for 410 |
increase factor 4 in power for 410


before:

410MHz-2021.07.01.18.48.07.516.tiq.png


after:

410MHz-2021.07.01.19.23.49.099.tiq.png |
| Attachment 1: 410MHz-2021.07.01.19.23.49.099.tiq.png
|
|
| Attachment 2: 410MHz-2021.07.01.18.48.07.516.tiq.png
|
|
|
182
|
Thu Jul 1 21:35:15 2021 |
Shahab | DAQ | increase factor 4 in power for 410 |
increase factor 4 in power for 410


before:

410MHz-2021.07.01.18.48.07.516.tiq.png


after:

410MHz-2021.07.01.19.23.49.099.tiq.png |
|
183
|
Thu Jul 1 21:35:32 2021 |
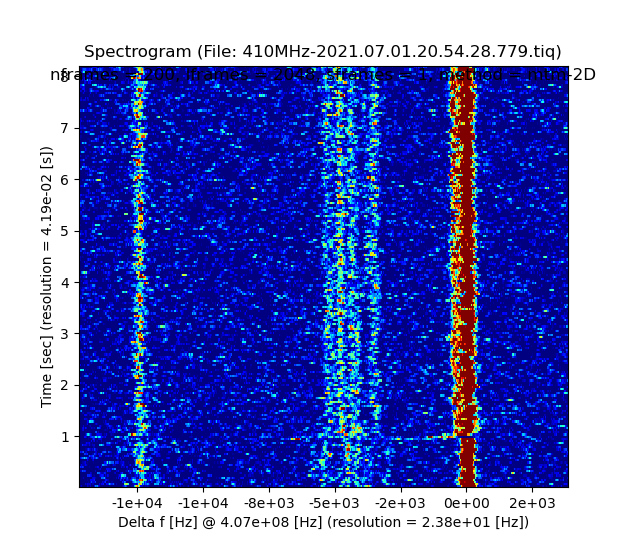
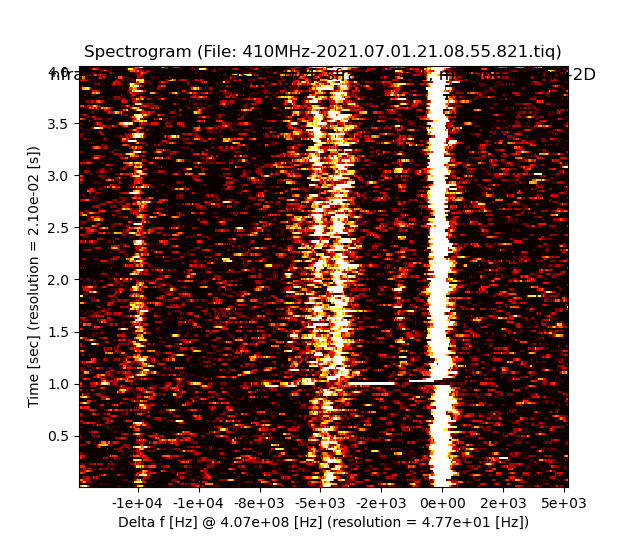
Shahab | Runs | some pics after 15dB amplification on 410 |
|
| Attachment 1: asd.png
|
|
| Attachment 2: 821.png
|
|
|
180
|
Thu Jul 1 20:48:58 2021 |
Shahab Andrew Nic | DAQ | Acquisition started |
15dB amplifier on 410MHz |
|
218
|
Fri Jul 2 19:57:12 2021 |
Shahab, Yuri, Wolfram, Liliana | Runs | stop DAQ |
At 19:56 the DAQ is stopped.
The plan is to go back to the setting for Se.
Last files for the Br setting:
- 410MHz-2021.07.02.19.57.36.721.tiq
-245MHz-2021.07.02.19.58.03.216.tiq |
|
196
|
Fri Jul 2 04:27:38 2021 |
The remote Canadian beavers (Iris and Guy) | Analysis | Summary of spectra 0:00-4:00 (410 MHz) |
Same as before for 0-4h on July 2nd.

> Same as before, for 0-1h on July 2nd
>
>
> > The last hour before the gas bottle change is summarized here.
> > The first pic shows the 410 MHz spectra taken from 22-23h on the 410 MHz analyzer, in time slices of 0.1 sec from 0s-2s.
> > The second pic shows the spectra in 20ms slices from 1s-1.16s.
> >
> > python3 e143_analyzer.py -s 1.0 -t 0.02 /home/dillmann/.../sparc-daq-02.gsi.de/E143-410MHz/410MHz-2021.07.01.22*
> >
> > The third spectra was taken in May, for comparison.
> >
> > I don't think we see anything... |
| Attachment 1: July2-0-4h-410MHz_Spectra_0.02s_steps_start_1s.png
|

|
|
199
|
Fri Jul 2 06:33:48 2021 |
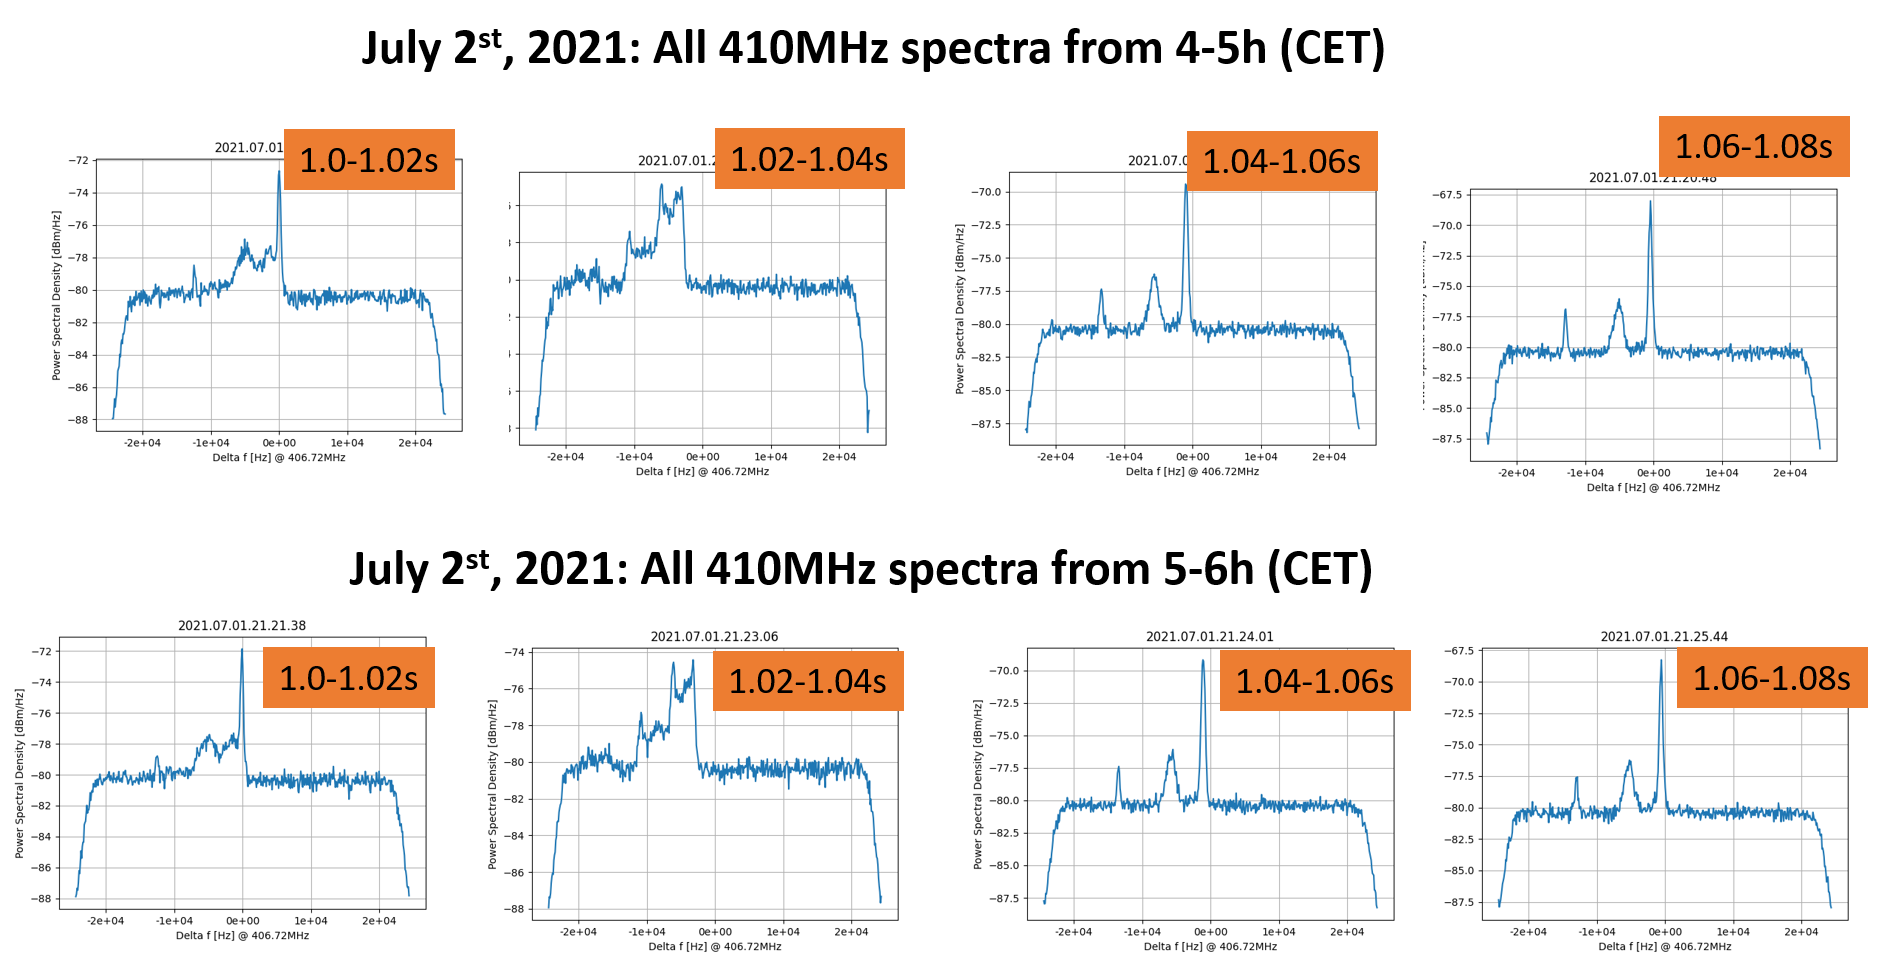
The remote Canadian beavers (Iris and Guy) | Analysis | Summary of spectra 4:00-6:00 (410 MHz) |
Same as before for 4-5h and 5-6h.
No isomer, I think :-( (Sorry, Wolfram!)

> Same as before for 0-4h on July 2nd.
>
> > Same as before, for 0-1h on July 2nd
> >
> >
> > > The last hour before the gas bottle change is summarized here.
> > > The first pic shows the 410 MHz spectra taken from 22-23h on the 410 MHz analyzer, in time slices of 0.1 sec from 0s-2s.
> > > The second pic shows the spectra in 20ms slices from 1s-1.16s.
> > >
> > > python3 e143_analyzer.py -s 1.0 -t 0.02 /home/dillmann/.../sparc-daq-02.gsi.de/E143-410MHz/410MHz-2021.07.01.22*
> > >
> > > The third spectra was taken in May, for comparison.
> > >
> > > I don't think we see anything... |
| Attachment 1: July2-4-6h-410MHz_Spectra_0.02s_steps_start_1s.png
|
|
|
189
|
Fri Jul 2 01:31:35 2021 |
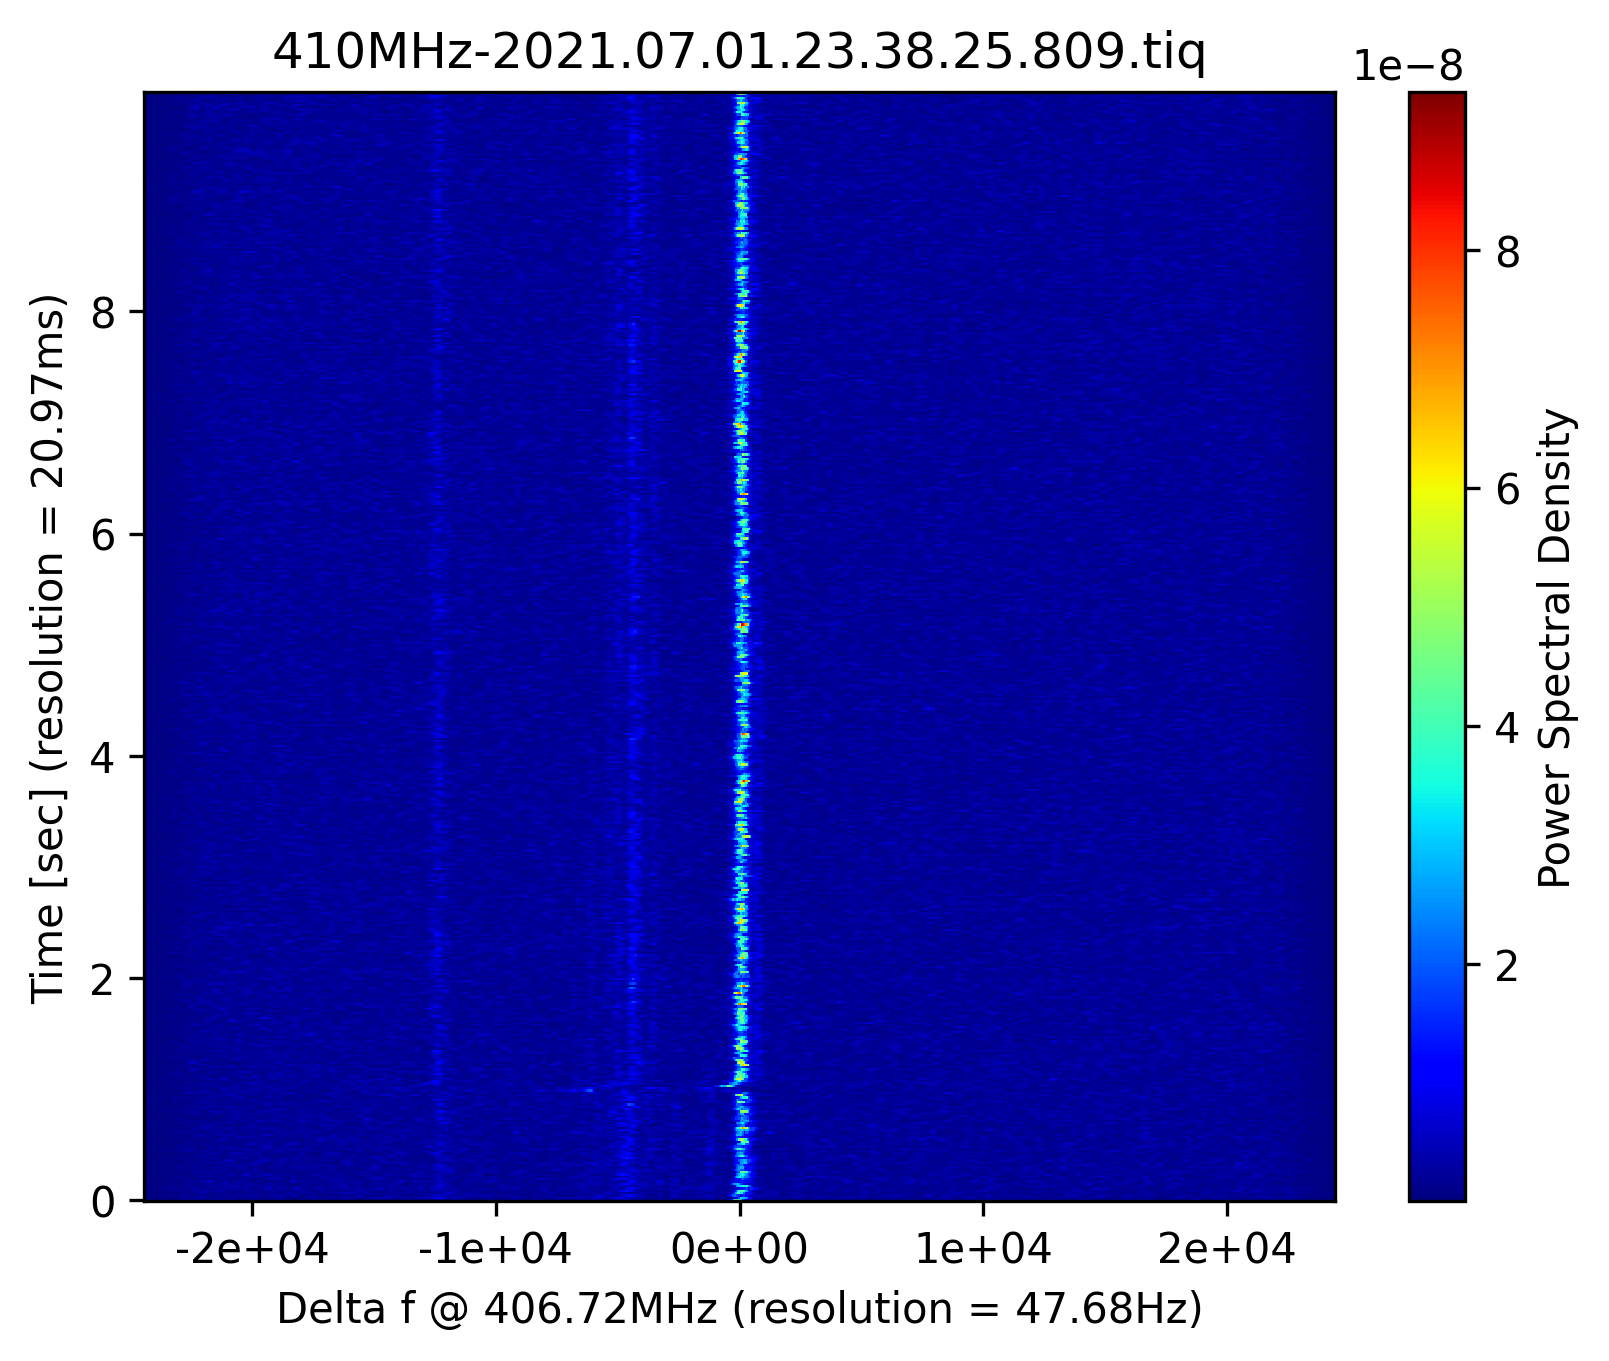
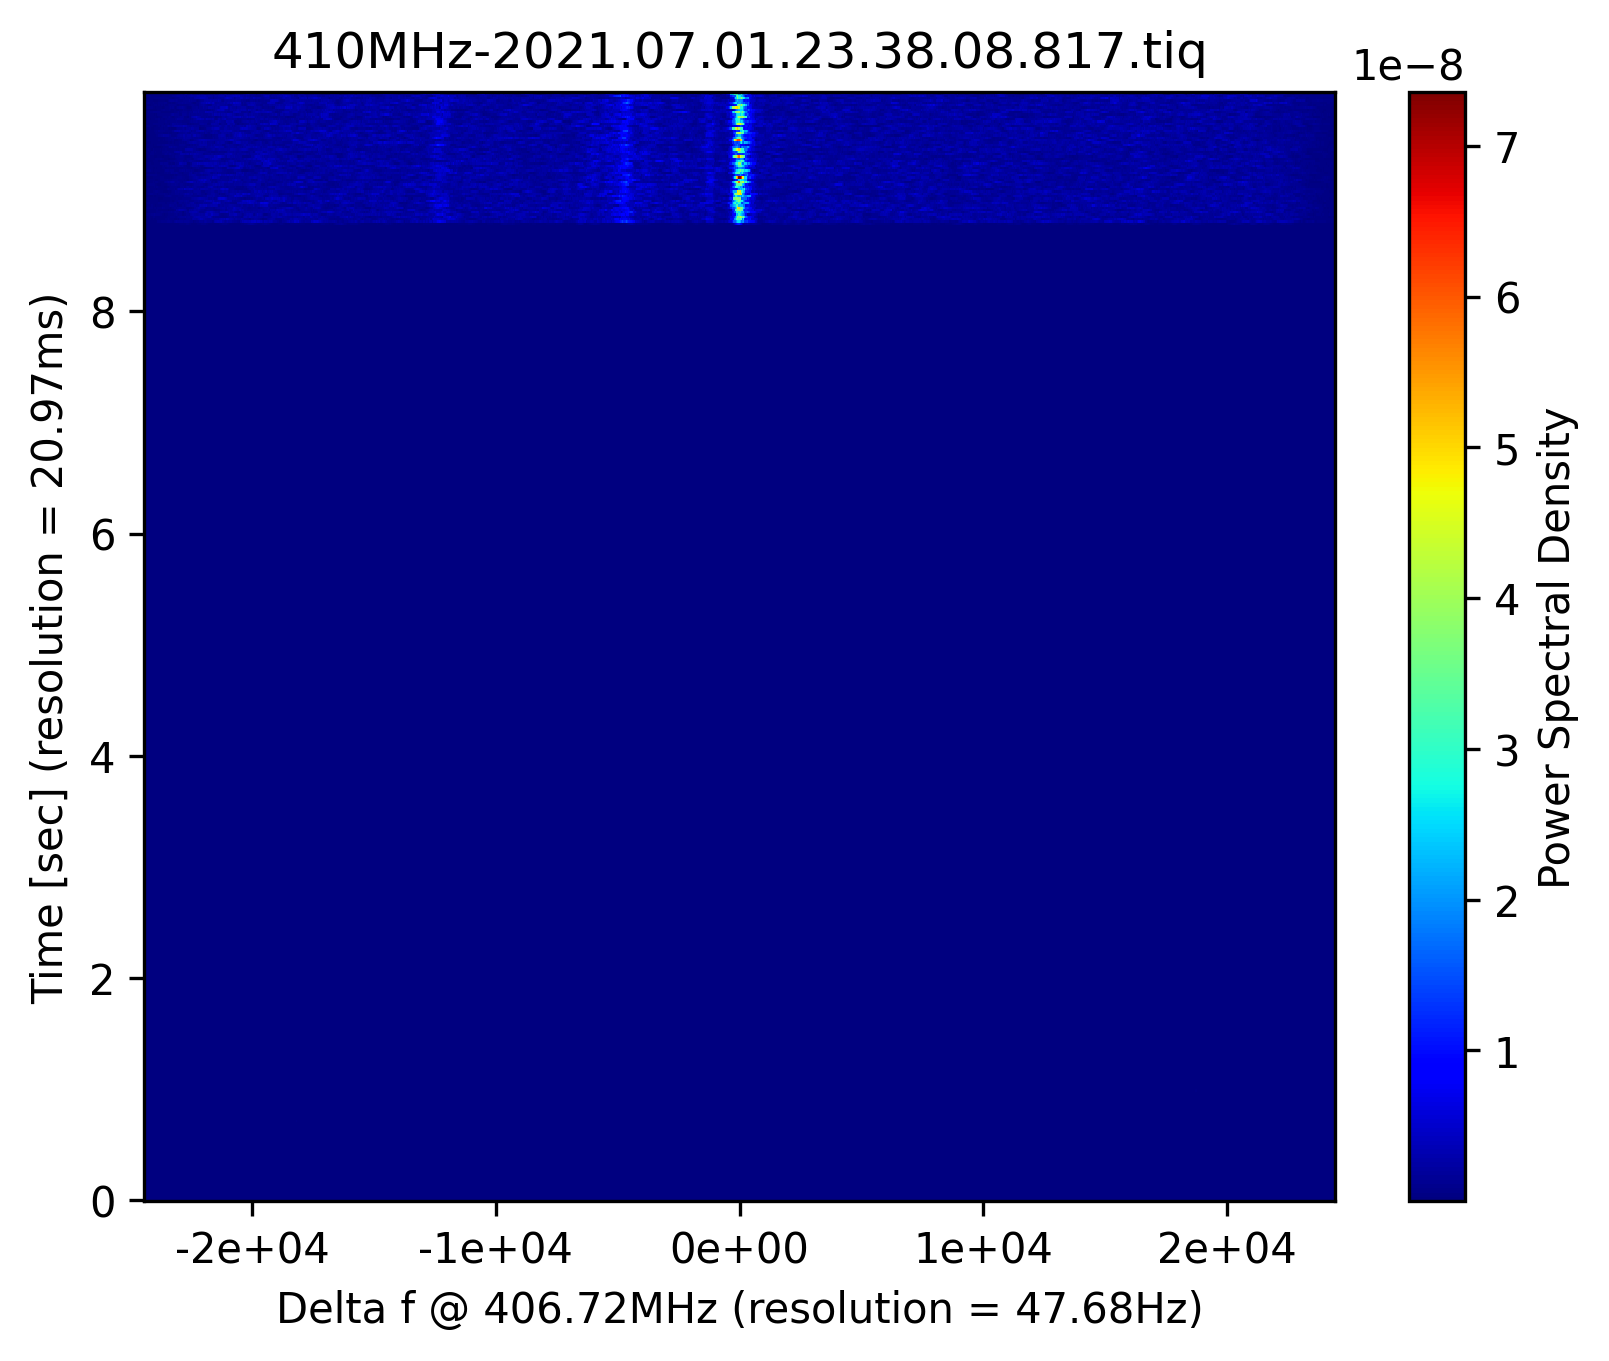
The remote Canadian beavers (Iris, Guy) | Analysis | First spectra after bottle change |
The first good spectra after the gas bottle change is from 23:38:25 (on the 410 MHz Analyzer) |
| Attachment 1: 410MHz-2021.07.01.23.38.25.809.tiq.png
|
|
| Attachment 2: 410MHz-2021.07.01.23.38.08.817.tiq.png
|
|
|
190
|
Fri Jul 2 01:34:03 2021 |
The remote Canadian beavers (Iris, Guy) | Analysis | Summary of spectra 22:00-23:00 |
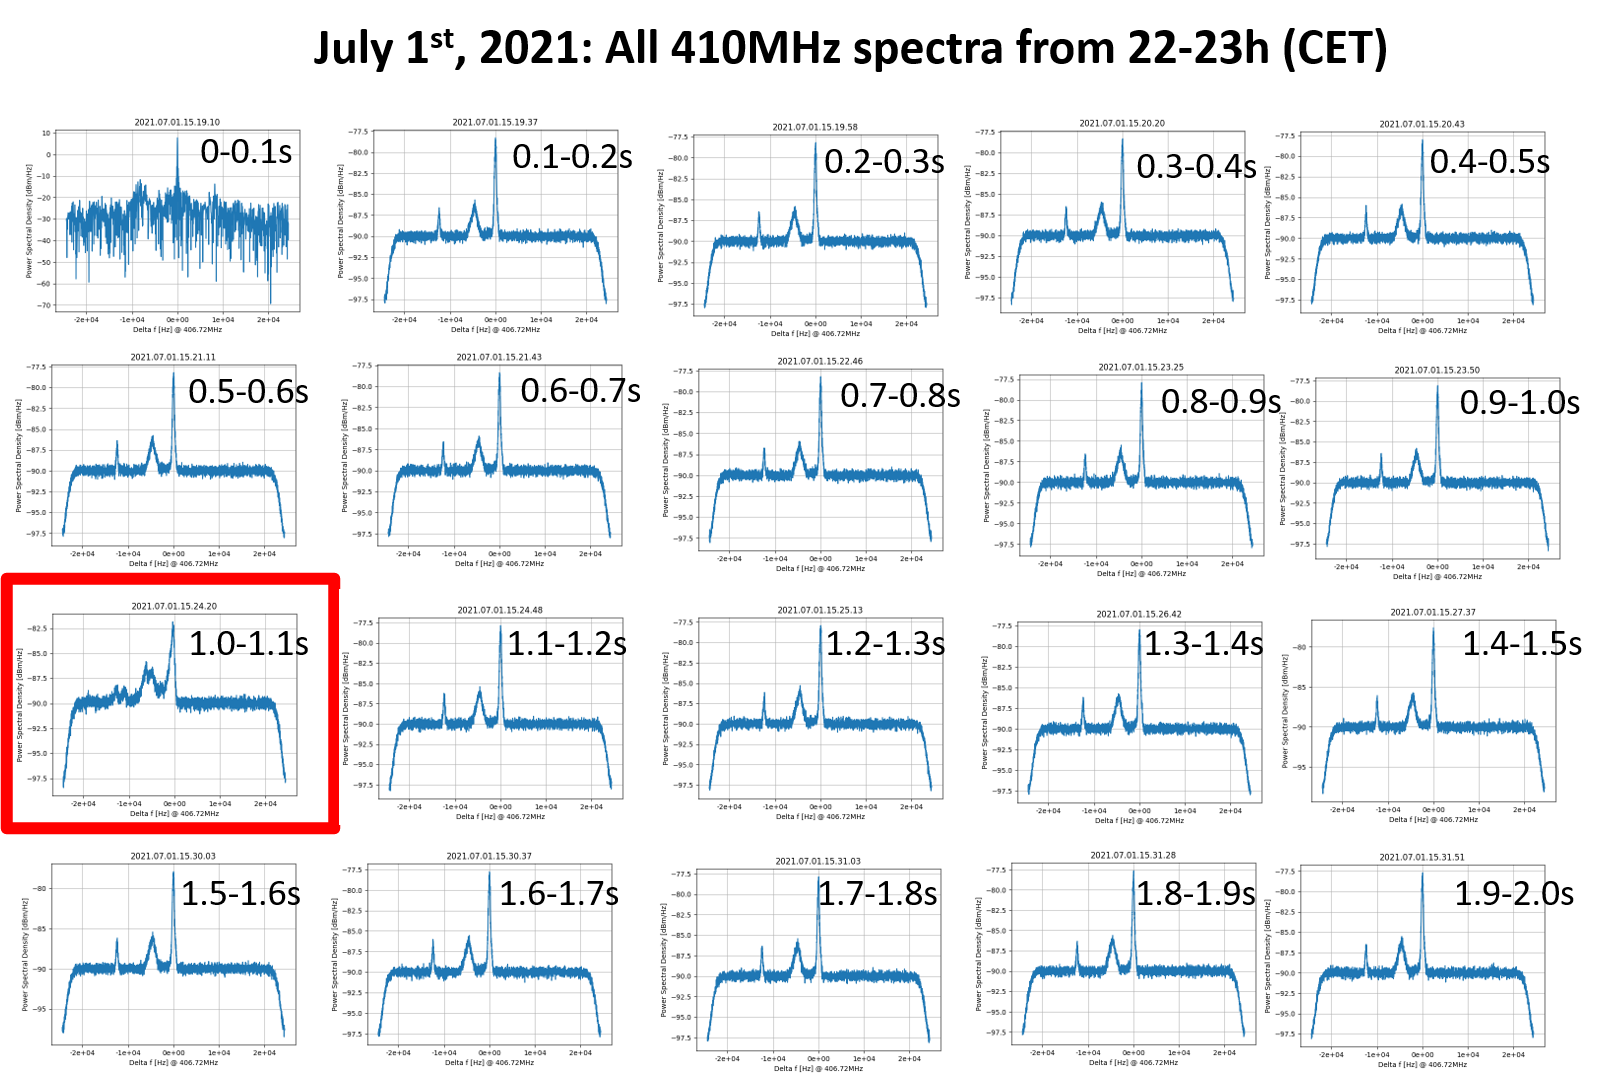
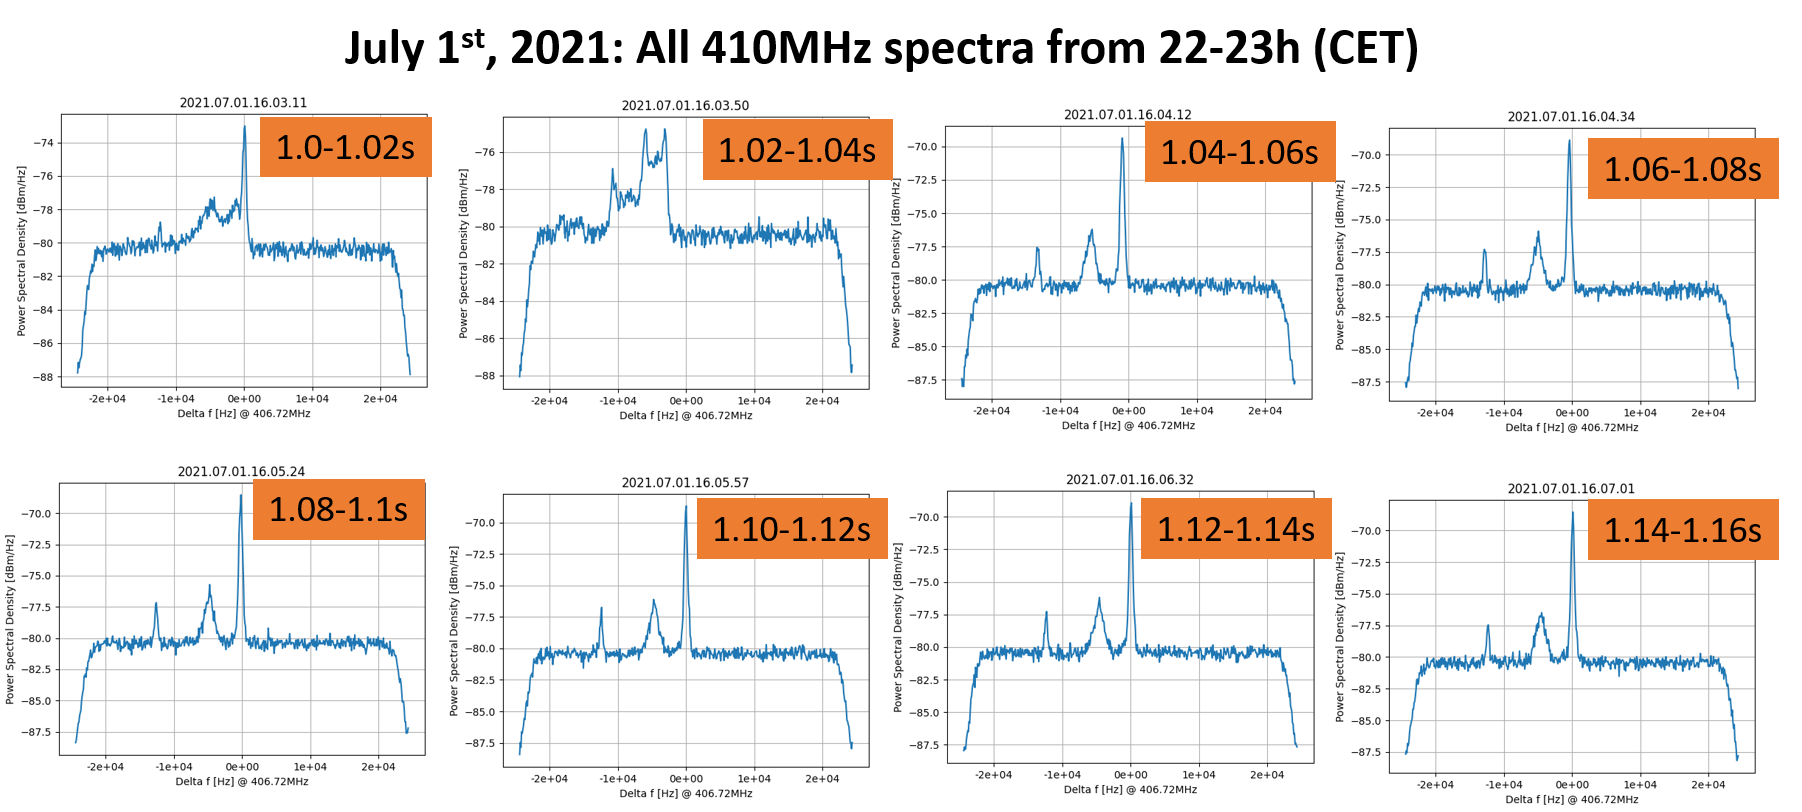
The last hour before the gas bottle change is summarized here.
The first pic shows the 410 MHz spectra taken from 22-23h on the 410 MHz analyzer, in time slices of 0.1 sec from 0s-2s.
The second pic shows the spectra in 20ms slices from 1s-1.16s.

python3 e143_analyzer.py -s 1.0 -t 0.02 /home/dillmann/.../sparc-daq-02.gsi.de/E143-410MHz/410MHz-2021.07.01.22*

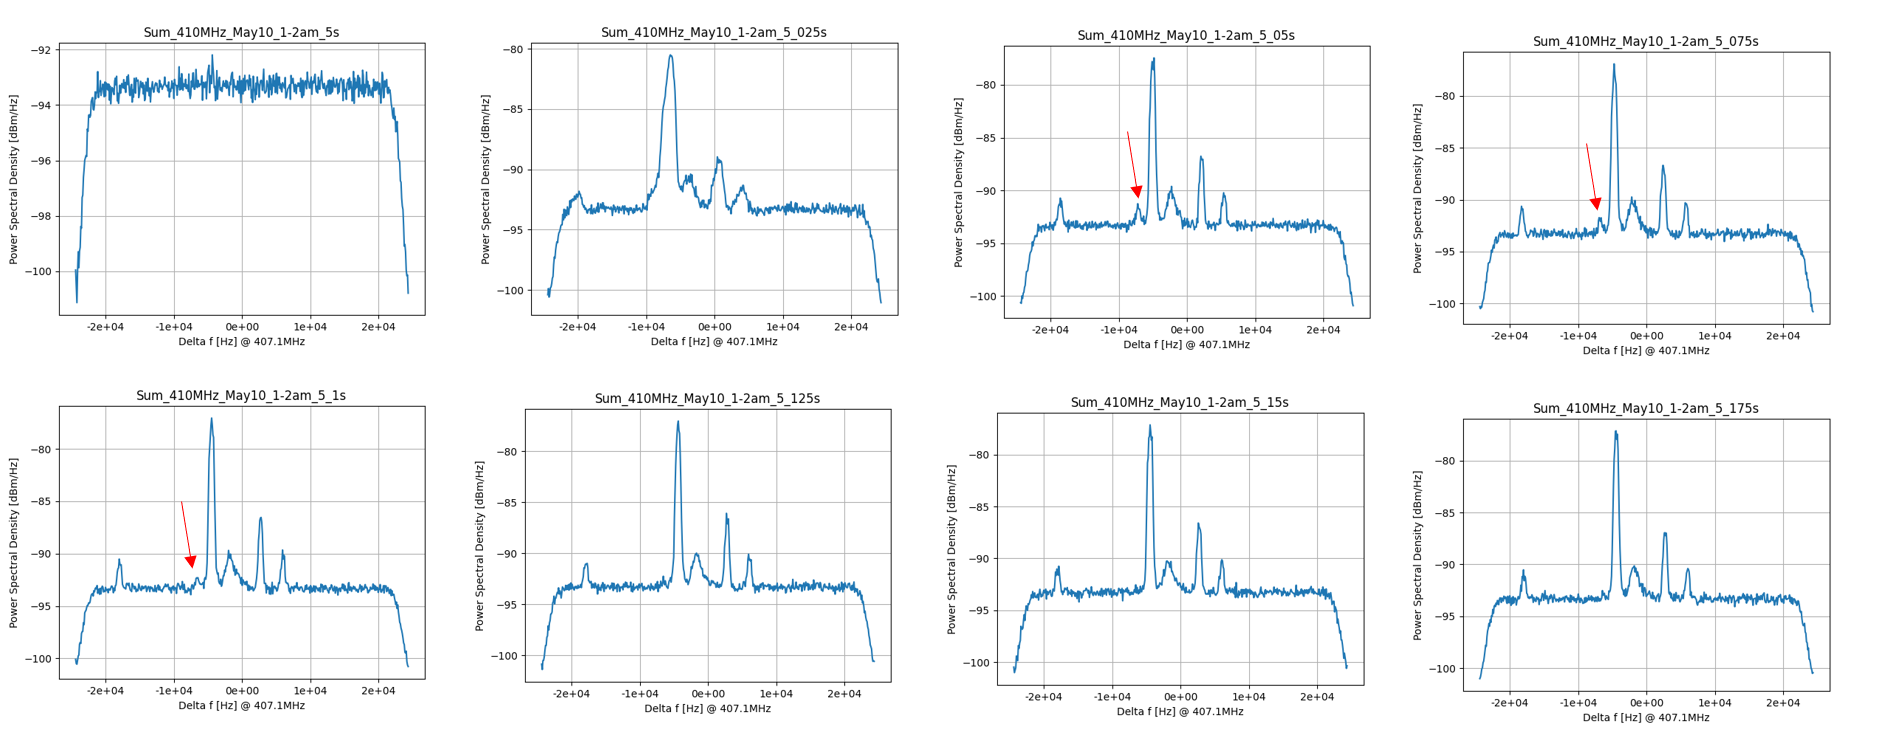
The third spectra was taken in May, for comparison.

I don't think we see anything... |
| Attachment 1: July1-22-23h-410MHz_Spectra_0.1s_steps.png
|
|
| Attachment 2: July1-22-23h-410MHz_Spectra_0.02s_steps_start_1s.png
|
|
| Attachment 3: Sum_410MHz_May10-1-2am_5_0-5_175s.png
|
|
|
193
|
Fri Jul 2 02:03:36 2021 |
The remote Canadian beavers (Iris, Guy) | Analysis | Summary of spectra 0:00-1:00 |
Same as before, for 0-1h on July 2nd


> The last hour before the gas bottle change is summarized here.
> The first pic shows the 410 MHz spectra taken from 22-23h on the 410 MHz analyzer, in time slices of 0.1 sec from 0s-2s.
> The second pic shows the spectra in 20ms slices from 1s-1.16s.
>
> python3 e143_analyzer.py -s 1.0 -t 0.02 /home/dillmann/.../sparc-daq-02.gsi.de/E143-410MHz/410MHz-2021.07.01.22*
>
> The third spectra was taken in May, for comparison.
>
> I don't think we see anything... |
| Attachment 1: July2-0-1h-410MHz_Spectra_0.02s_steps_start_1s.png
|

|