ID |
Date |
Author |
Category |
Subject |
|
214
|
Fri Jul 2 16:14:17 2021 |
Yuri | Accelerator | Scrapers 4 72Br |
Starting 15:15
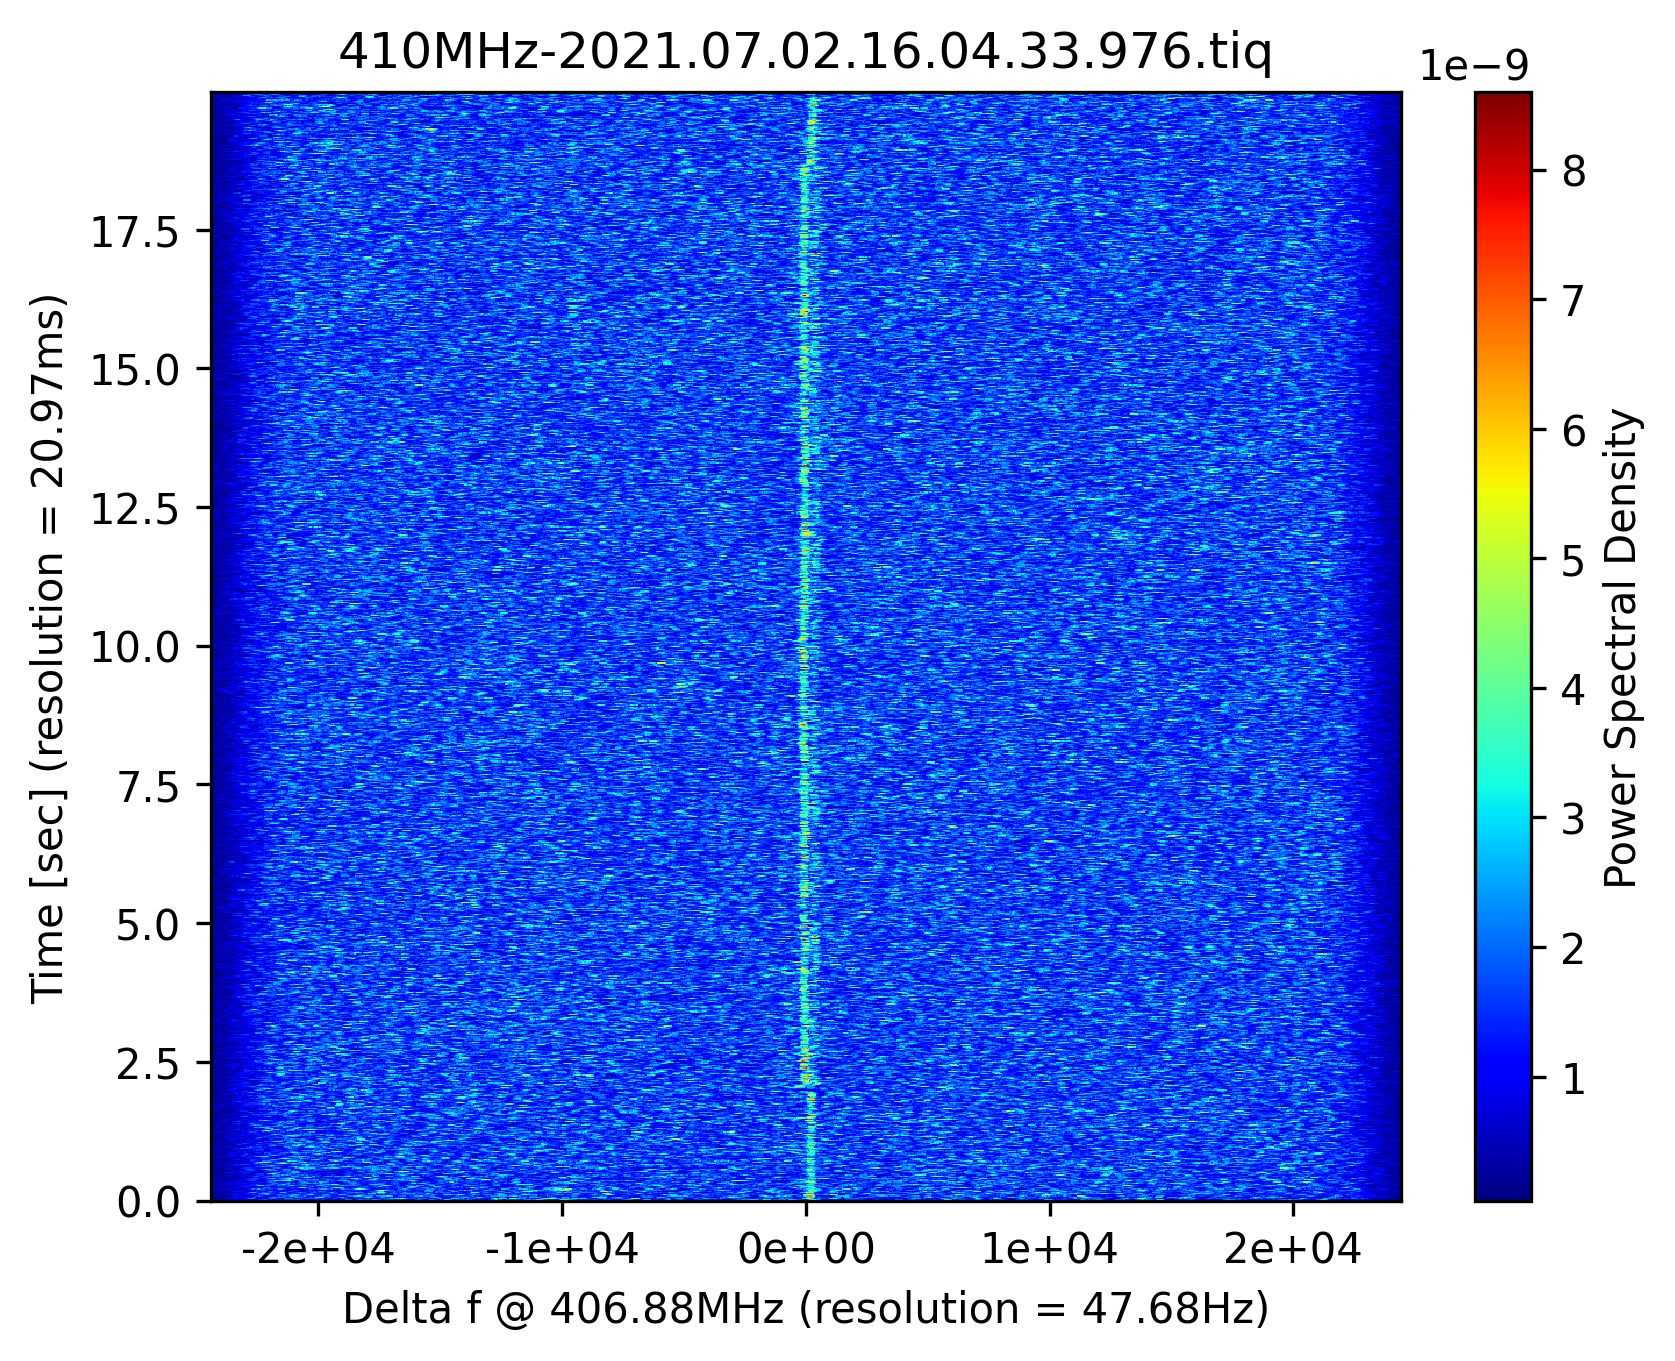
The scrapers are moved very much close to each other to eliminate all background particles and leaving basically single ions injected for 72Br. Do not wonder, this means that also many empty files are created.
Scrapers:
E02DS3HG -> -40 mm
EEXDS1HG -> +5 mm
EEXDS2HA -> 0.0 mm

One sees probably a decay of 100 keV isomer, see the attached figure at about 18 s
We will run a few hours with this setting |
| Attachment 1: 1C28A49A-5FA1-4A81-8675-3ED9660FD793.png
|
|
|
213
|
Fri Jul 2 15:03:37 2021 |
Pavlos, Alexandre | DAQ | NTCAP status |
The latest recorded tdms files:
 p:\E143\sc\SC_2021-06-30_23-27-45\0000543
 p:\E143\iq\IQ_2021-06-30_23-27-34\0002655
2. The rest space on the drive "p:\" : 24,5TByte |
|
212
|
Fri Jul 2 14:18:04 2021 |
Pavlos, Alexandre | Runs | Change of the measurment to 72Br |
Both resonators will now be retuned to look for the isomeric state in 72Br.

Last files for 70Se are:
245MHz-2021.07.02.14.17.14.507.tiq
410MHz-2021.07.02.14.16.48.528.tiq |
|
211
|
Fri Jul 2 13:44:50 2021 |
Sergey, et al | Accelerator | El cooler |
Up to now, attempts to cool the fat line between Se and Ar were conducted. We give up it now and remove cooling |
|
210
|
Fri Jul 2 13:37:00 2021 |
Pavlos, Alexandre | DAQ | Change of the measurement time from 10s to 20s |
Last files with the measurement time of 10s for the two resonators are:

245MHz-2021.07.02.13.36.00.674.tiq
410MHz-2021.07.02.13.35.34.758.tiq |
|
209
|
Fri Jul 2 13:10:00 2021 |
Yuri | Accelerator | Scrapers |
12:46 moved the TOF detector scraper back to -11 mm |
|
208
|
Fri Jul 2 12:59:21 2021 |
Pavlos, Alexandre | DAQ | NTCAP status |
The latest recorded tdms files:
 p:\E143\sc\SC_2021-06-30_23-27-45\0000515
 p:\E143\iq\IQ_2021-06-30_23-27-34\0002516
2. The rest space on the drive "p:\" : 25,0TByte |
|
207
|
Fri Jul 2 12:42:54 2021 |
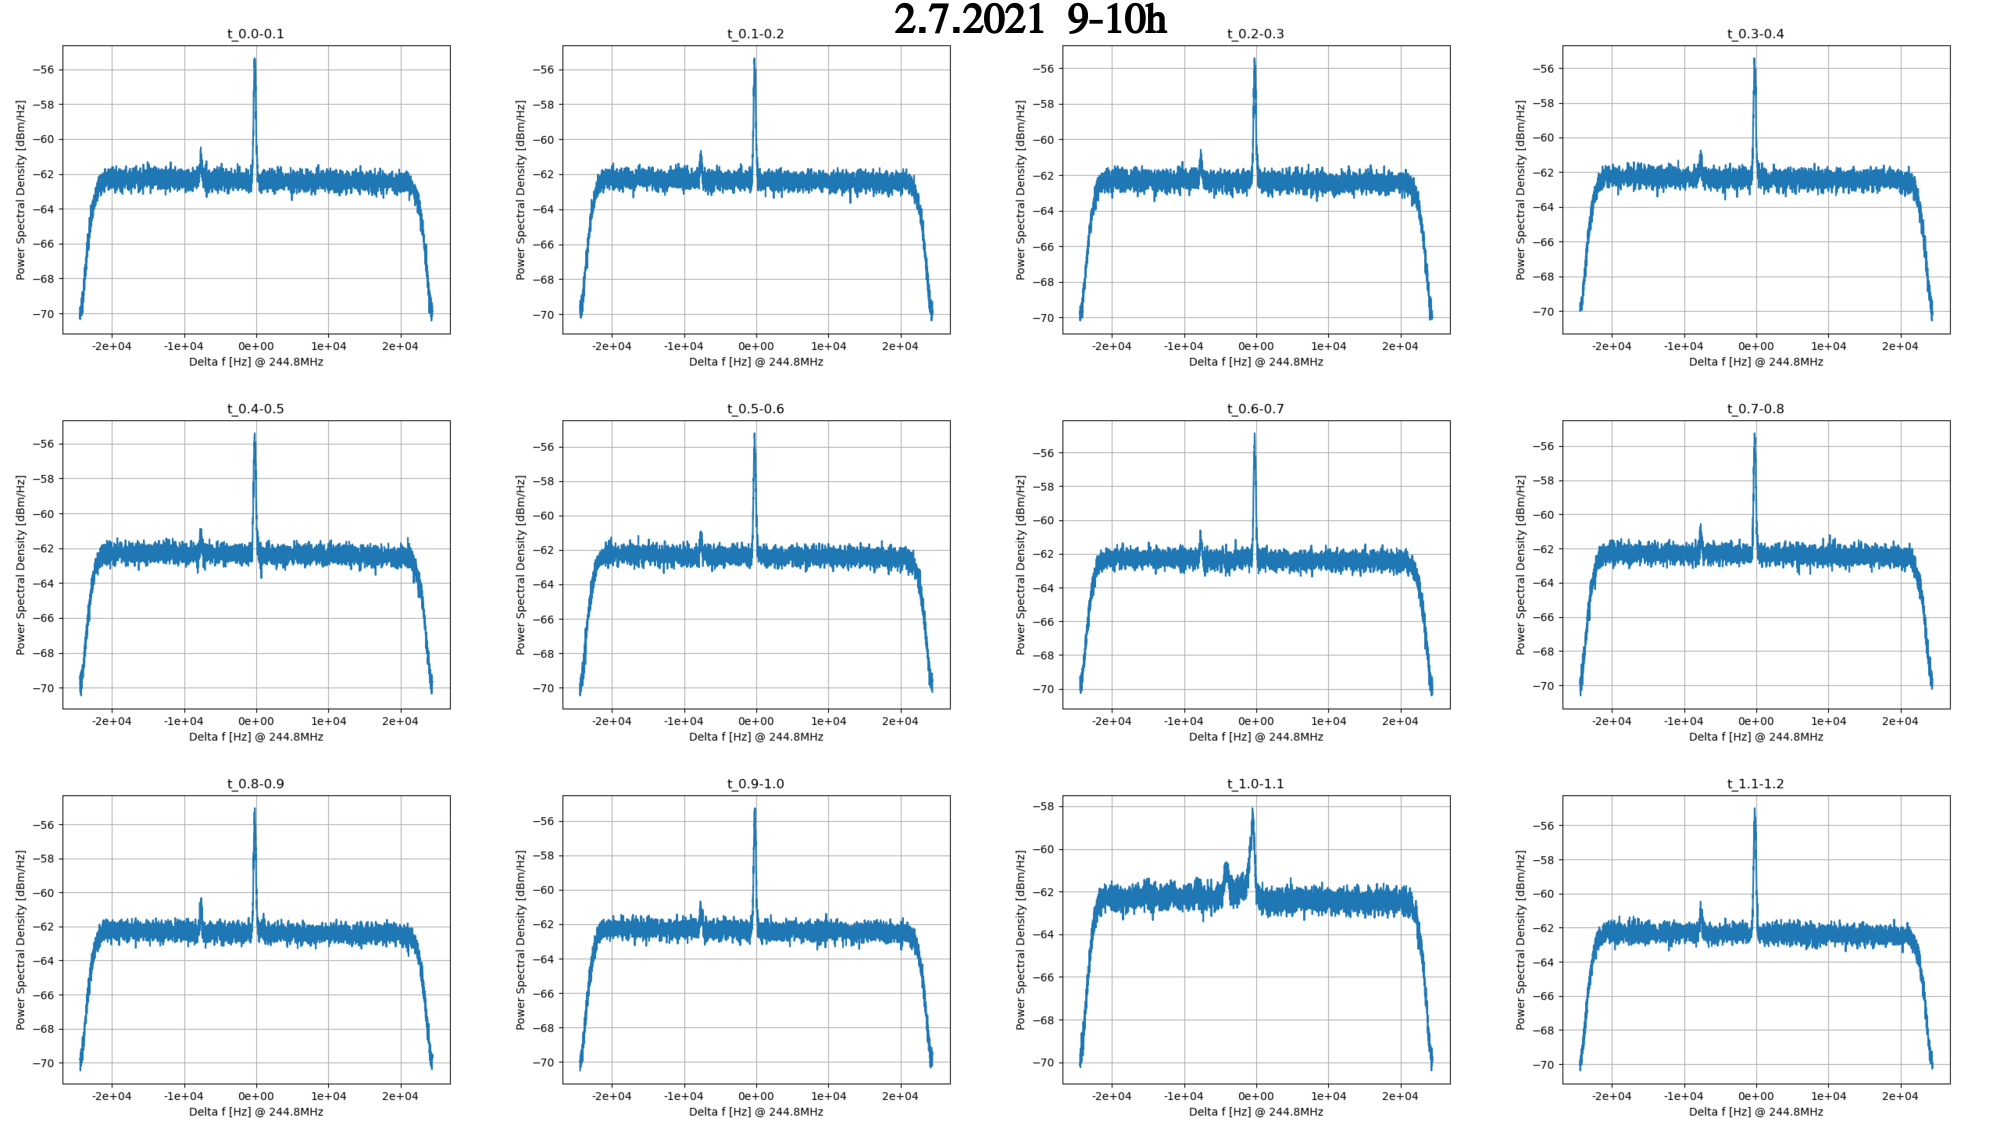
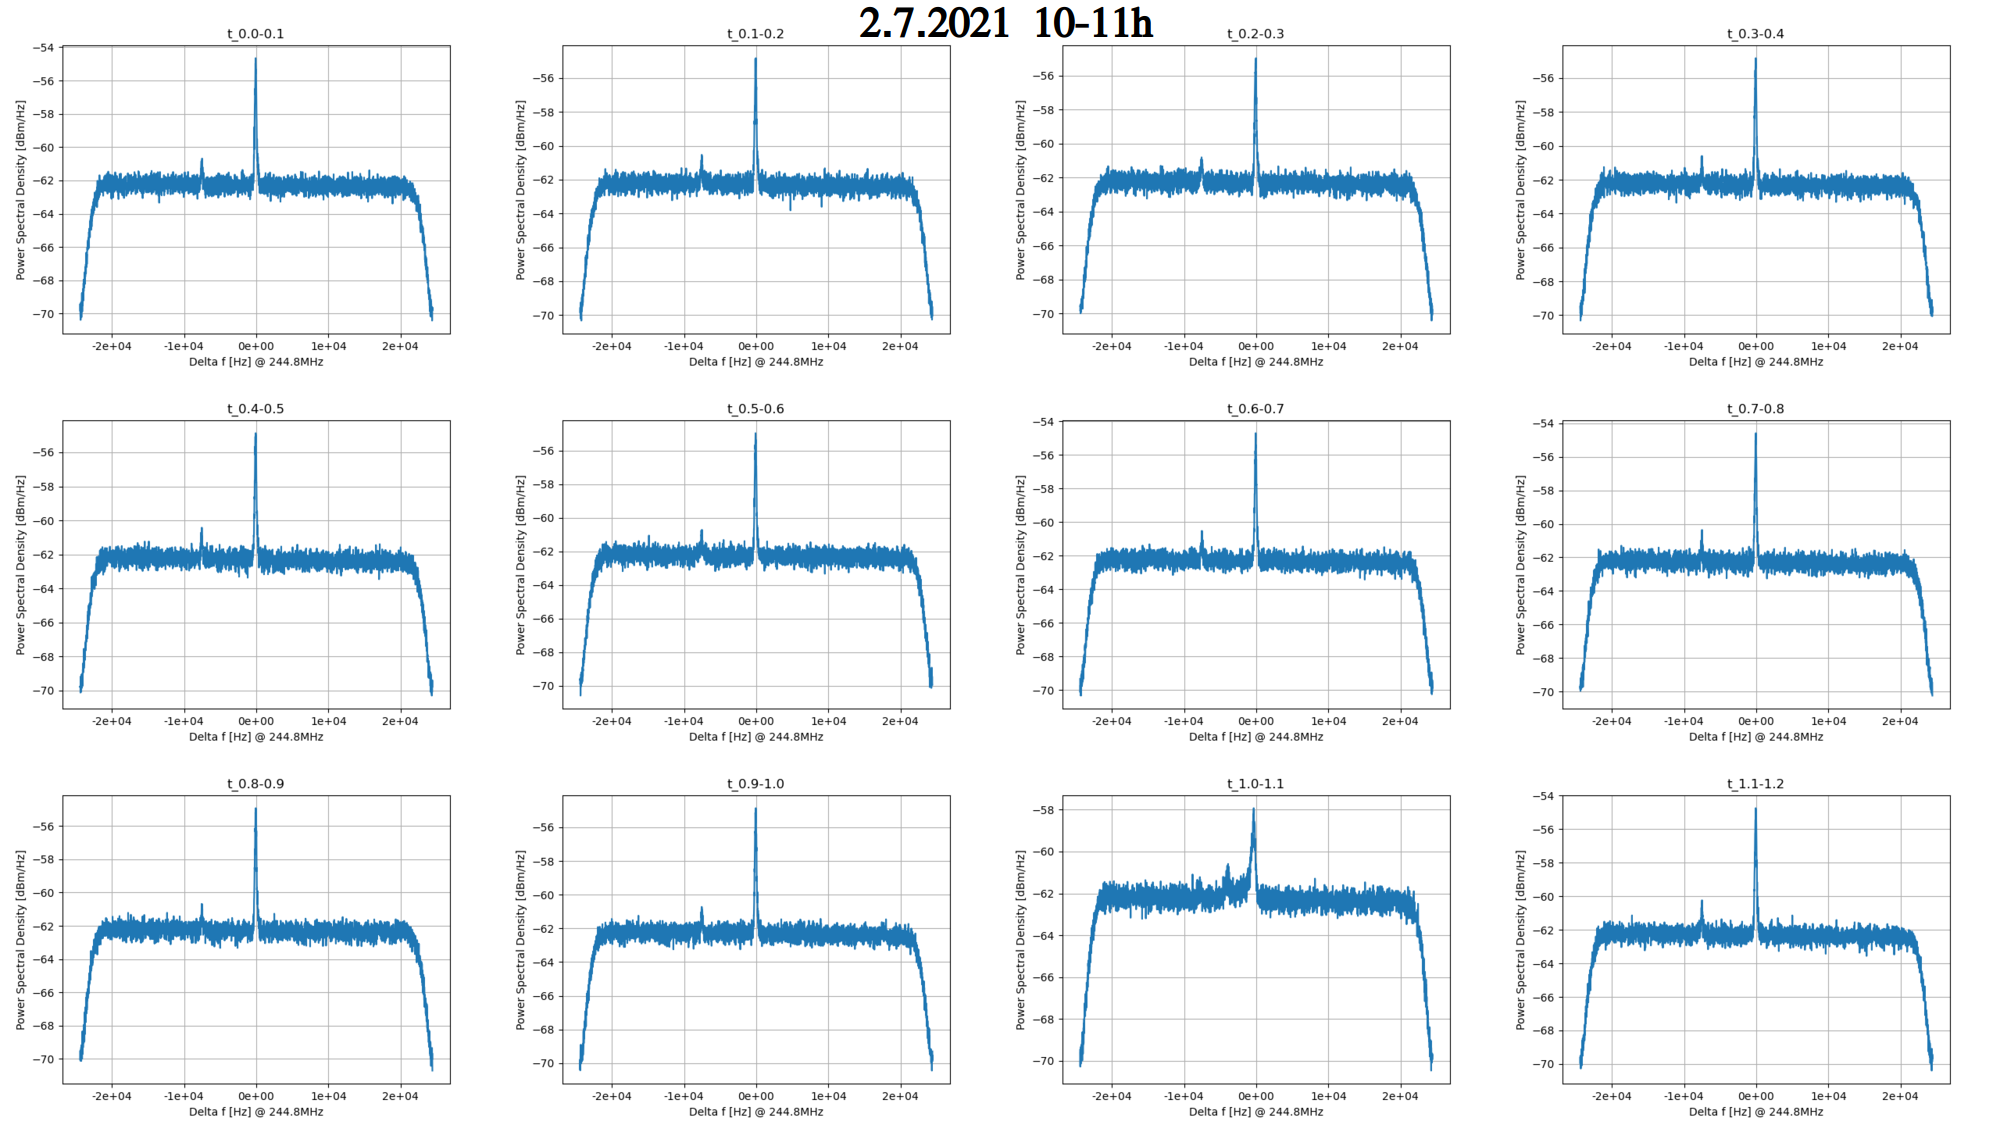
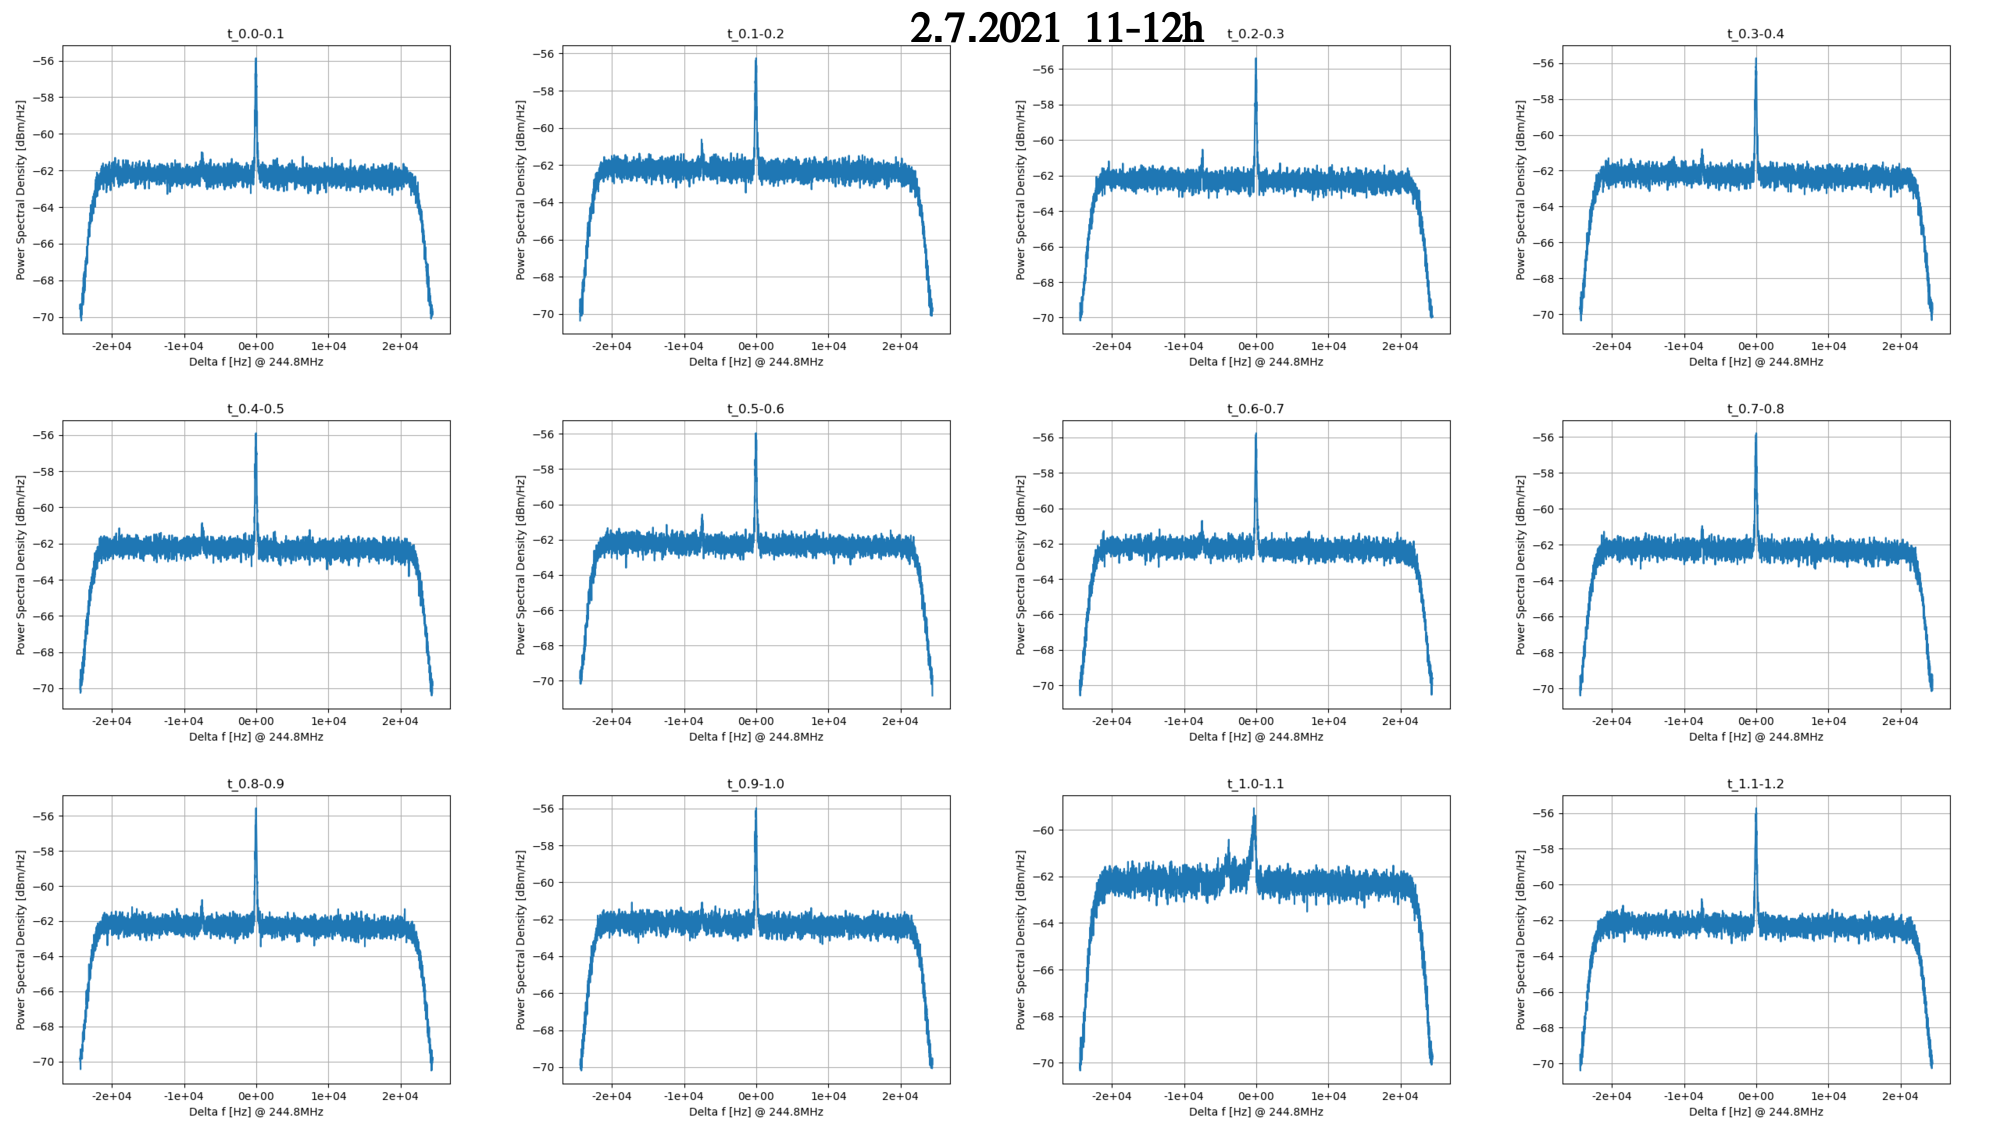
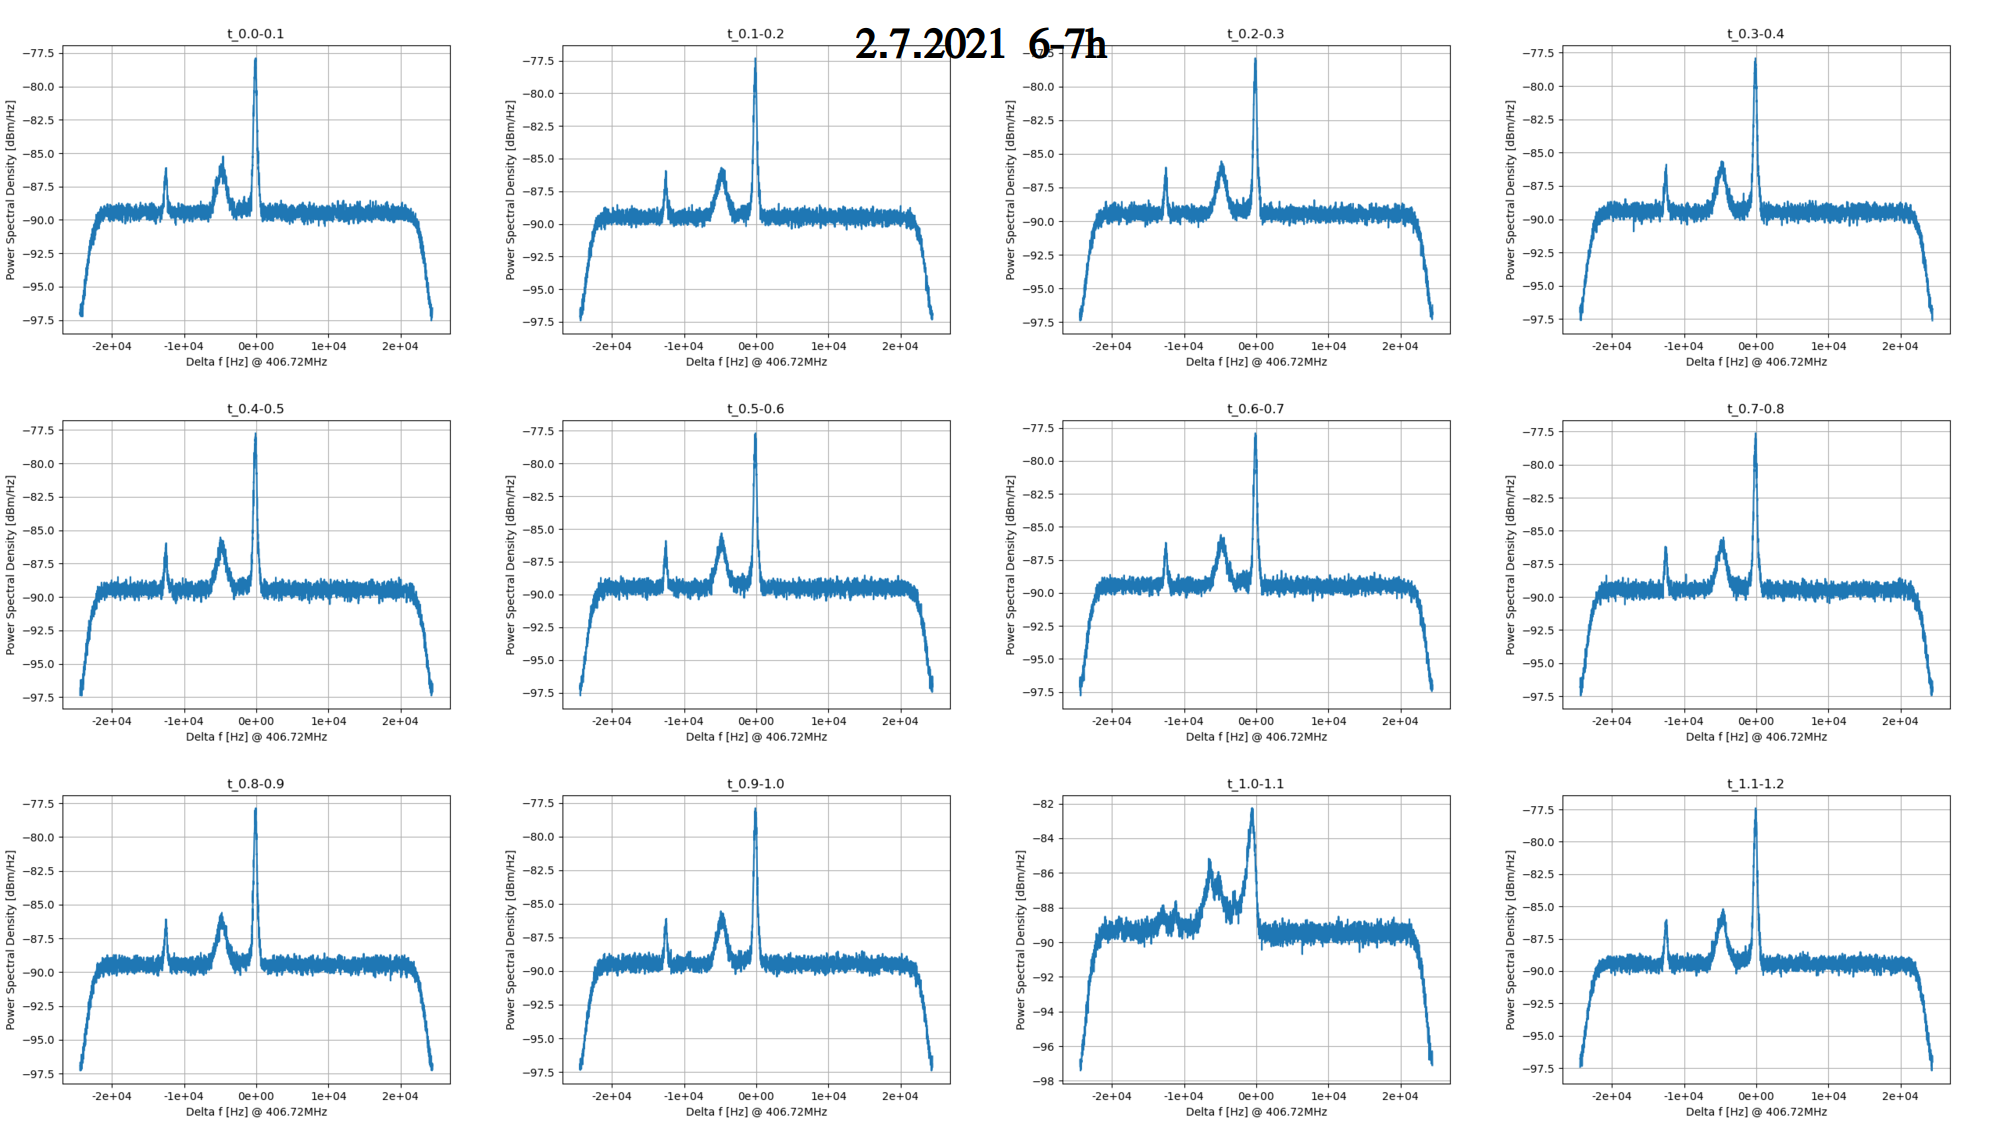
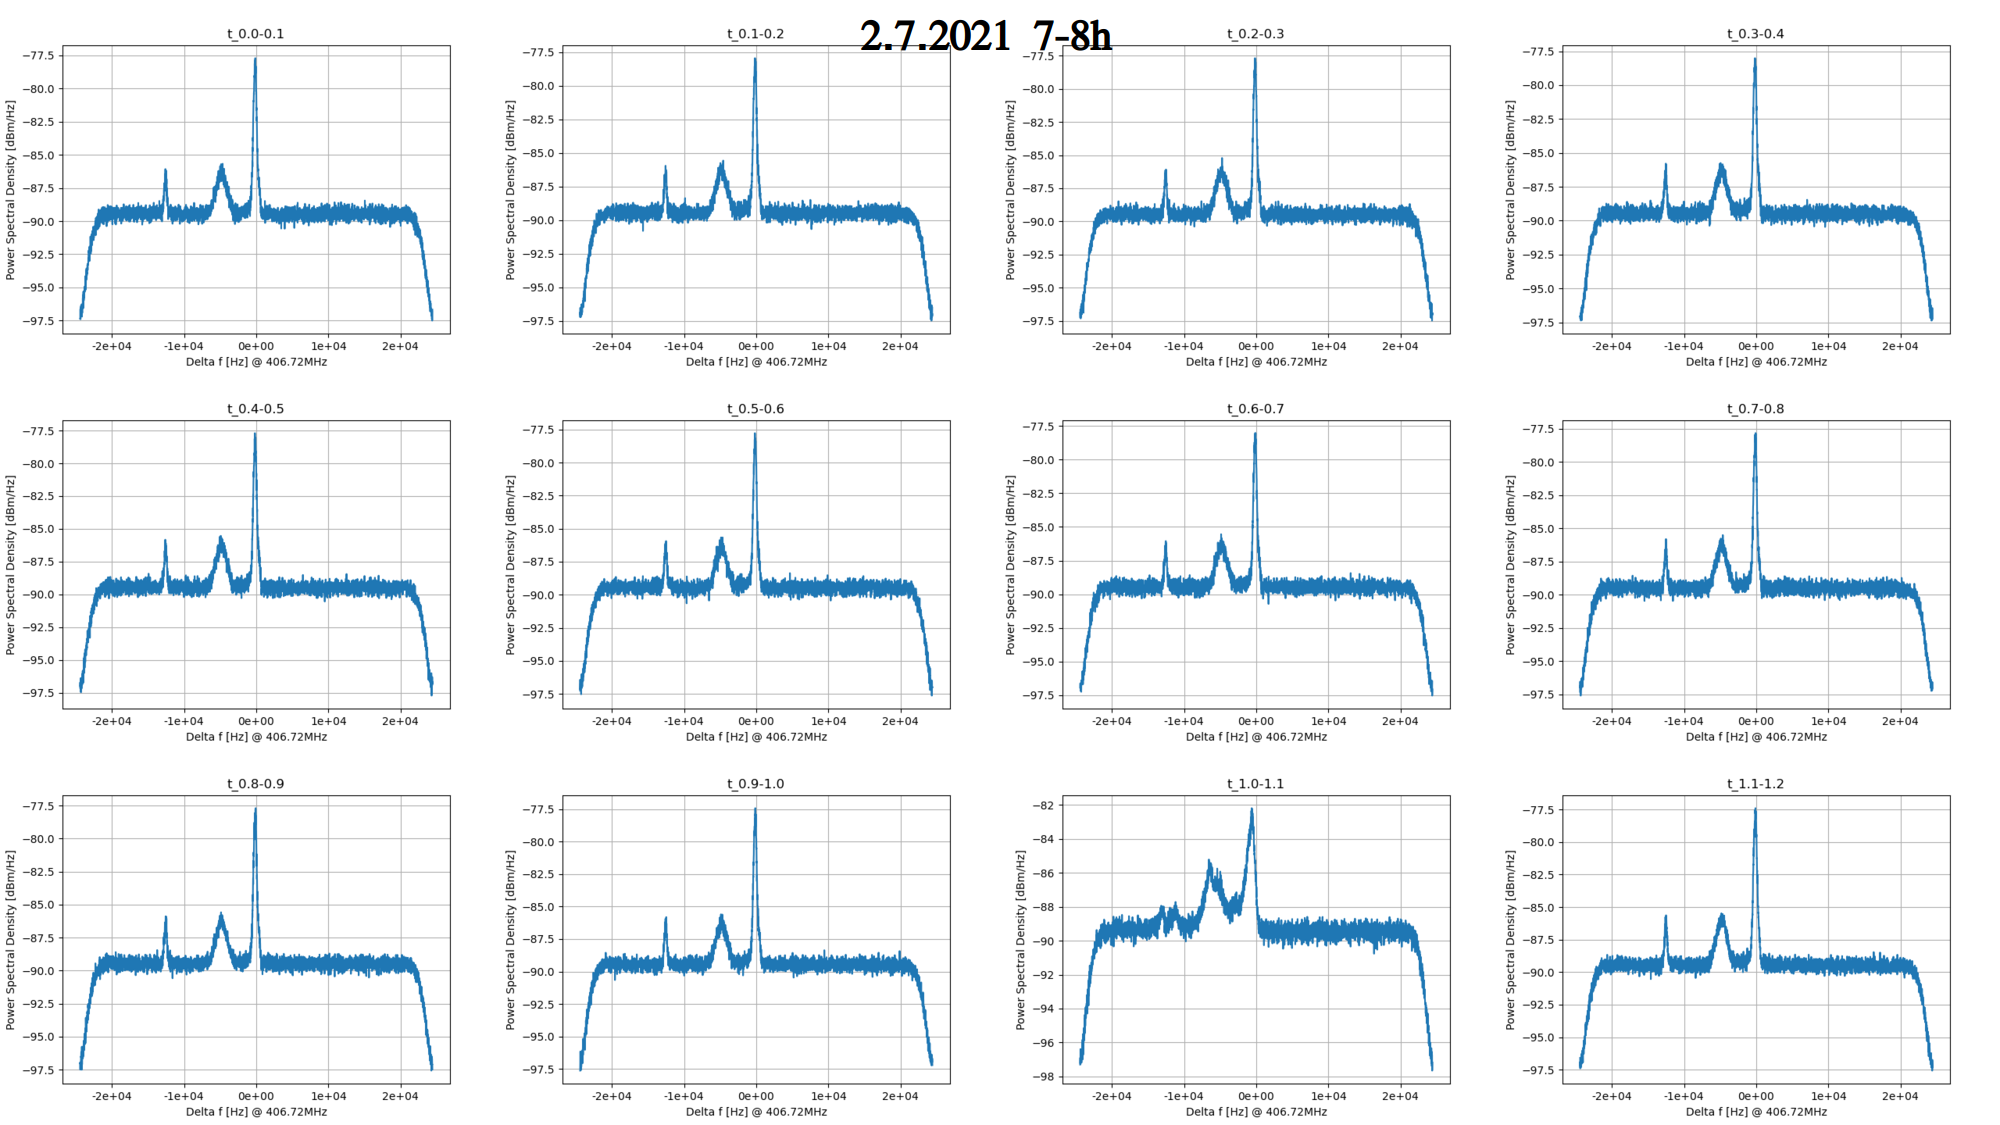
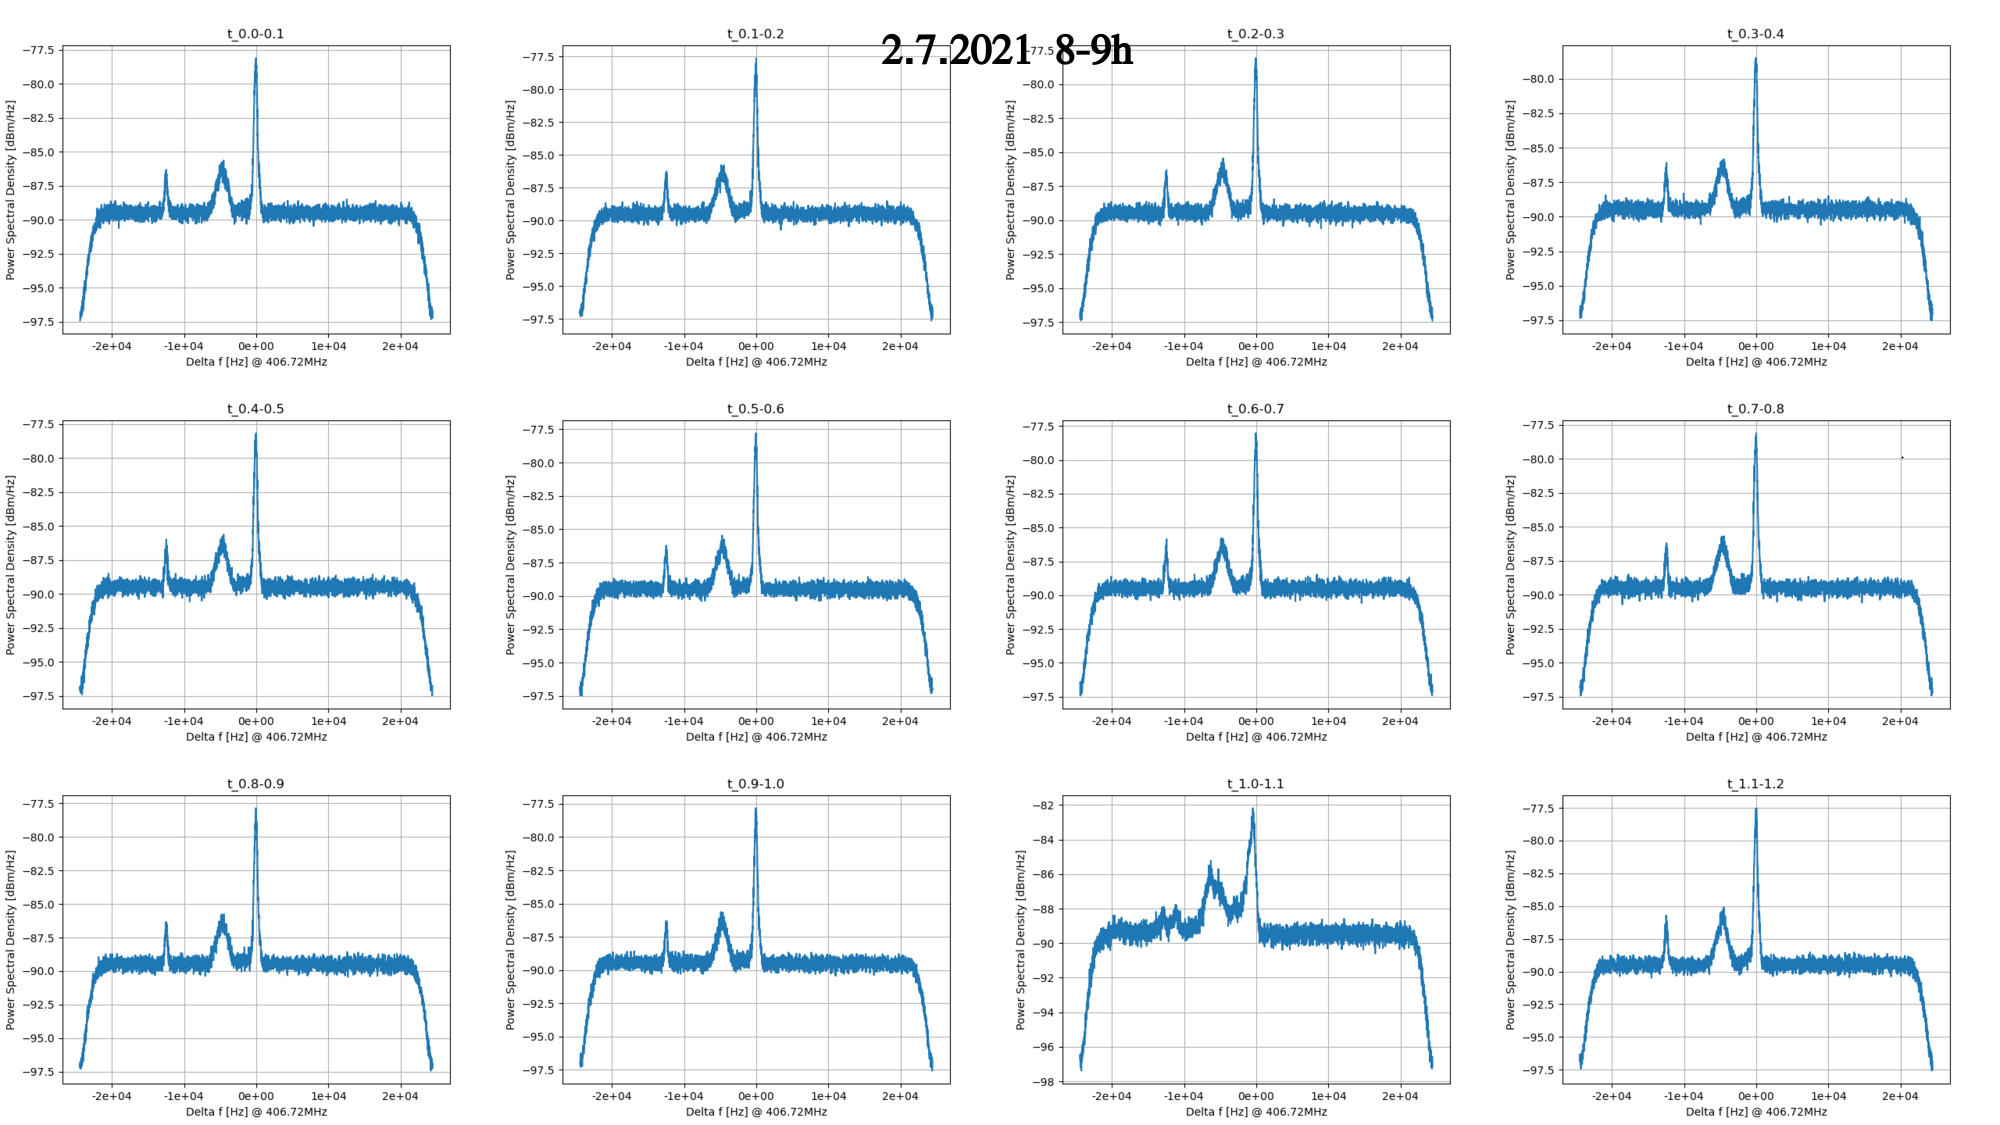
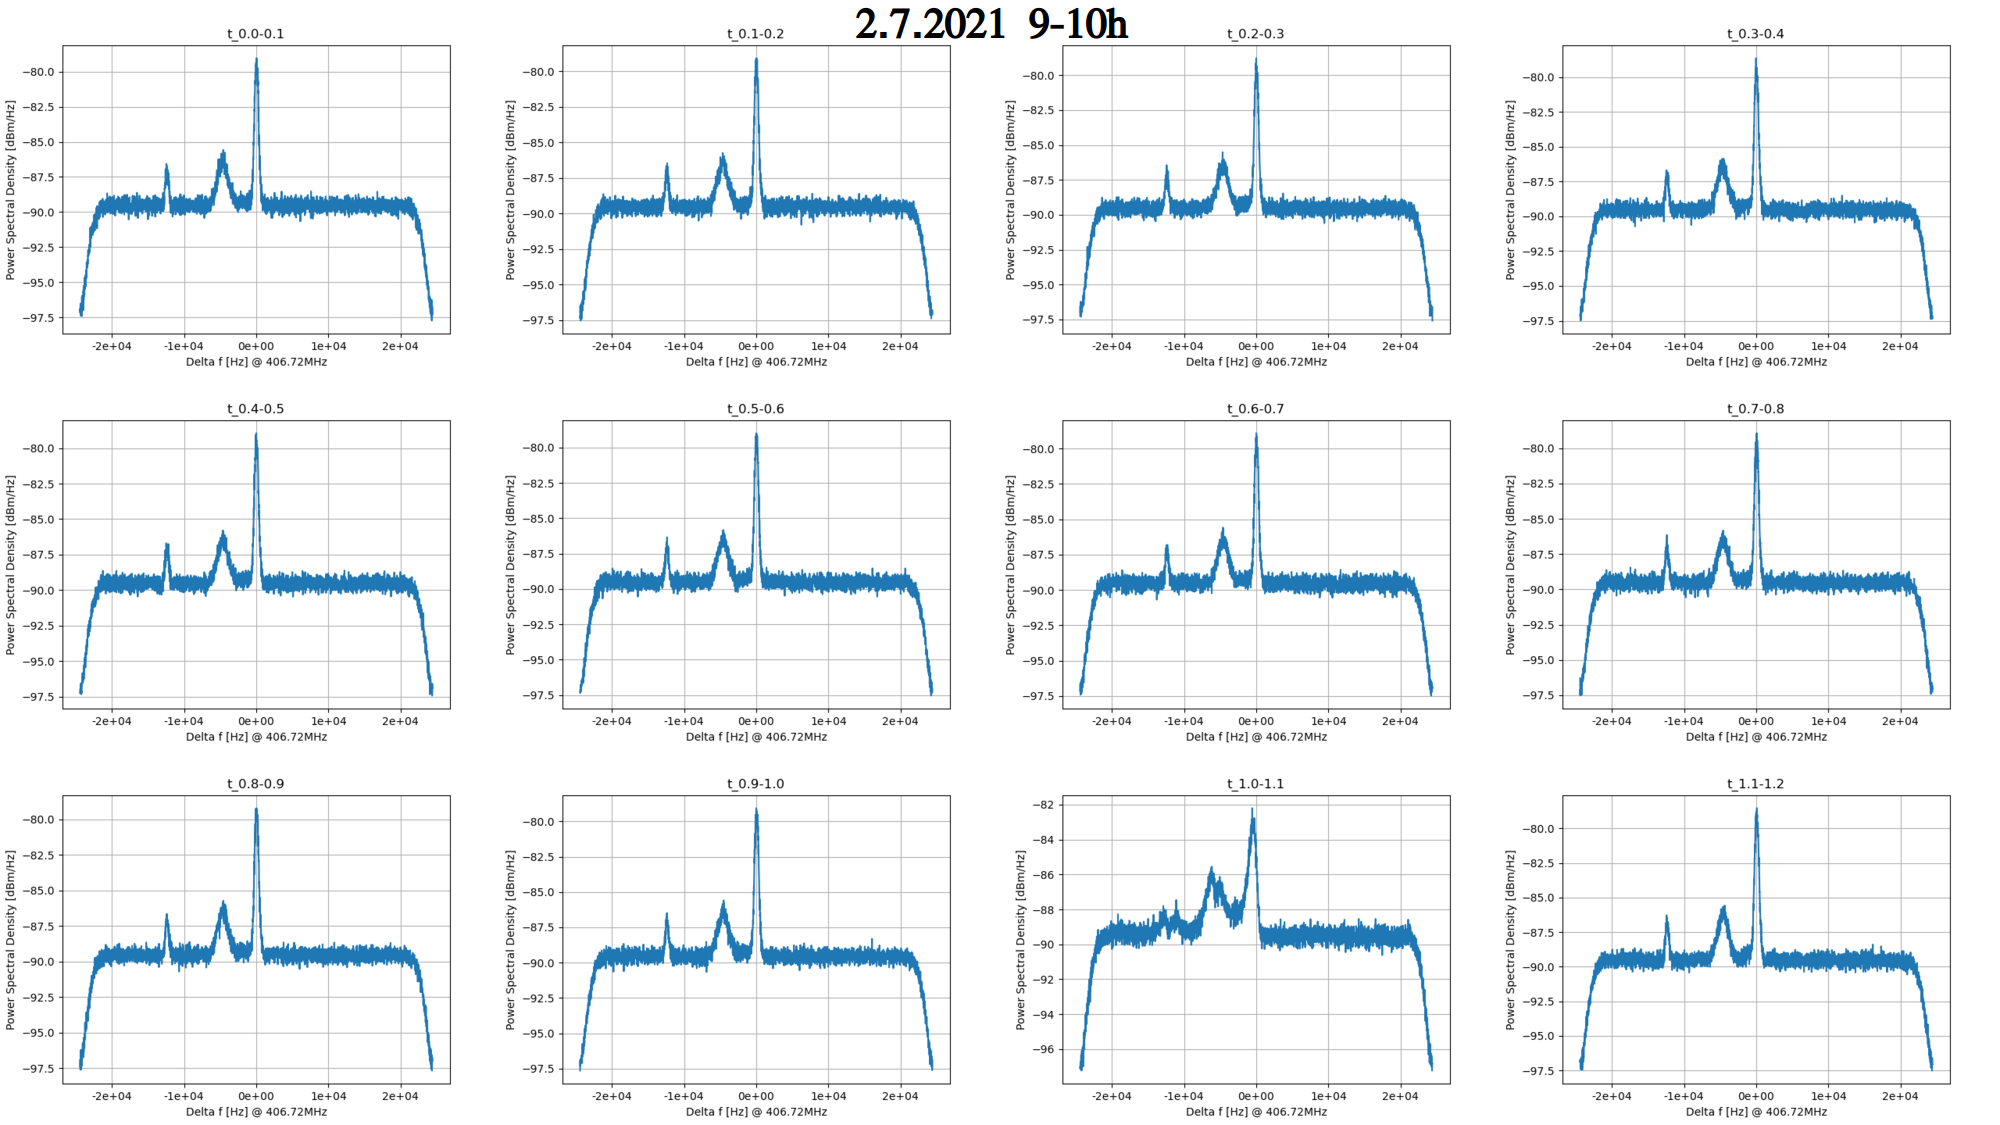
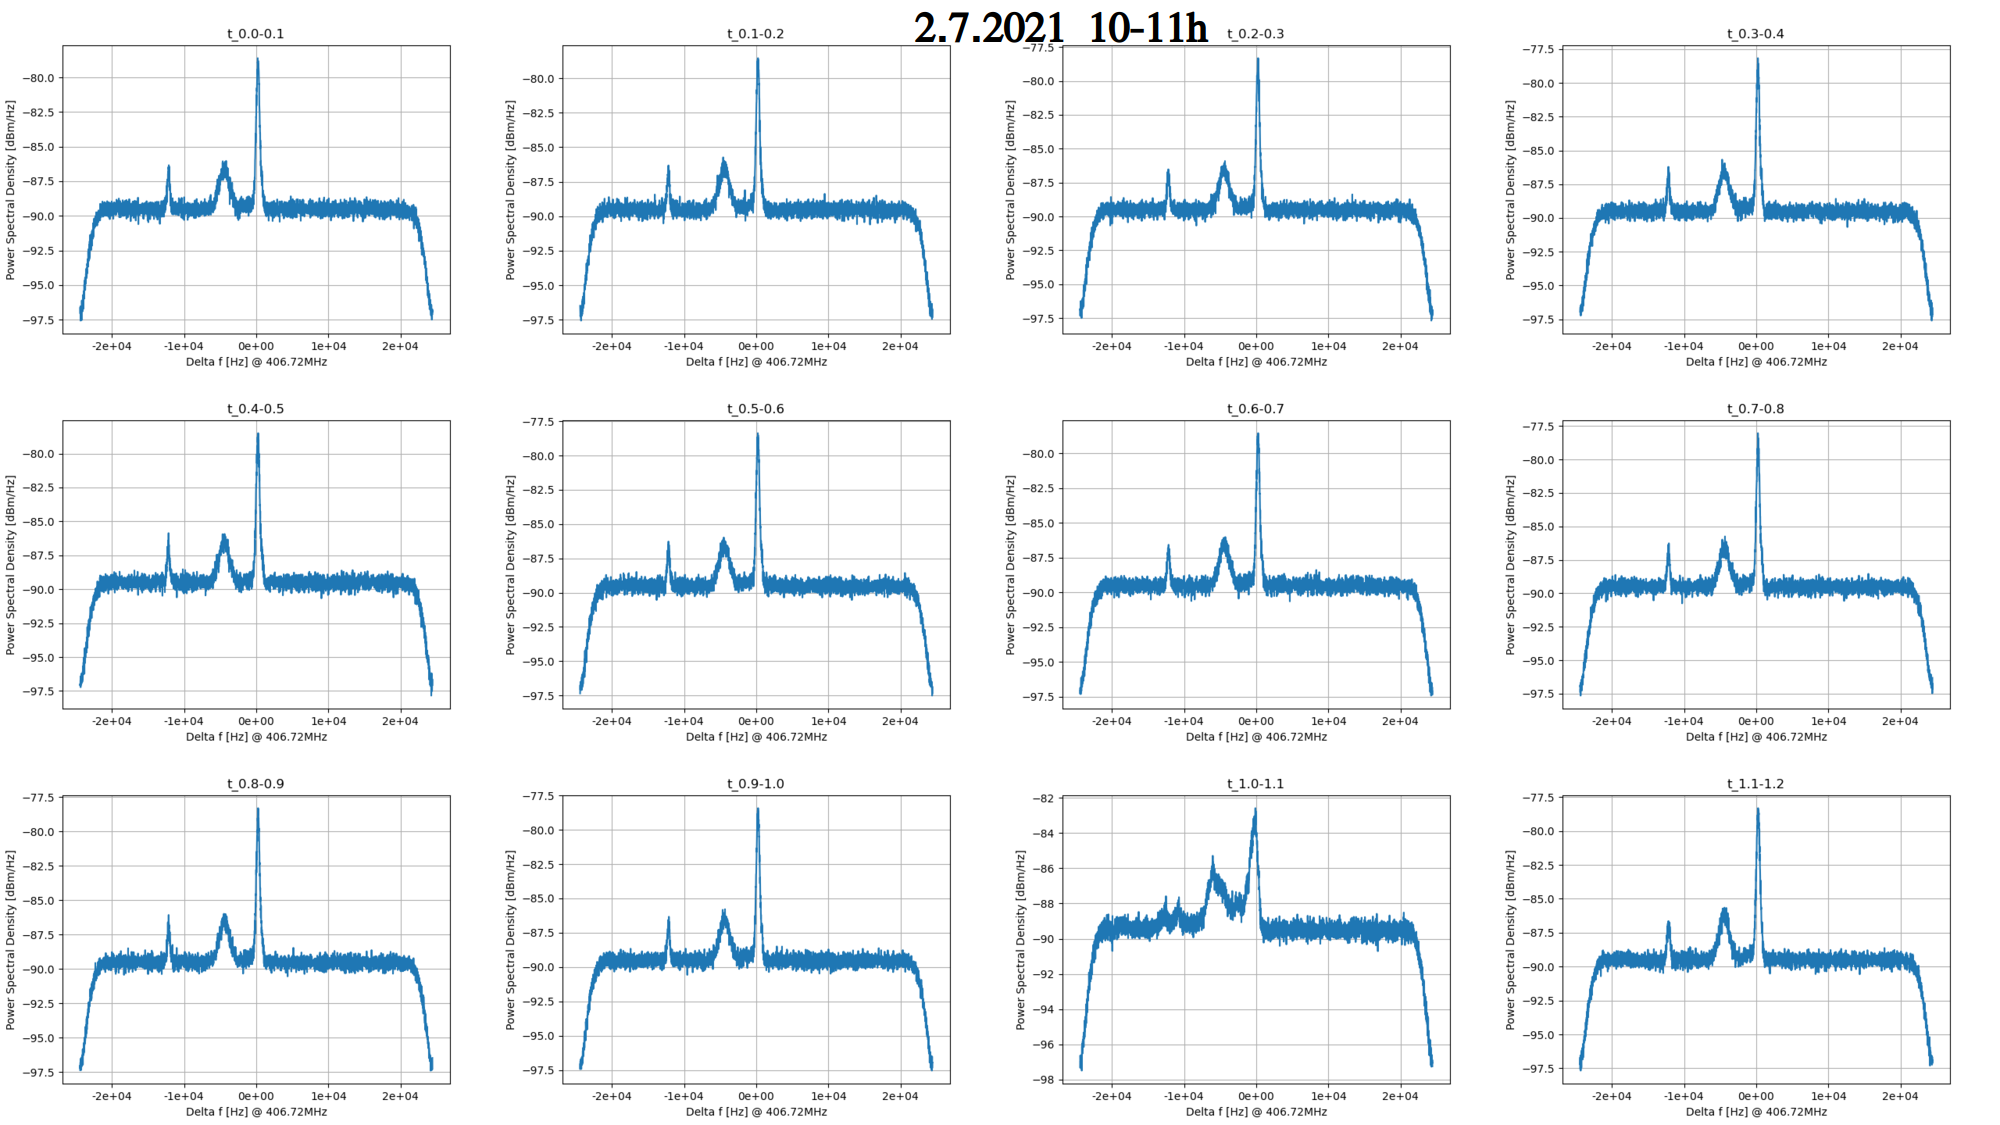
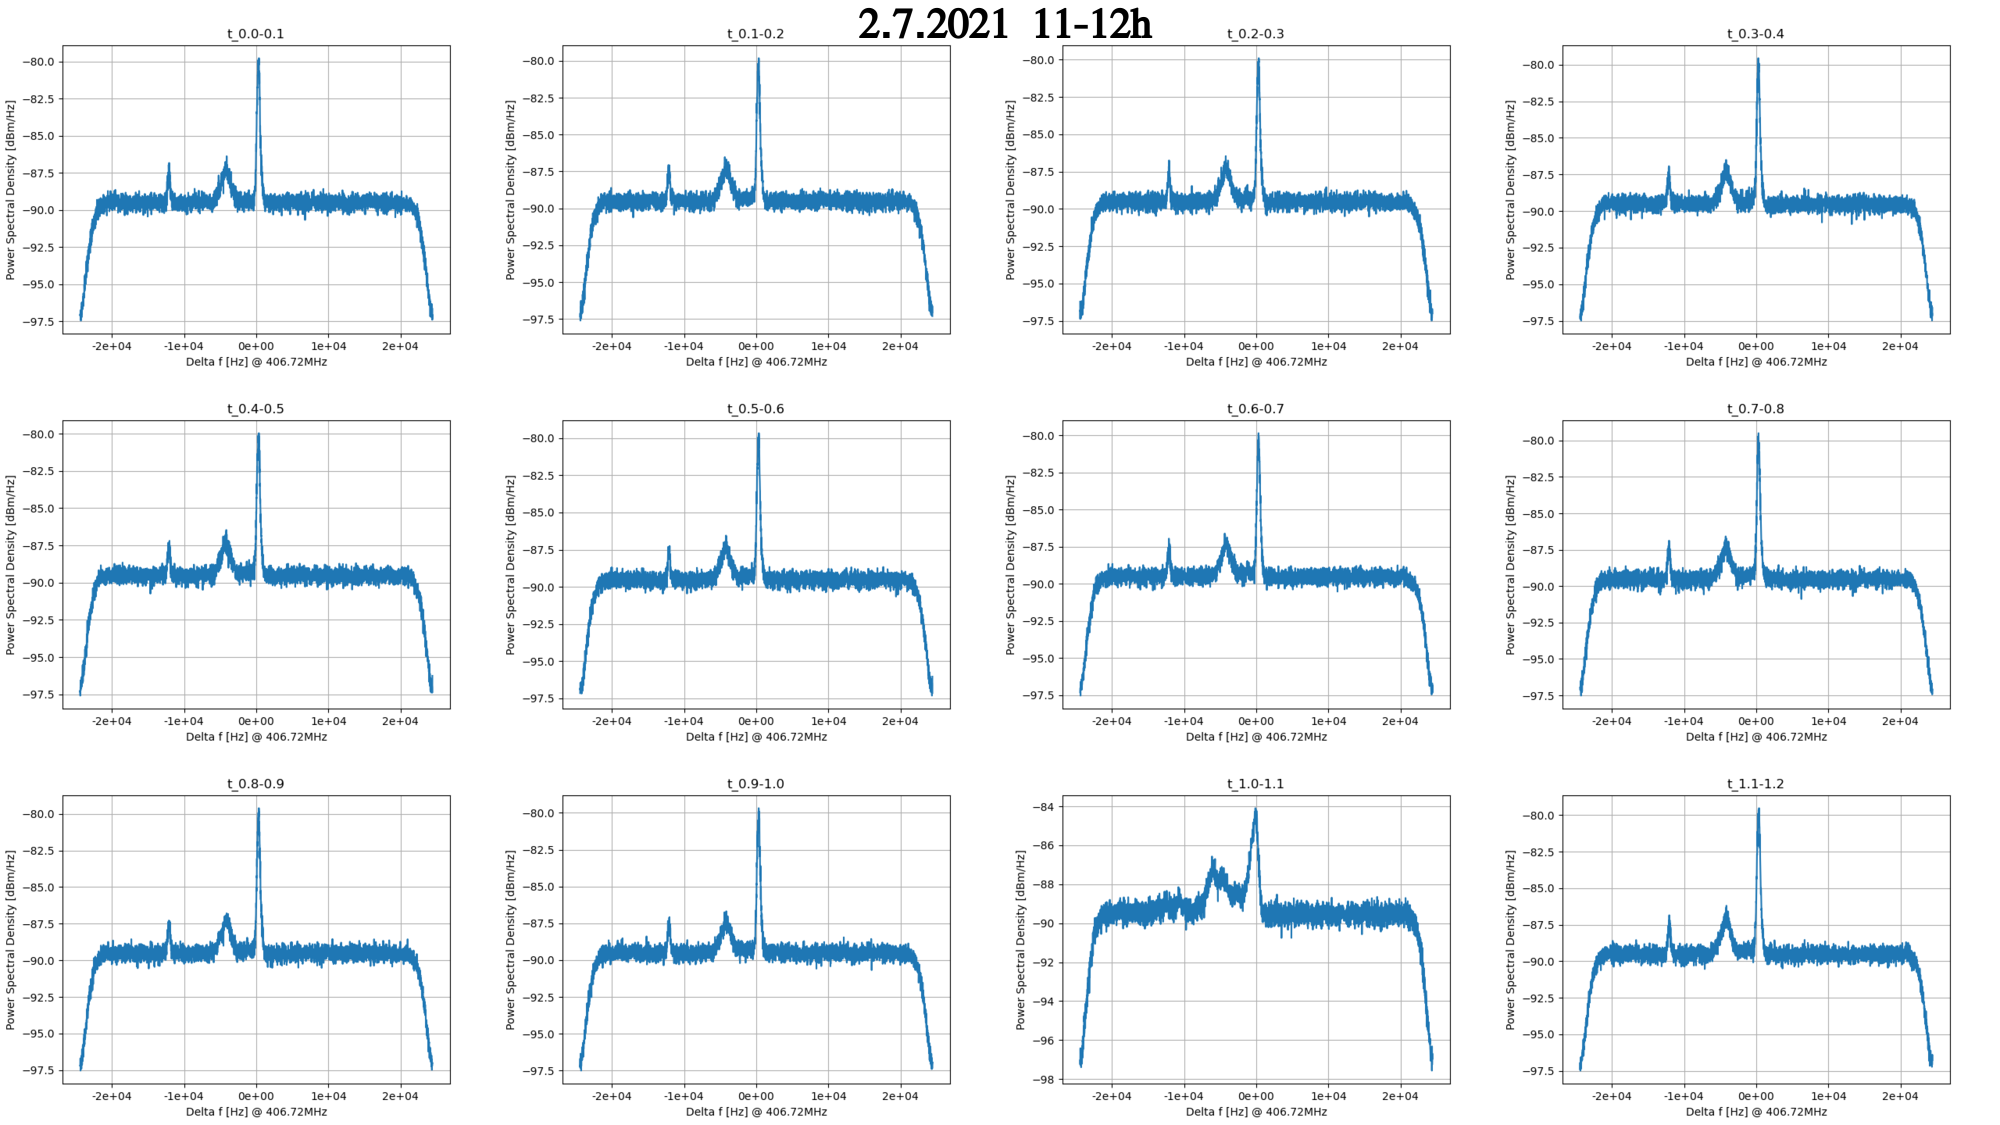
Gregor | Analysis | Spectra 6:00-12:00 |
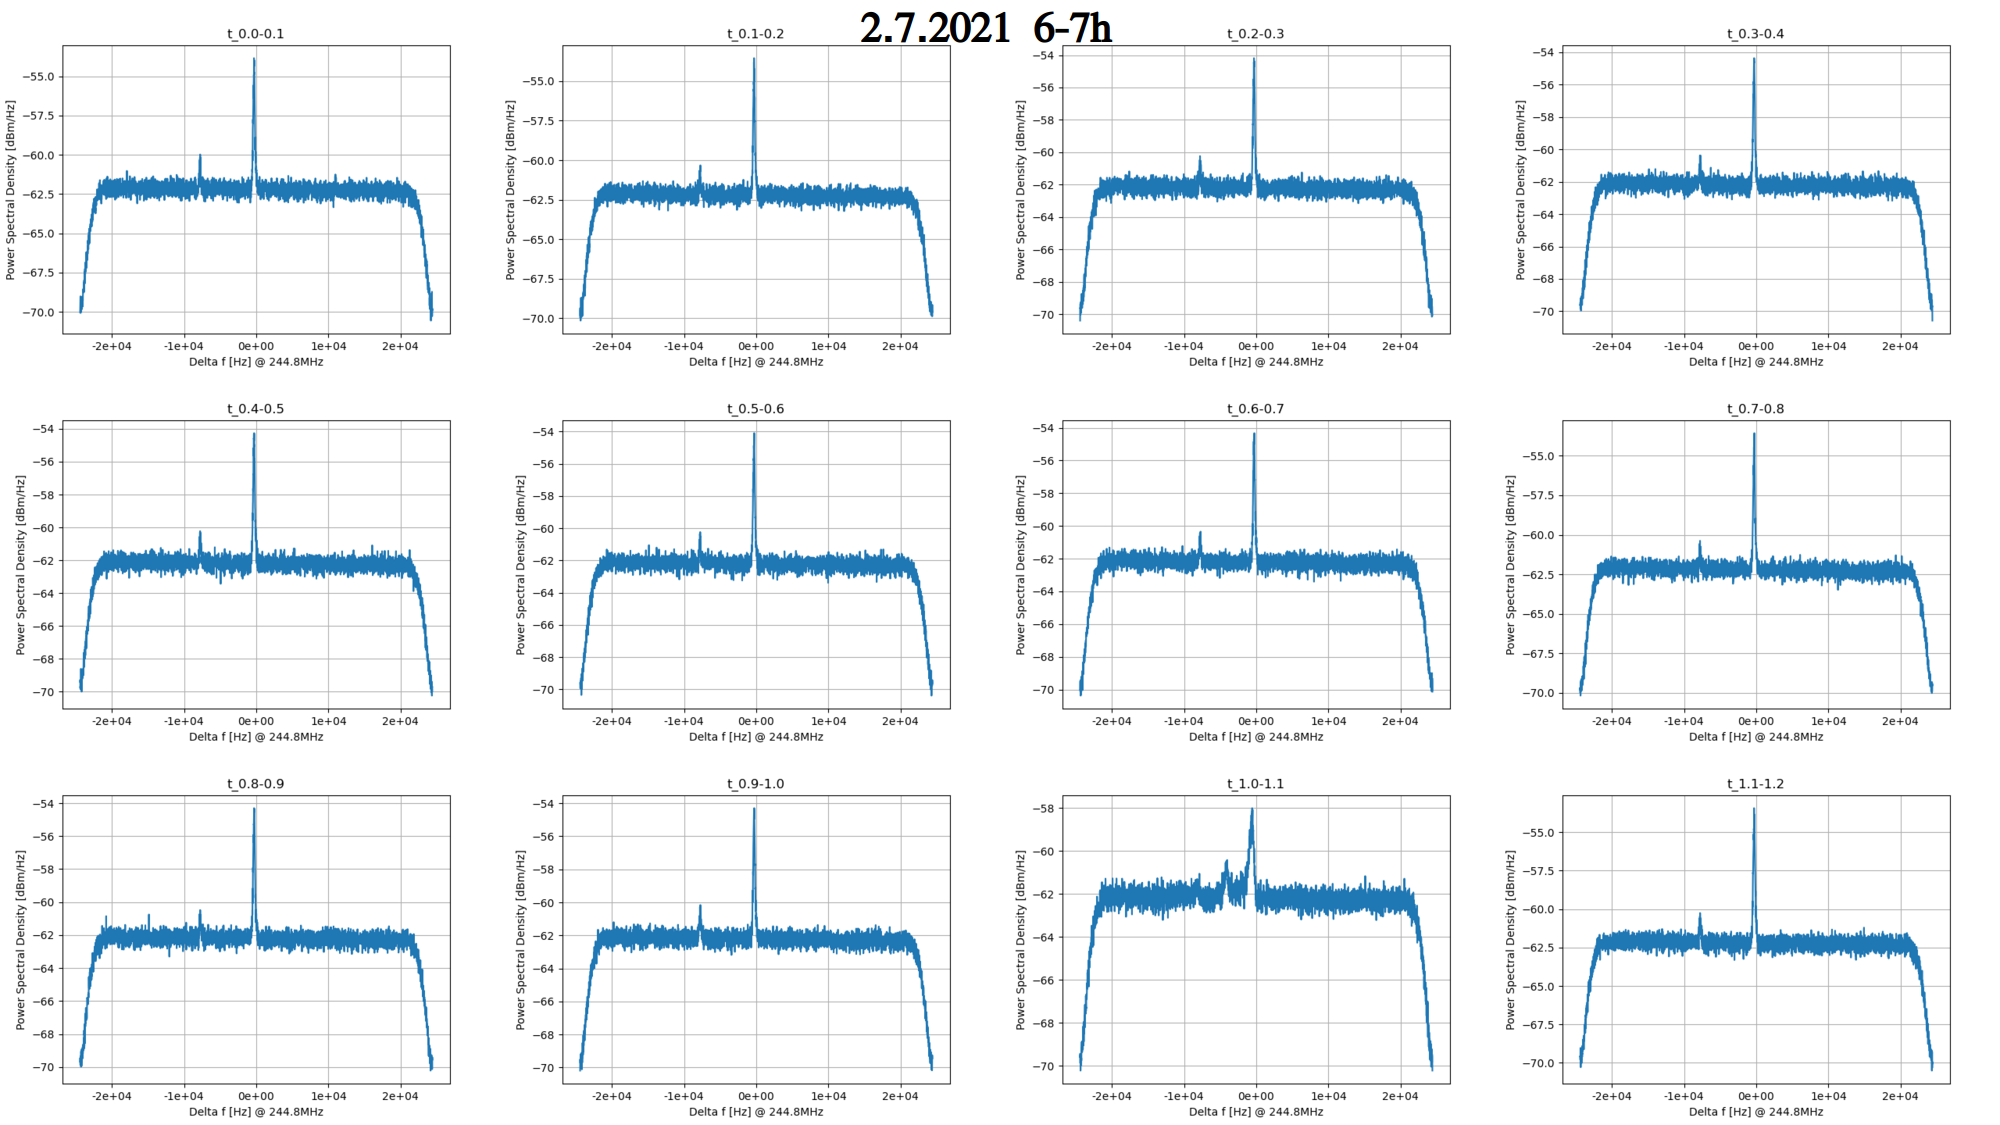
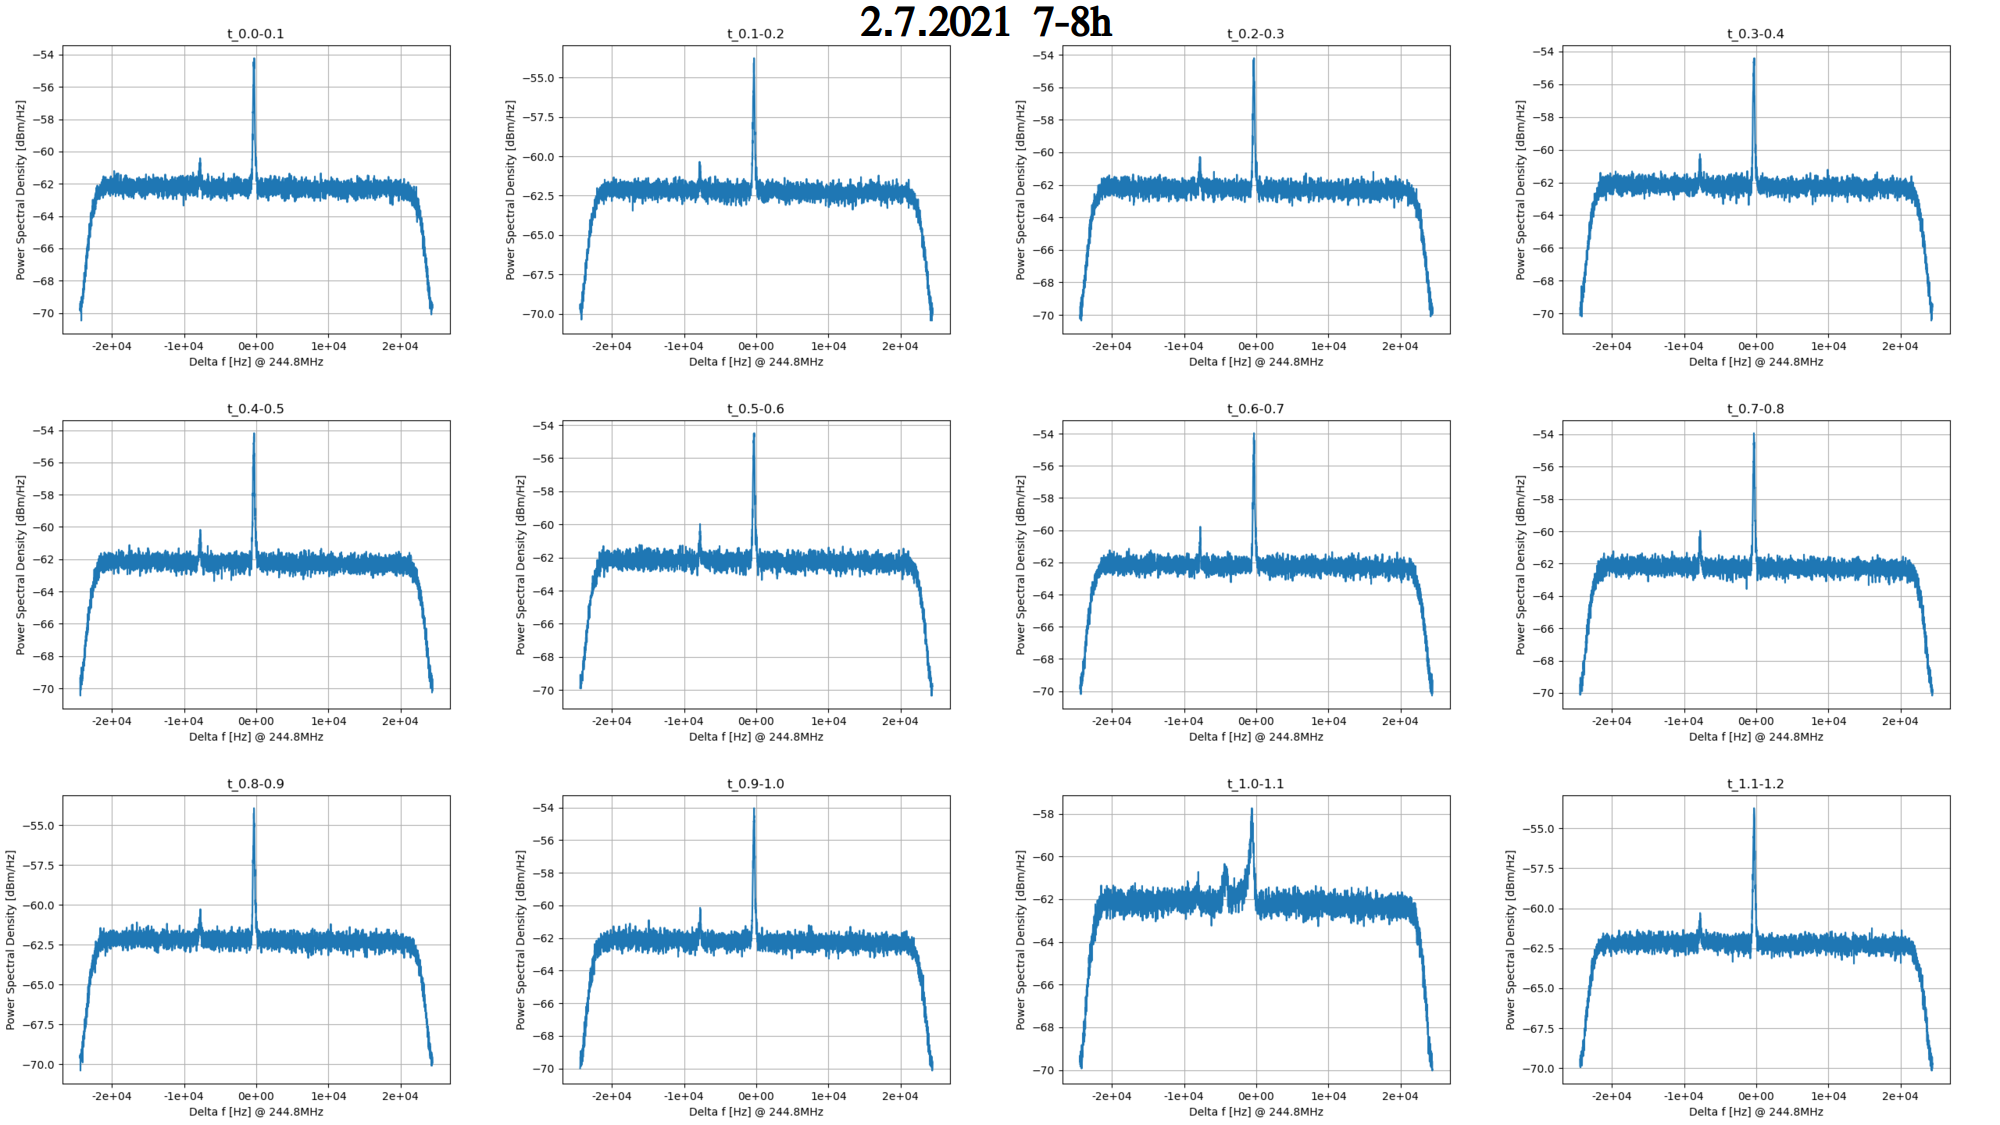
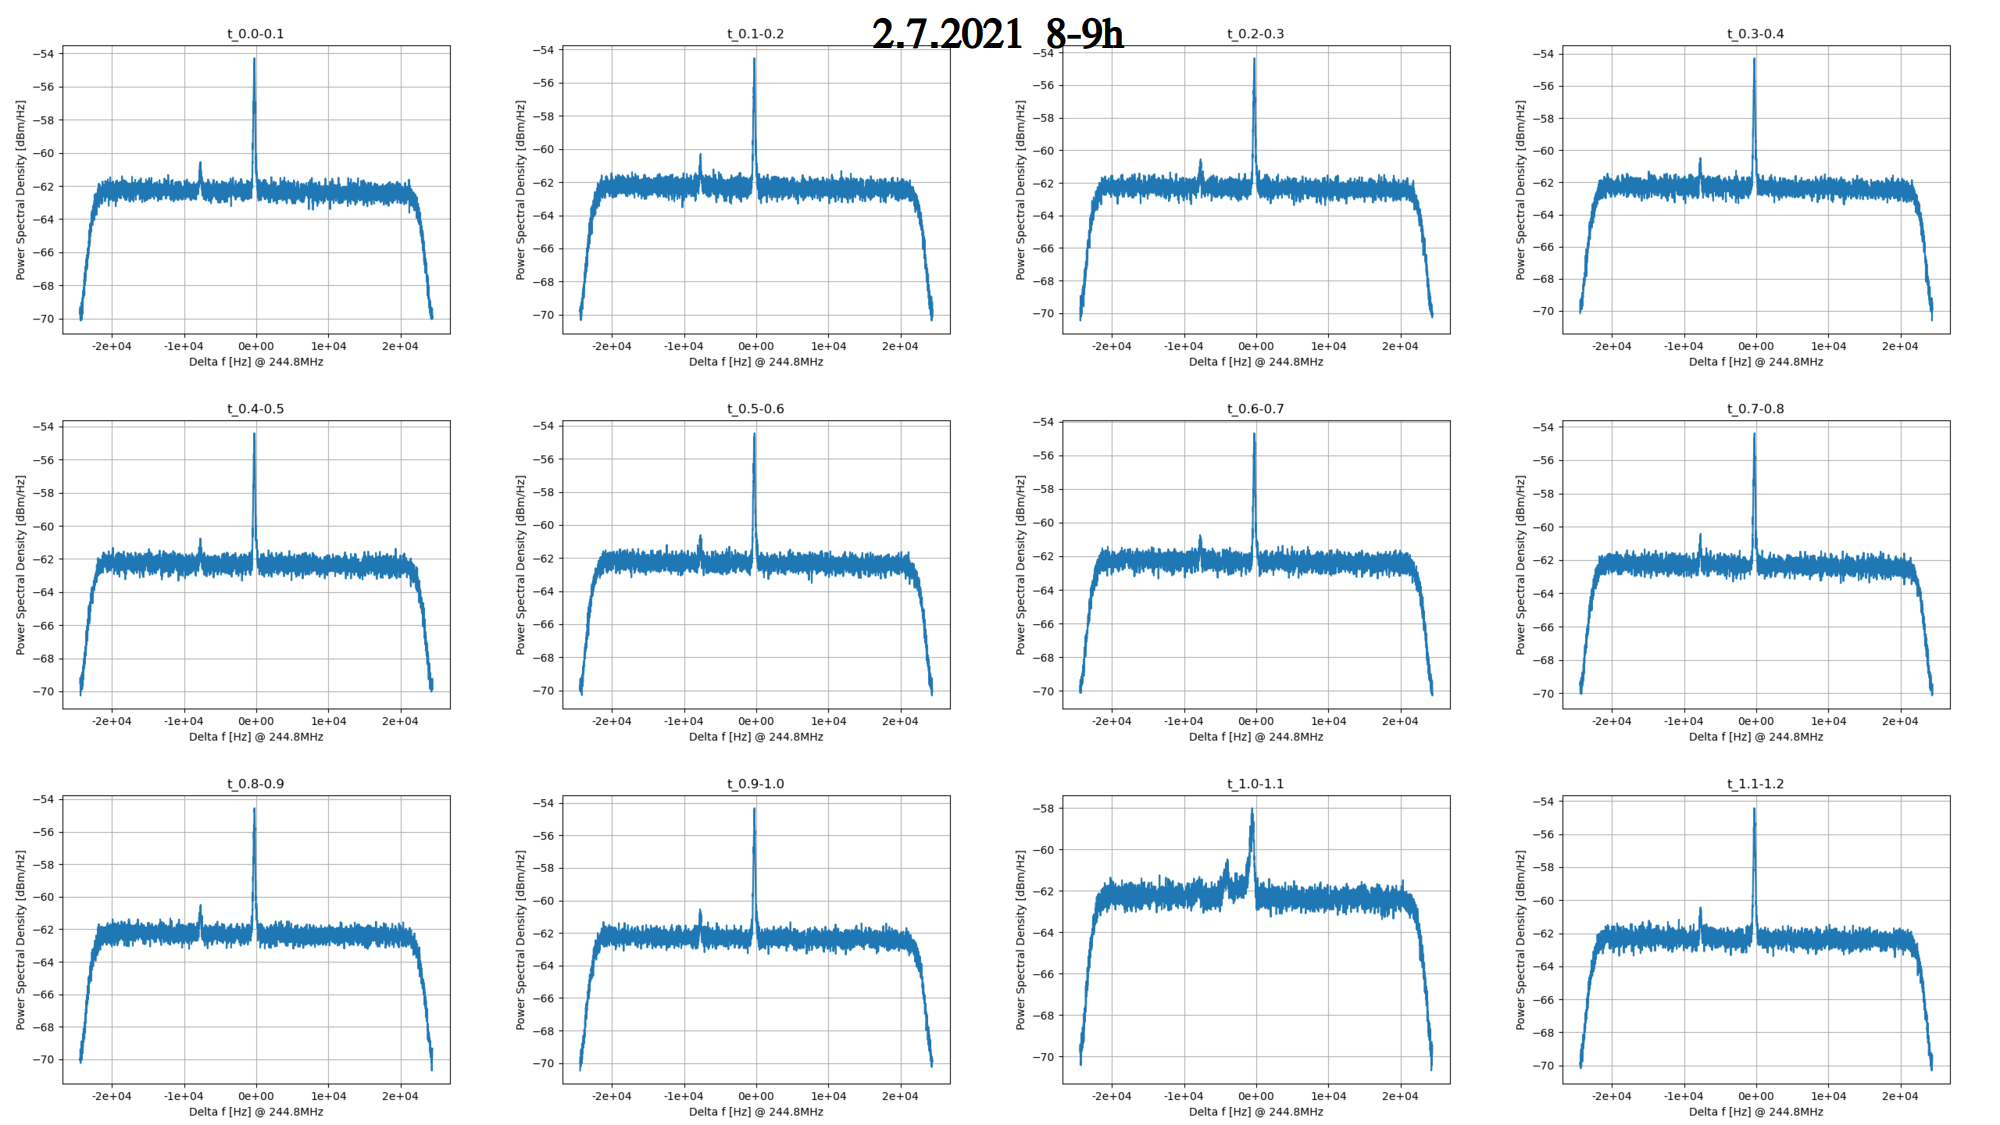
0.1s time slices for 245MHz and 410MHz, with e143_analyzer.py script

python $AnalyzerPath -s 0.$start -t 0.$time sparc-daq-02.gsi.de/E143-245MHz/245MHz-2021.07.02.$hour.* -o t_0.$start-0.$stop |
| Attachment 1: 245MHz_06.png
|
|
| Attachment 2: 245MHz_07.png
|
|
| Attachment 3: 245MHz_08.png
|
|
| Attachment 4: 245MHz_09.png
|
|
| Attachment 5: 245MHz_10.png
|
|
| Attachment 6: 245MHz_11.png
|
|
| Attachment 7: 410MHz_06.png
|
|
| Attachment 8: 410MHz_07.png
|
|
| Attachment 9: 410MHz_08.png
|
|
| Attachment 10: 410MHz_09.png
|
|
| Attachment 11: 410MHz_10.png
|
|
| Attachment 12: 410MHz_11.png
|
|
|
206
|
Fri Jul 2 12:18:35 2021 |
Pavlos, Alexandre | Accelerator | e-cooling |
Sergey Litvinov will now try to setup the e-cooler to cool the beam in the ESR.
The data taking has been stopped (except the NTCAP). |
|
205
|
Fri Jul 2 11:44:25 2021 |
Helmut, Yuri | Accelerator | move scrapers to see effect on unknown lines |
We close the arc inside and straight section inside scrapers to narrow and cut the 70Se line.
Then look what the other lines left of 70Se will do.

1st series with E01DS_HI
 -58  - intensity as before
 -52  - still as before
 -50  - still full
 -45  - less intensity but about same width
 -40  - almost gone
   0  - gone
 -58  - back to old position

2nd series with EEXDS1HG
 16.0 - full
 15.0 - full
 12.5 - less
 10.5 - less intensity
  9.7 - appears only sometimes
  8.2 - gone
10.8 - middle intensity and more narrow, measure for a while |
|
204
|
Fri Jul 2 10:47:56 2021 |
Pavlos, Alexandre | DAQ | NTCAP status |
The latest recorded tdms files:
 p:\E143\sc\SC_2021-06-30_23-27-45\0000485
 p:\E143\iq\IQ_2021-06-30_23-27-34\0002370
2. The rest space on the drive "p:\" : 25,6TByte |
|
203
|
Fri Jul 2 08:54:12 2021 |
Pavlos, Alexandre | DAQ | NTCAP status |
The latest recorded tdms files:
 p:\E143\sc\SC_2021-06-30_23-27-45\0000459
 p:\E143\iq\IQ_2021-06-30_23-27-34\0002242
2. The rest space on the drive "p:\" : 26,1TByte |
|
202
|
Fri Jul 2 07:31:44 2021 |
The remote Canadian eager beavers (Iris and Guy) | Analysis | 00h to 05h Summed Spectra |
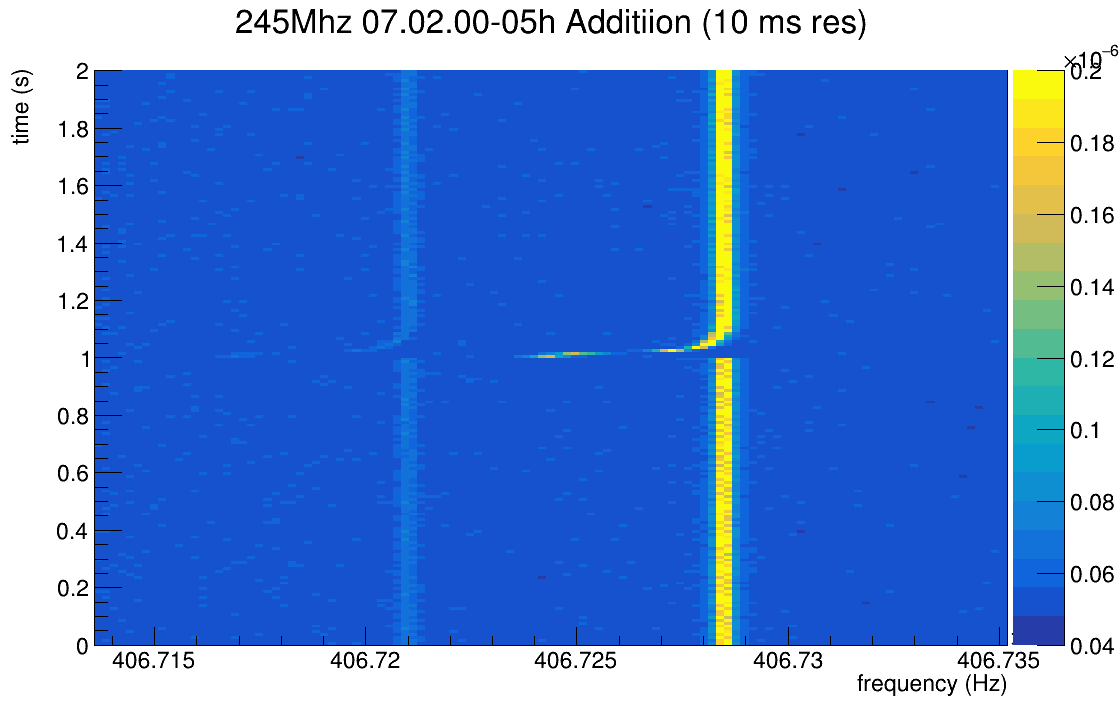
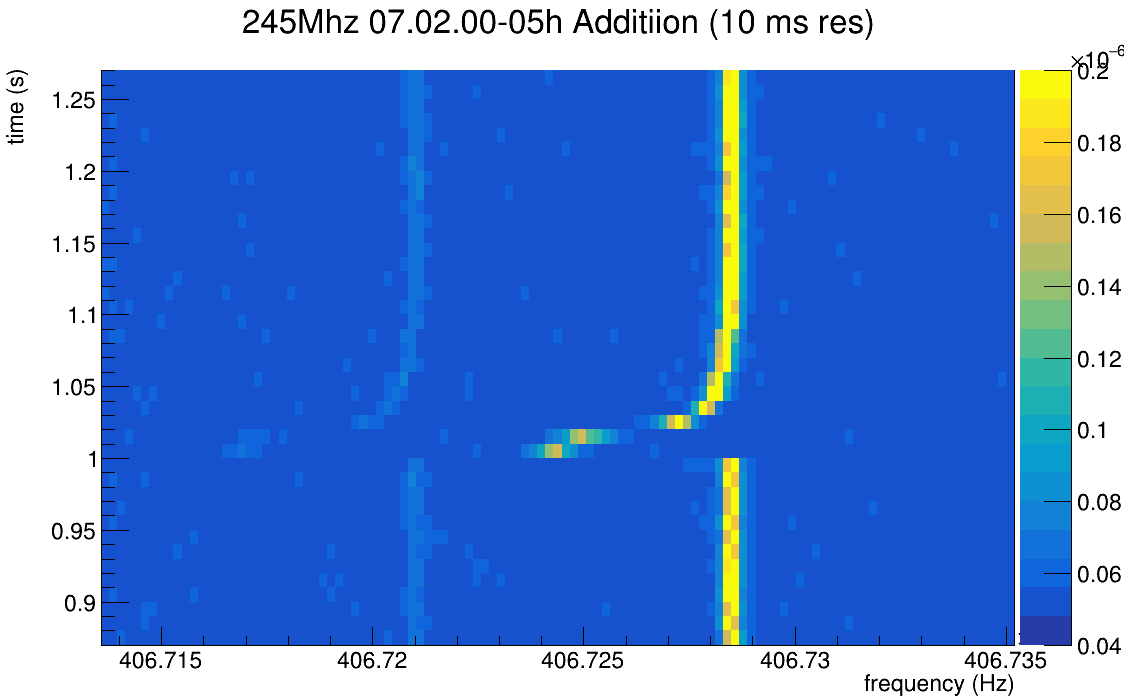
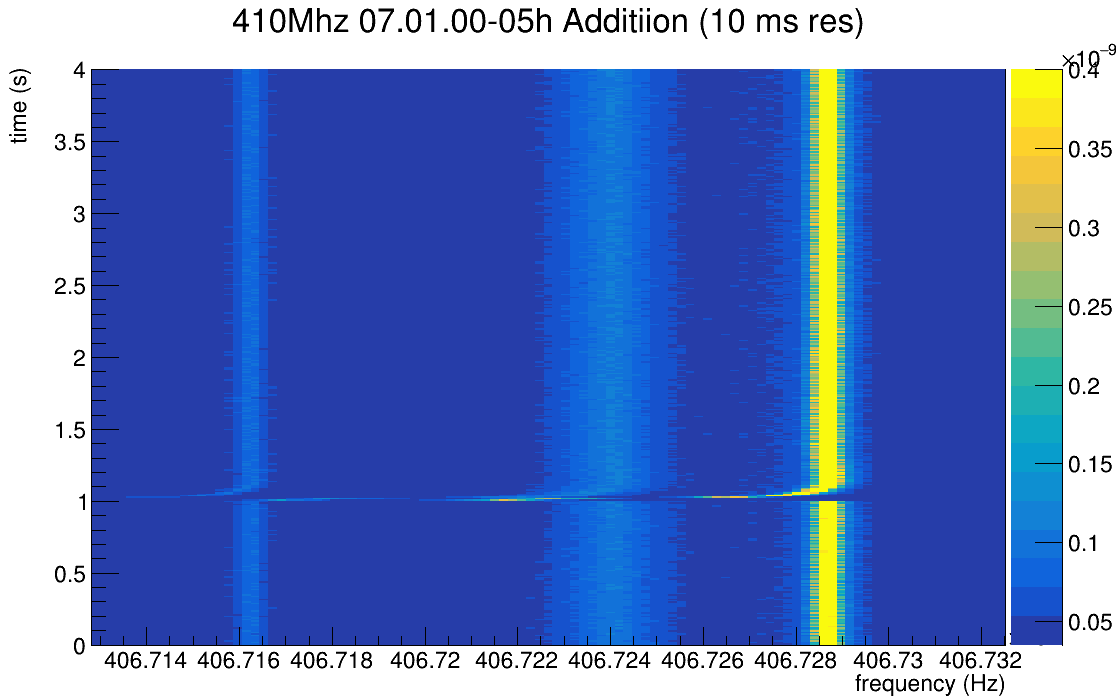
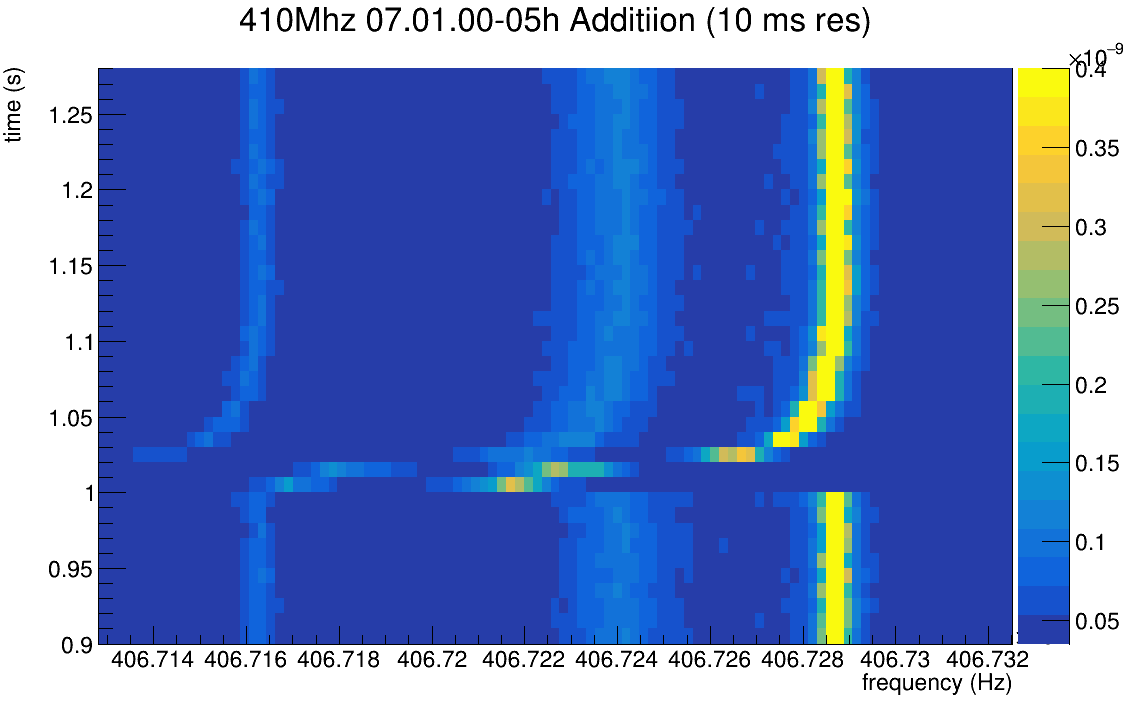
Using the scripts I posted previously, I summed 5.5 hours of data from midnight to 5:30 July 2nd CEST.
I used 10ms time steps for better time resolution, but that did leave questionable frequency resolution. If anyone would like to see higher resolved frequency plots for the
full 5 hours, let me know.
I've attached the spectra from 0s to 4s  for the 410MHz and 0s to 2s for the 245MHz, including zooming in on the injection timing.

Given that we are summing 5 hours of data so the background is very smooth, I can only conclude that either the isomer doesn't exit, we cannot resolve it, or we are
producing incredibly low amounts such that the search needs to be needle in a haystack. |
| Attachment 1: 245MHz-07.02.00-05h-sum_10ms.png
|
|
| Attachment 2: 245MHz-07.02.00-05h-sum_10ms_zoom.png
|
|
| Attachment 3: 410MHz-07.02.00-05h-sum_10ms.png
|
|
| Attachment 4: 410MHz-07.02.00-05h-sum_10ms_zoom.png
|
|
|
201
|
Fri Jul 2 06:52:11 2021 |
The remote Canadian eager beavers (Iris and Guy) | Analysis | Summary of spectra 0:00-6:00 (410 MHz) |
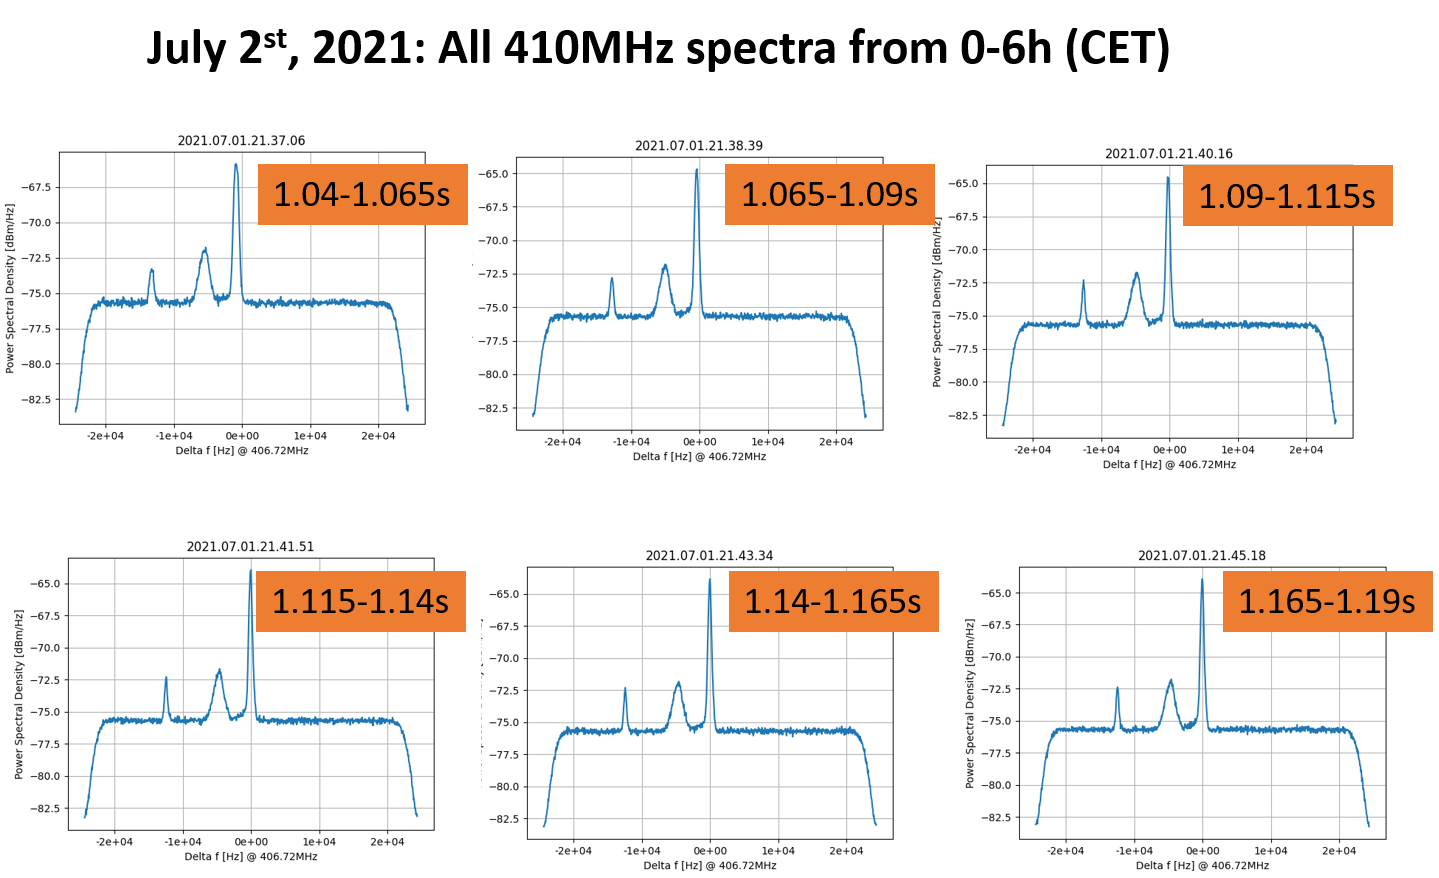
Same as before but for 0-6h, 25ms time slices starting at 1.04s.

> Same as before for 4-5h and 5-6h.
> No isomer, I think :-( (Sorry, Wolfram!)
>
> > Same as before for 0-4h on July 2nd.
> >
> > > Same as before, for 0-1h on July 2nd
> > >
> > >
> > > > The last hour before the gas bottle change is summarized here.
> > > > The first pic shows the 410 MHz spectra taken from 22-23h on the 410 MHz analyzer, in time slices of 0.1 sec from 0s-2s.
> > > > The second pic shows the spectra in 20ms slices from 1s-1.16s.
> > > >
> > > > python3 e143_analyzer.py -s 1.0 -t 0.02 /home/dillmann/.../sparc-daq-02.gsi.de/E143-410MHz/410MHz-2021.07.01.22*
> > > >
> > > > The third spectra was taken in May, for comparison.
> > > >
> > > > I don't think we see anything... |
| Attachment 1: July2-4-0-6h-410MHz_AllSpectra_0.025s_steps_start_1.04s.png
|
|
|
200
|
Fri Jul 2 06:51:45 2021 |
Pavlos, Kanika | DAQ | NTCAP status |
The latest recorded tdms files:
 p:\E143\sc\SC_2021-06-30_23-27-45\0000431
 p:\E143\iq\IQ_2021-06-30_23-27-34\0002106
2. The rest space on the drive "p:\" : 26.6TByte |
|
199
|
Fri Jul 2 06:33:48 2021 |
The remote Canadian beavers (Iris and Guy) | Analysis | Summary of spectra 4:00-6:00 (410 MHz) |
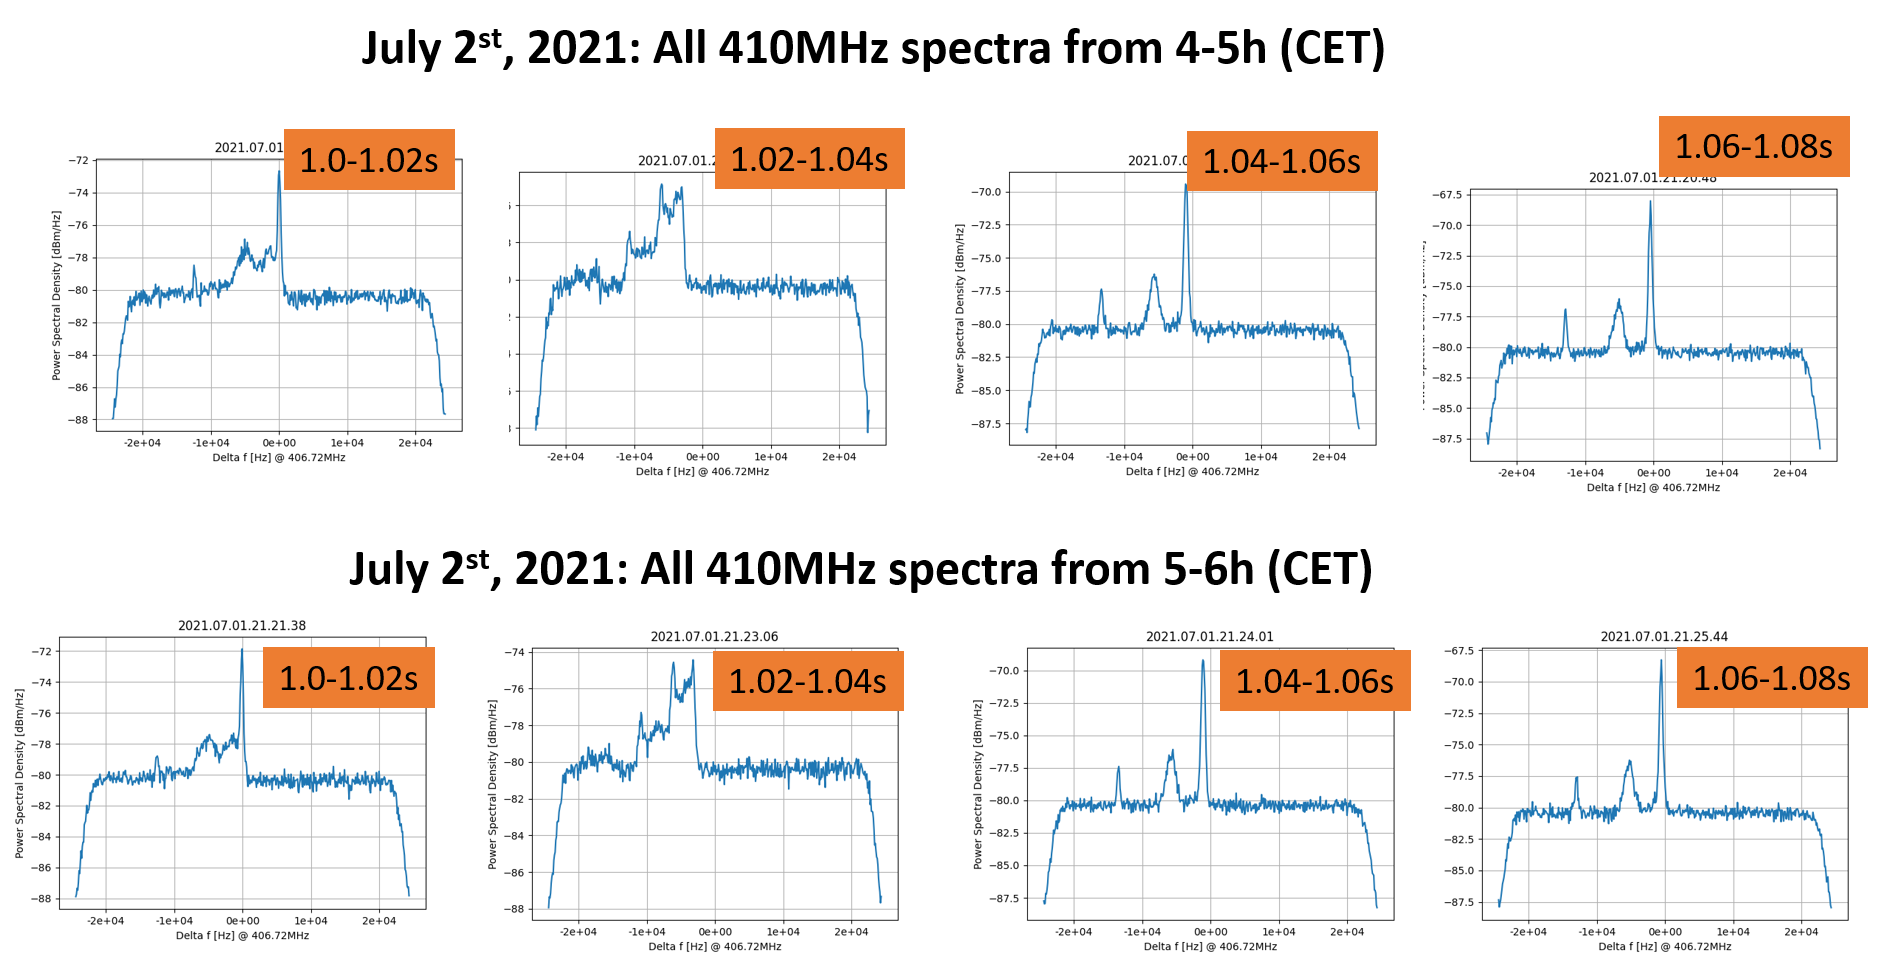
Same as before for 4-5h and 5-6h.
No isomer, I think :-( (Sorry, Wolfram!)

> Same as before for 0-4h on July 2nd.
>
> > Same as before, for 0-1h on July 2nd
> >
> >
> > > The last hour before the gas bottle change is summarized here.
> > > The first pic shows the 410 MHz spectra taken from 22-23h on the 410 MHz analyzer, in time slices of 0.1 sec from 0s-2s.
> > > The second pic shows the spectra in 20ms slices from 1s-1.16s.
> > >
> > > python3 e143_analyzer.py -s 1.0 -t 0.02 /home/dillmann/.../sparc-daq-02.gsi.de/E143-410MHz/410MHz-2021.07.01.22*
> > >
> > > The third spectra was taken in May, for comparison.
> > >
> > > I don't think we see anything... |
| Attachment 1: July2-4-6h-410MHz_Spectra_0.02s_steps_start_1s.png
|
|
|
198
|
Fri Jul 2 05:08:16 2021 |
Guy Leckenby (Canadian beaver team) | Analysis | e143_analyser.py Summing Script |
I've written two scripts that others might find useful for the on-line analysis.
  1. The first is a simple bash script that runs a for loop to run the e143_analyzer.py script for a sequence of start values (-s). You'll need to change the increment and
start/end of the for loop to set the time resolution.
  2. The second is a root script that takes the above generated scripts, reads the histograms, and then fills a 2D histogram. You'll need to adjust the TH2 bin number to
match both the bin number of the TH1s and the number of analysed files. I've included a print line to help identify the TH1 bin number.

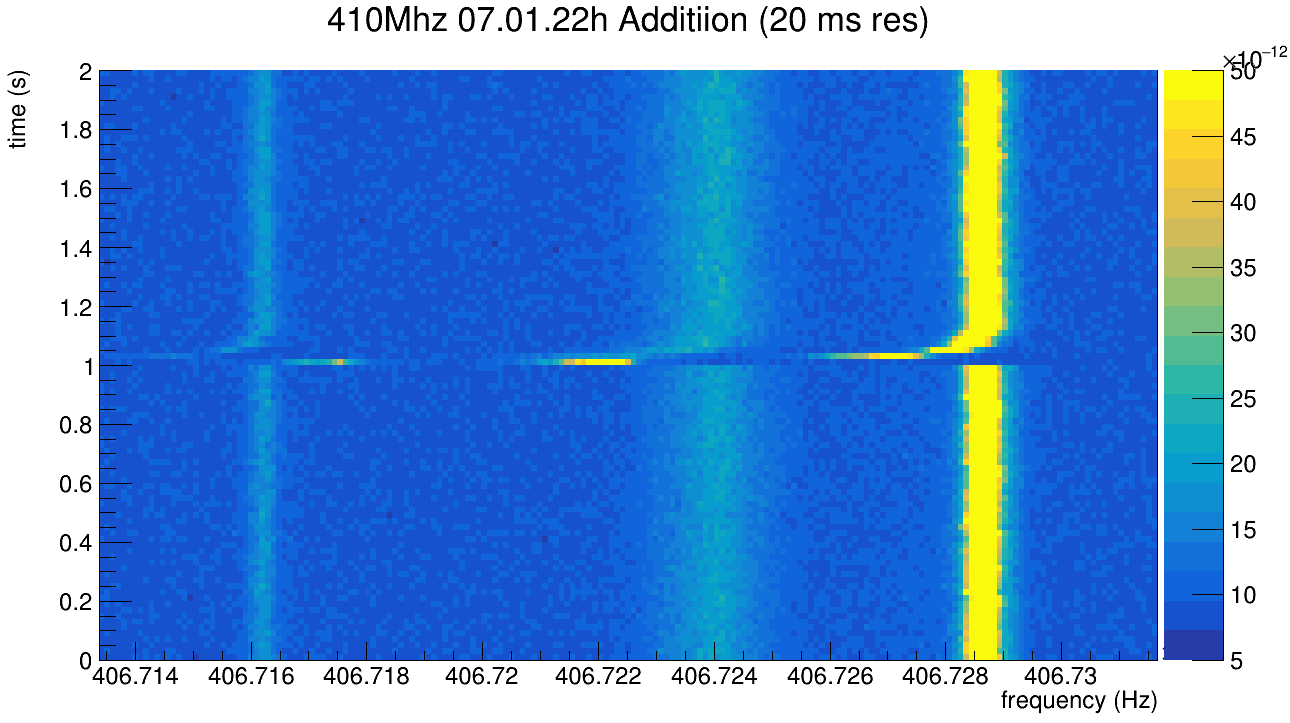
To see the first results, I've attached a sum of July 1st 22-23h data. Sadly, I don't see any indication of the isomer, or at least the production is very low. |
| Attachment 1: e143_sum_ana.bash
|
#!/usr/bin/env bash

for i in $(seq 0 0.02 2)
do
	python e143_analyzer.py -t 0.02 -s $i -o 410MHz-07.01.22h_s${i}_t0.02 E143_Data/sparc-daq-02.gsi.de/E143-410MHz/410MHz-2021.07.01.22*.tiq
done
|
| Attachment 2: e143_comparison.C
|
#define e143_comparison_cxx

#include <iostream>
#include <math.h>
#include <vector>
#include "TROOT.h"
#include "TFile.h"
#include "TChain.h"
#include "TTree.h"
#include "TBranch.h"
#include "TCanvas.h"
#include "TGraph.h"
#include "TGraphPainter.h"
#include "TColor.h"
#include "TH1.h"
#include "TH2.h"
#include "TH3.h"
#include "TH1F.h"
#include "TH2F.h"
#include "TH3F.h"
#include "THStack.h"
#include "THistPainter.h"

using namespace std;

void e143_comparison()
   {
	TH2 *h1vt_410MHz_07m01d22h_10ms = new TH2F("h1vt_410MHz_07m01d22h_10ms","410Mhz 07.01.22h Additiion (10 ms res);frequency (Hz);time (s)",256,4.06704e+08,4.06753e+08,200,0,2);
	int nframes = 200;
	vector<TFile*> tf_frames;
	vector<TH1*> h1_frames(nframes,NULL);
	char chname[300];
	for(int i=0; i<nframes; i++)
	   {
		sprintf(chname,"E143_Results/410MHz-07.01.22h_s%.2f_t0.01.root",i*0.01);
		//cout << chname << endl;
		tf_frames.push_back(new TFile(chname));
		tf_frames[i]->GetObject("th1f",h1_frames[i]);
		for(long j=0; j<256; j++)
		   {
			h1vt_410MHz_07m01d22h_10ms->SetBinContent(j+1, i+1, h1_frames[i]->GetBinContent(j));
		   }
	   }
	cout << "Total Bins: " << h1_frames[100]->GetNbinsX() << ", Xlow: " << h1_frames[100]->GetBinCenter(1) << ", Xhigh: " << h1_frames[100]->GetBinCenter(h1_frames[100]->GetNbinsX()) << endl;

	TCanvas *c1 = new TCanvas("c1","c1",50,50,1000,800);
	h1vt_410MHz_07m01d22h_10ms->Draw("COLZ");

   	TFile *fhists = new TFile("e143_added_th2s.root","RECREATE");
	h1vt_410MHz_07m01d22h_10ms->Write();
	cout << "Written h1vt_410MHz_07m01d22h_10ms to file." << endl;
	fhists->Close();
   }


int main ()
   {
	e143_comparison();

	return 0;
   }
|
| Attachment 3: 410MHz-07.01.22h-sum_20ms.png
|
|
|
197
|
Fri Jul 2 04:58:39 2021 |
IK, Kanika | DAQ | NTCAP status |
The latest recorded tdms files:
 p:\E143\sc\SC_2021-06-30_23-27-45\0000405
 p:\E143\iq\IQ_2021-06-30_23-27-34\0001978
2. The rest space on the drive "p:\" : 27.1TByte |
|
196
|
Fri Jul 2 04:27:38 2021 |
The remote Canadian beavers (Iris and Guy) | Analysis | Summary of spectra 0:00-4:00 (410 MHz) |
Same as before for 0-4h on July 2nd.

> Same as before, for 0-1h on July 2nd
>
>
> > The last hour before the gas bottle change is summarized here.
> > The first pic shows the 410 MHz spectra taken from 22-23h on the 410 MHz analyzer, in time slices of 0.1 sec from 0s-2s.
> > The second pic shows the spectra in 20ms slices from 1s-1.16s.
> >
> > python3 e143_analyzer.py -s 1.0 -t 0.02 /home/dillmann/.../sparc-daq-02.gsi.de/E143-410MHz/410MHz-2021.07.01.22*
> >
> > The third spectra was taken in May, for comparison.
> >
> > I don't think we see anything... |
| Attachment 1: July2-0-4h-410MHz_Spectra_0.02s_steps_start_1s.png
|

|
|
195
|
Fri Jul 2 03:19:49 2021 |
IK, KK | Runs | drop of intensity |
And the intensity is back again to 5E9 at 03:20 |