| ID |
Date |
Author |
Category |
Subject |
|
30
|
Fri Jun 20 15:58:21 2025 |
Wilfried, Konstantin, Simon | Laser | Laser stepwidth |
From previous Bi-Beamtimes, we expect the width of the transition to be >50GHz (FWHM). The current step width is 0.002nm which corresponds to 8GHz, so the laser would be in resonance for 6 steps.
We should aim for at least 5 steps in resonance.
|
line width (sigma) | >20GHz
| |
FWHM | ~50GHz
| |
step width (fundamental) | 0.004nm (4GHz)
| |
step width (doubled) | 0.002nm (8GHz)
|
|
|
31
|
Sat Jun 21 00:23:22 2025 |
Rodolfo | Laser | Dye |
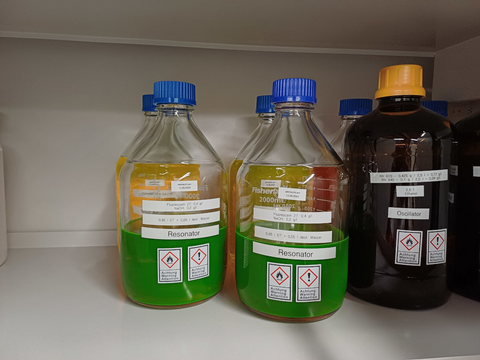
I have prepared new (fresh) dye solutions of Fluorescein 27: 2 charges. They are in the Safety Cabinet (Sicherheitsschrank) in the ESR Laser lab |
| Attachment 1: Farbstoff_FL27.jpg
|
|
|
34
|
Sat Jun 21 02:32:24 2025 |
Alex, Anton, Rodolfo, Hiroshi, Carsten | Laser | Laser scanning setting |
This is the initial scanning range
- 3 Loops
- 501 Steps
- 15 Shots / Step
- From 550.4 nm to 547.9 nm. In total 2.5 nm @ 0.005 nm
Test file on DAQ2 is 0132.lmd / 0133.lmd |
|
35
|
Sat Jun 21 03:06:19 2025 |
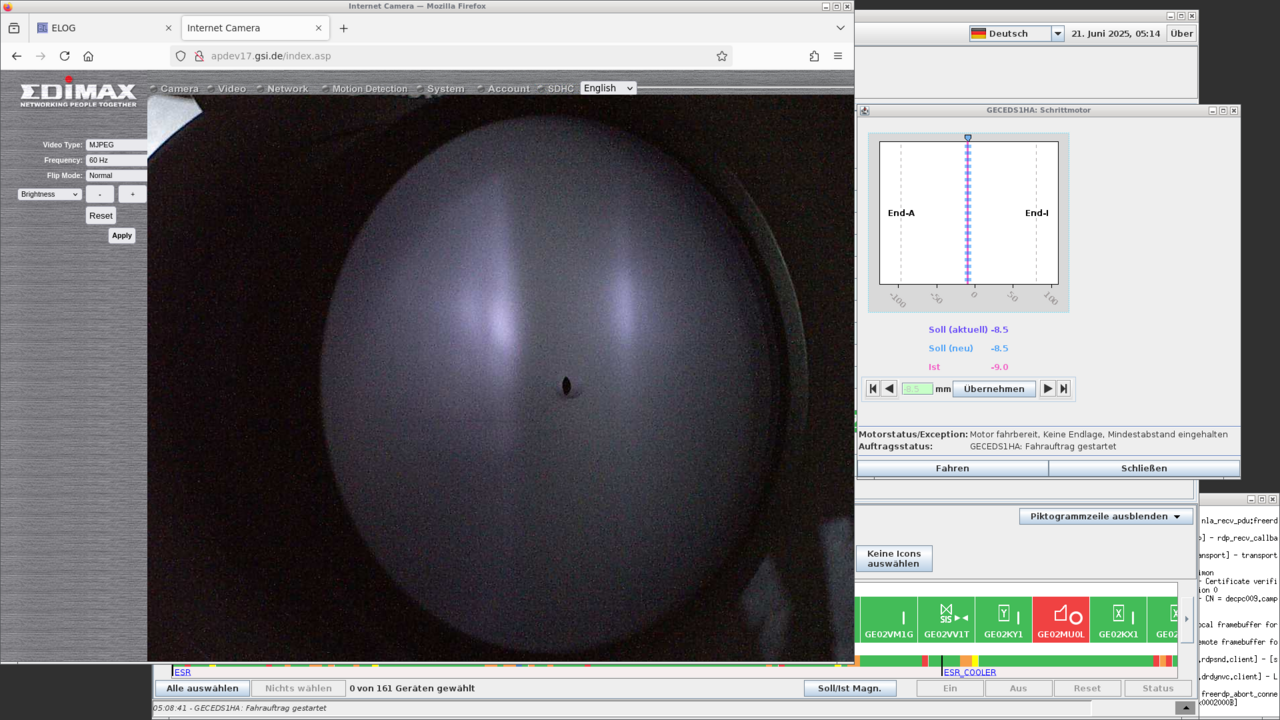
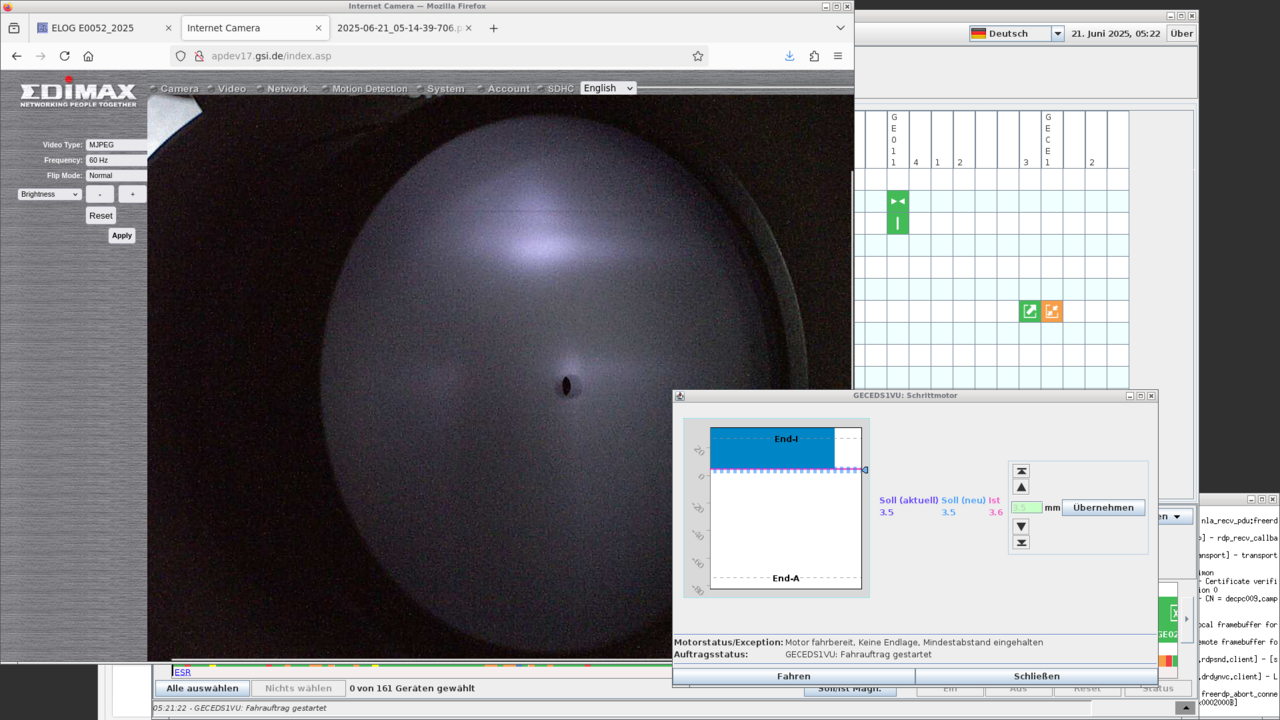
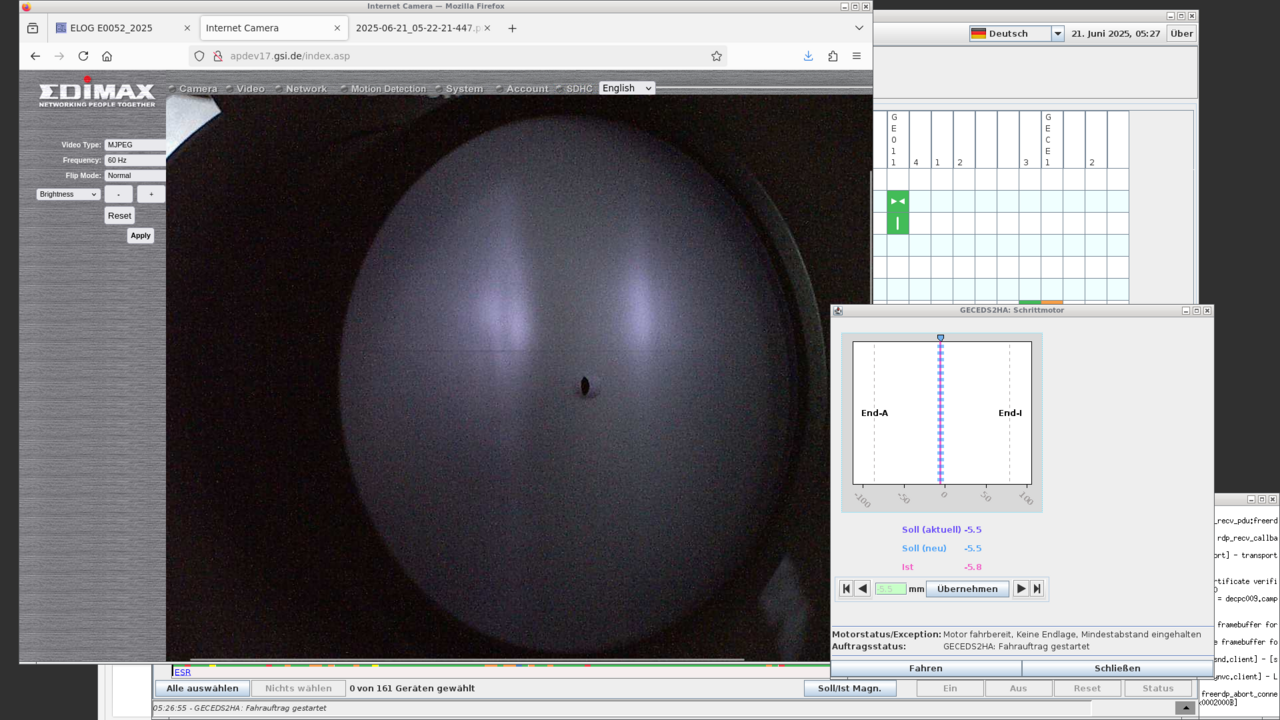
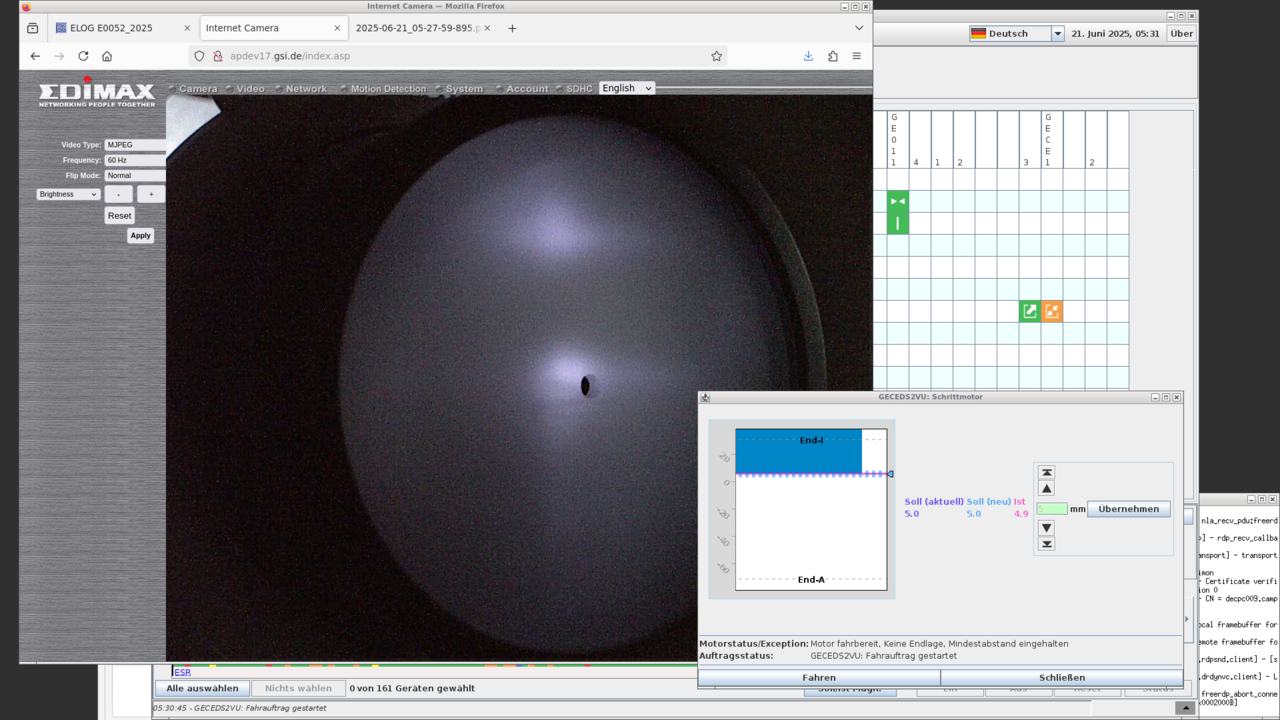
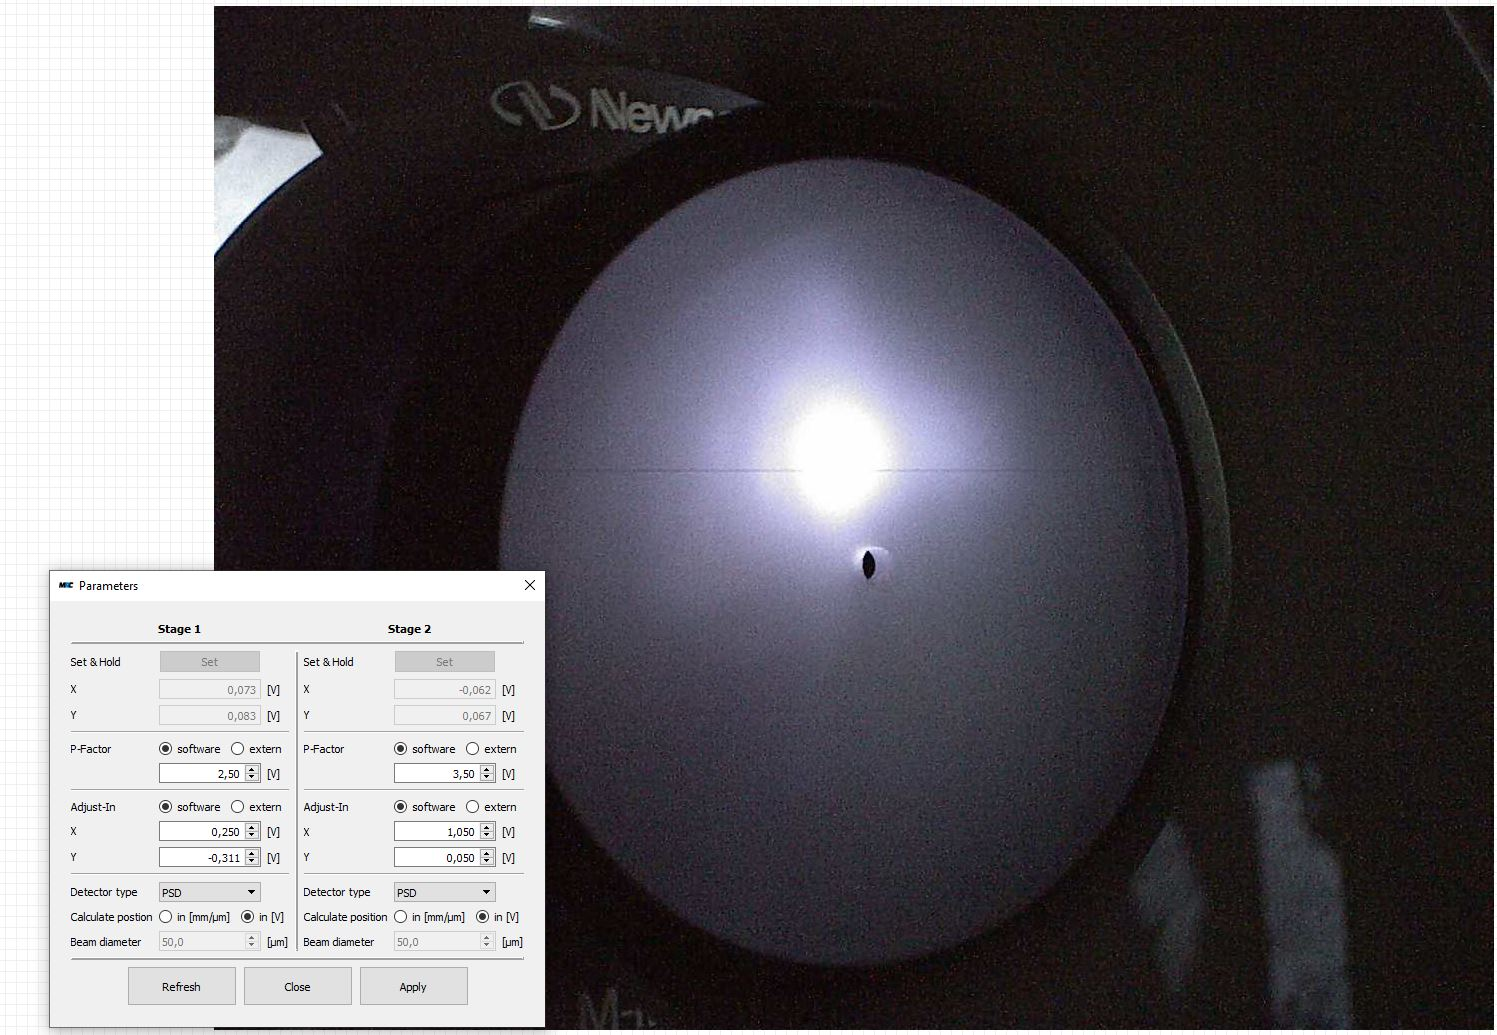
Rodolfo, Alex, Hiroshi, Anton | Laser | beam overlap with t-scrapers |
|
motor | ion beam position (mm) from outside | ion beam position (mm) from inside
| |
GECEDS1VU | -0,5 | -
| |
GECEDS1HA | -13,0 | -4,5
| |
GECEDS2VU | 1,0 | -
| |
GECEDS2HA | -10,5 | -0,5
|
Note: To move GECEDS1VU the corresponding horizontal drive (GECEDS1HA) has to be at -4,0 mm.
Note: To move GECEDS2VU the corresponding horizontal drive (GECEDS2HA) has to be at 2,0 mm.
GECEDS1VU (from E.outside -74.0): -1,0 (start scraping)
-0,5 (ion beam disappear)
GECEDS1VU-End.I (24,8)
GECEDS1HA (from E.outside -96,2): -13,0 (ion beam disappear)
GECEDS1HA (from E.inside -79,5): -4,5 (ion beam disappear)
GECEDS1HA (-4,0): no interlock for GECEDS1VU => drive out to End-A
GECEDS2VU (from E.outside -70.7): 1,0 (ion beam disappear)
GECEDS1VU-End.I (30,4)
GECEDS2HA (from E.outside -86,4): -10,5 (ion beam disappear)
GECEDS2HA (from E.inside 78,6): -0,5(ion beam disappear) |
| Attachment 1: 2025-06-21_05-14-39-706.png
|
|
| Attachment 2: 2025-06-21_05-22-21-447.png
|
|
| Attachment 3: 2025-06-21_05-27-59-895.png
|
|
| Attachment 4: 2025-06-21_05-31-37-019.png
|
|
| Attachment 5: MRC-settings_Th-Beam_2025-06-21.JPG
|
|
|
37
|
Sat Jun 21 07:28:35 2025 |
Arya, Julien, Wilfried | Laser | Laser Timing |
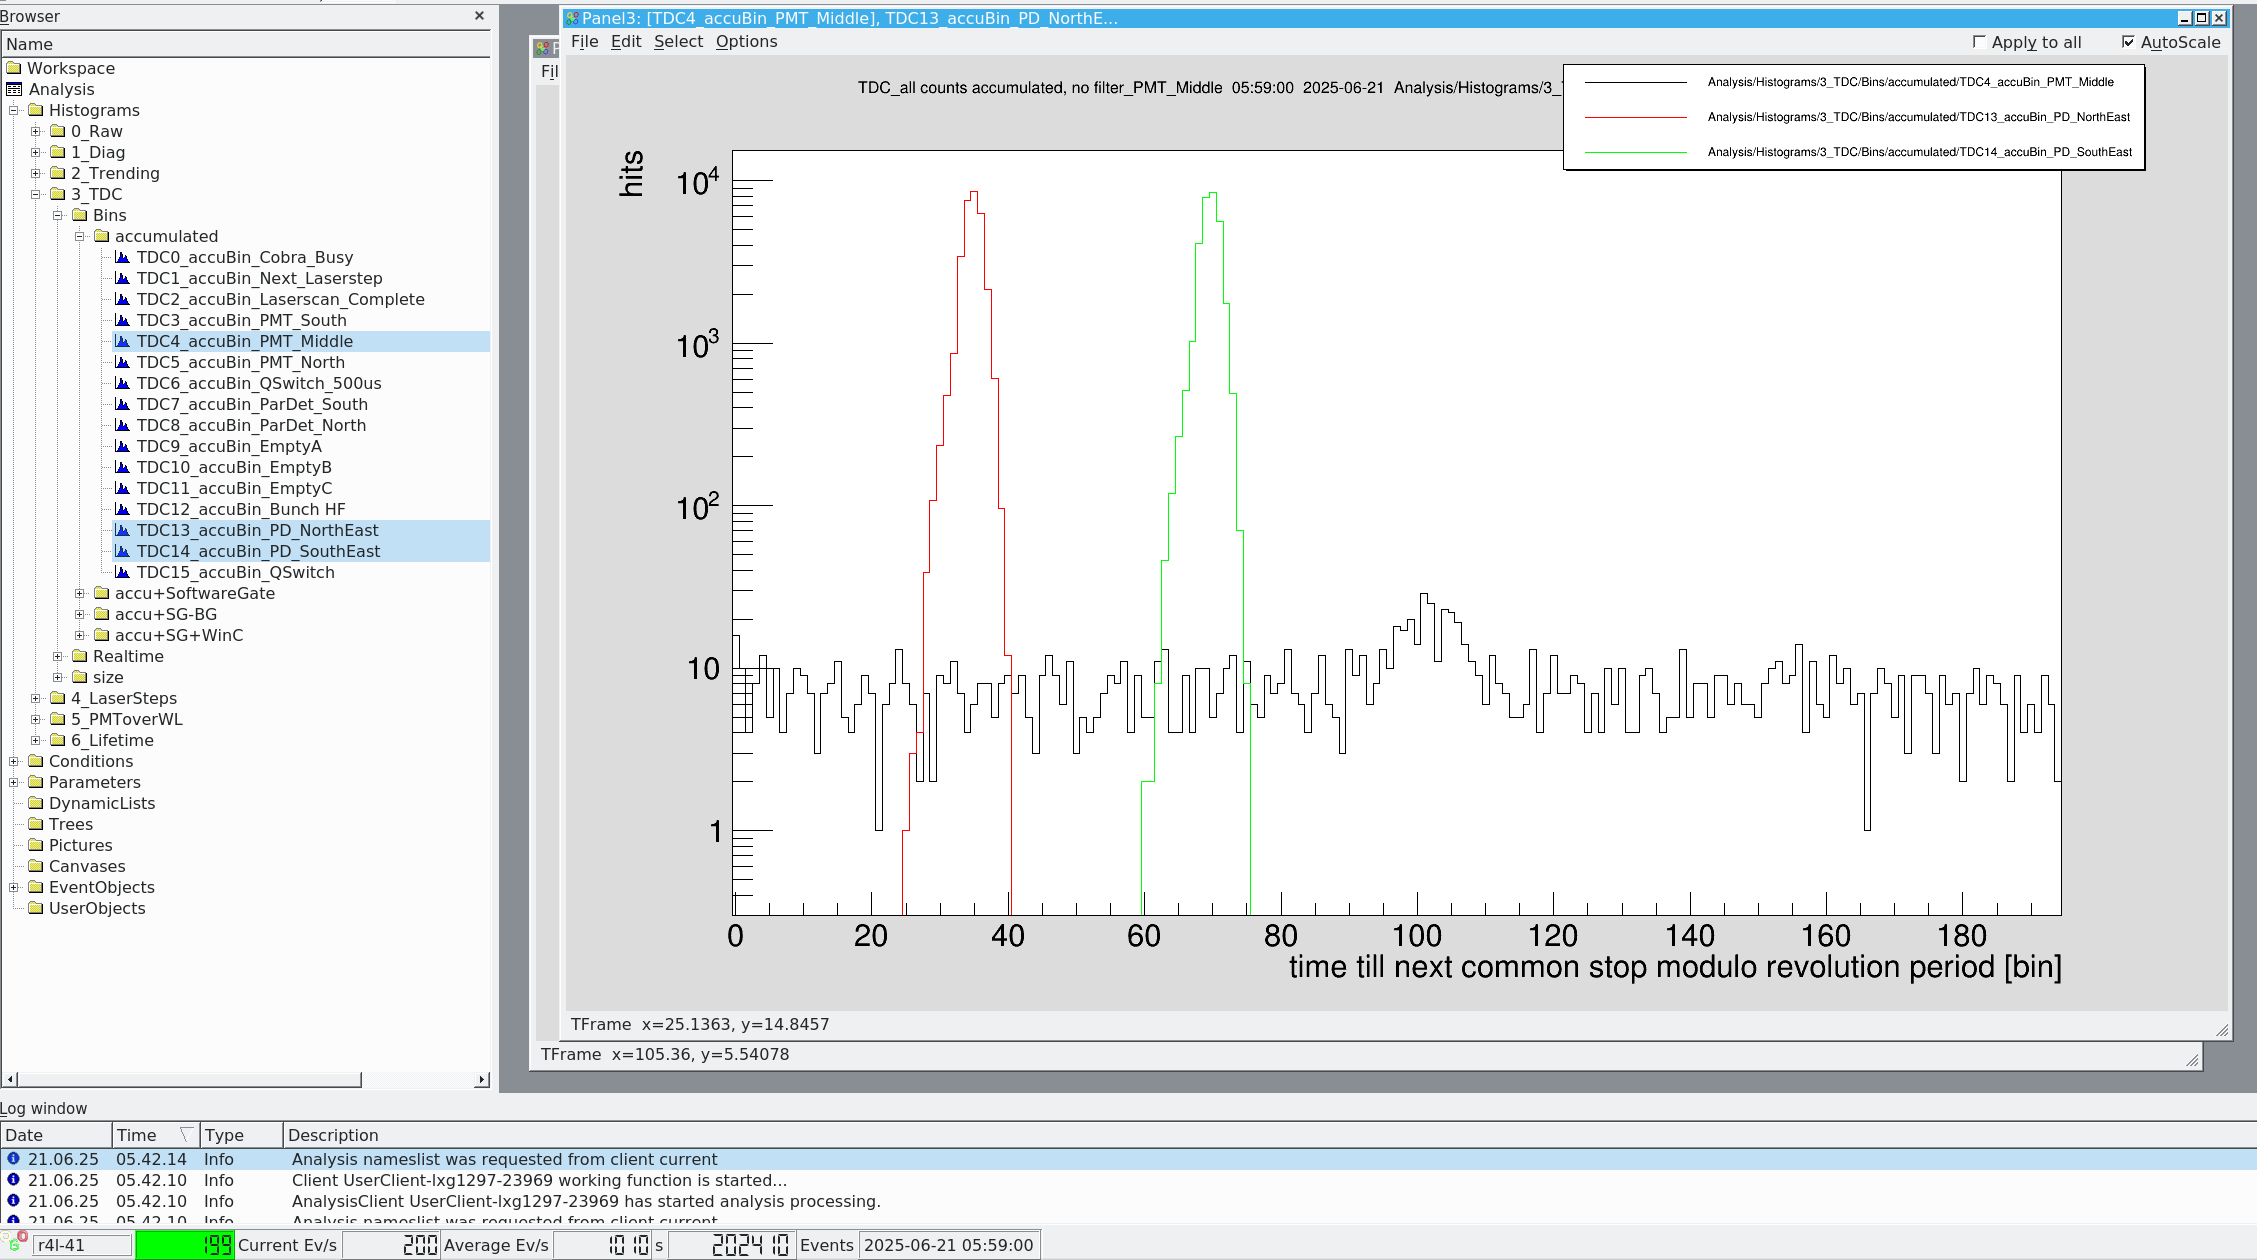
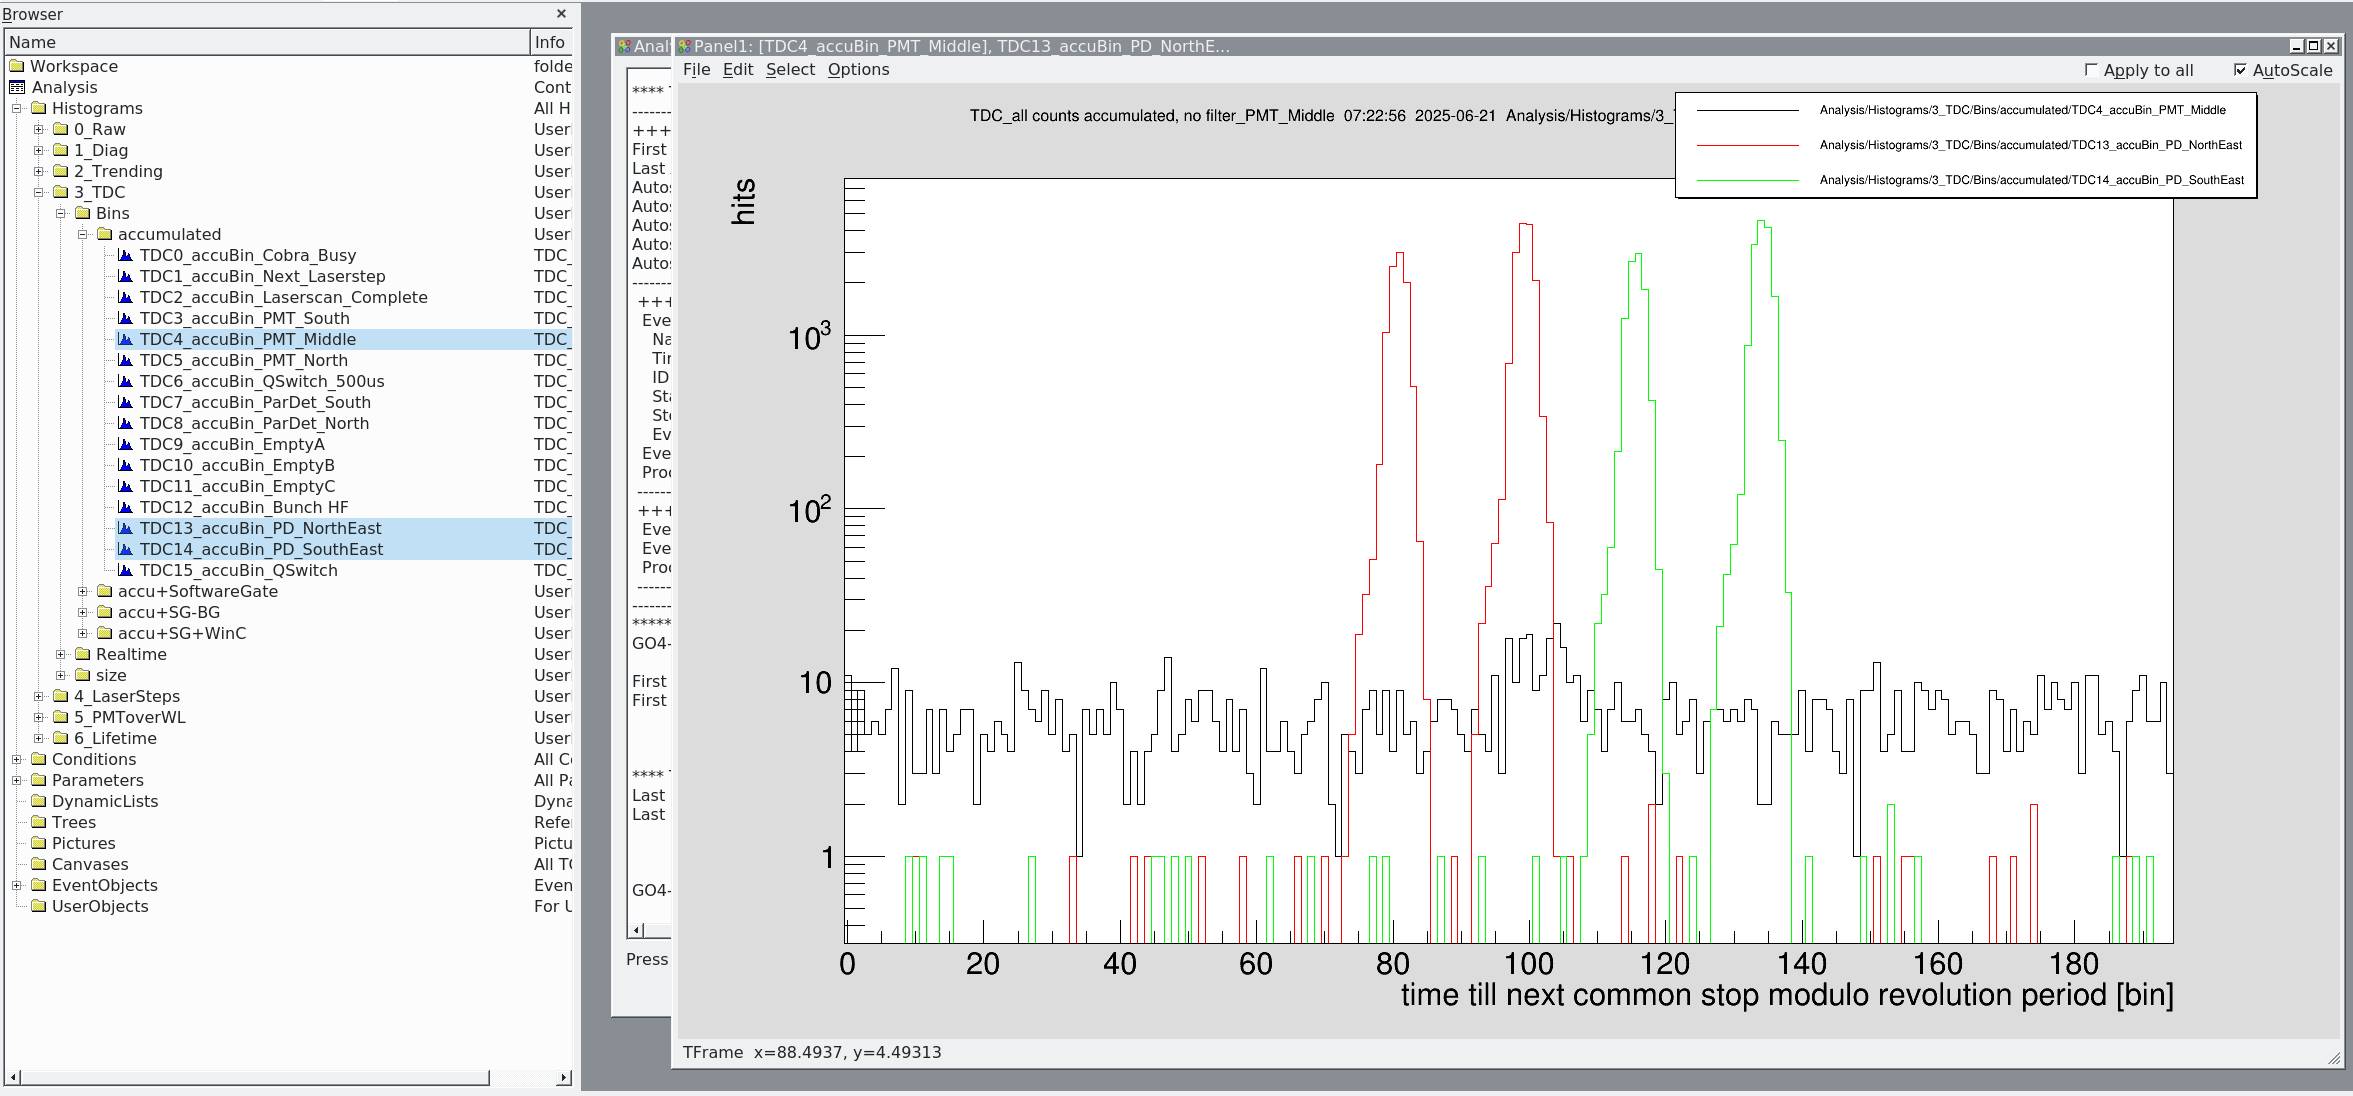
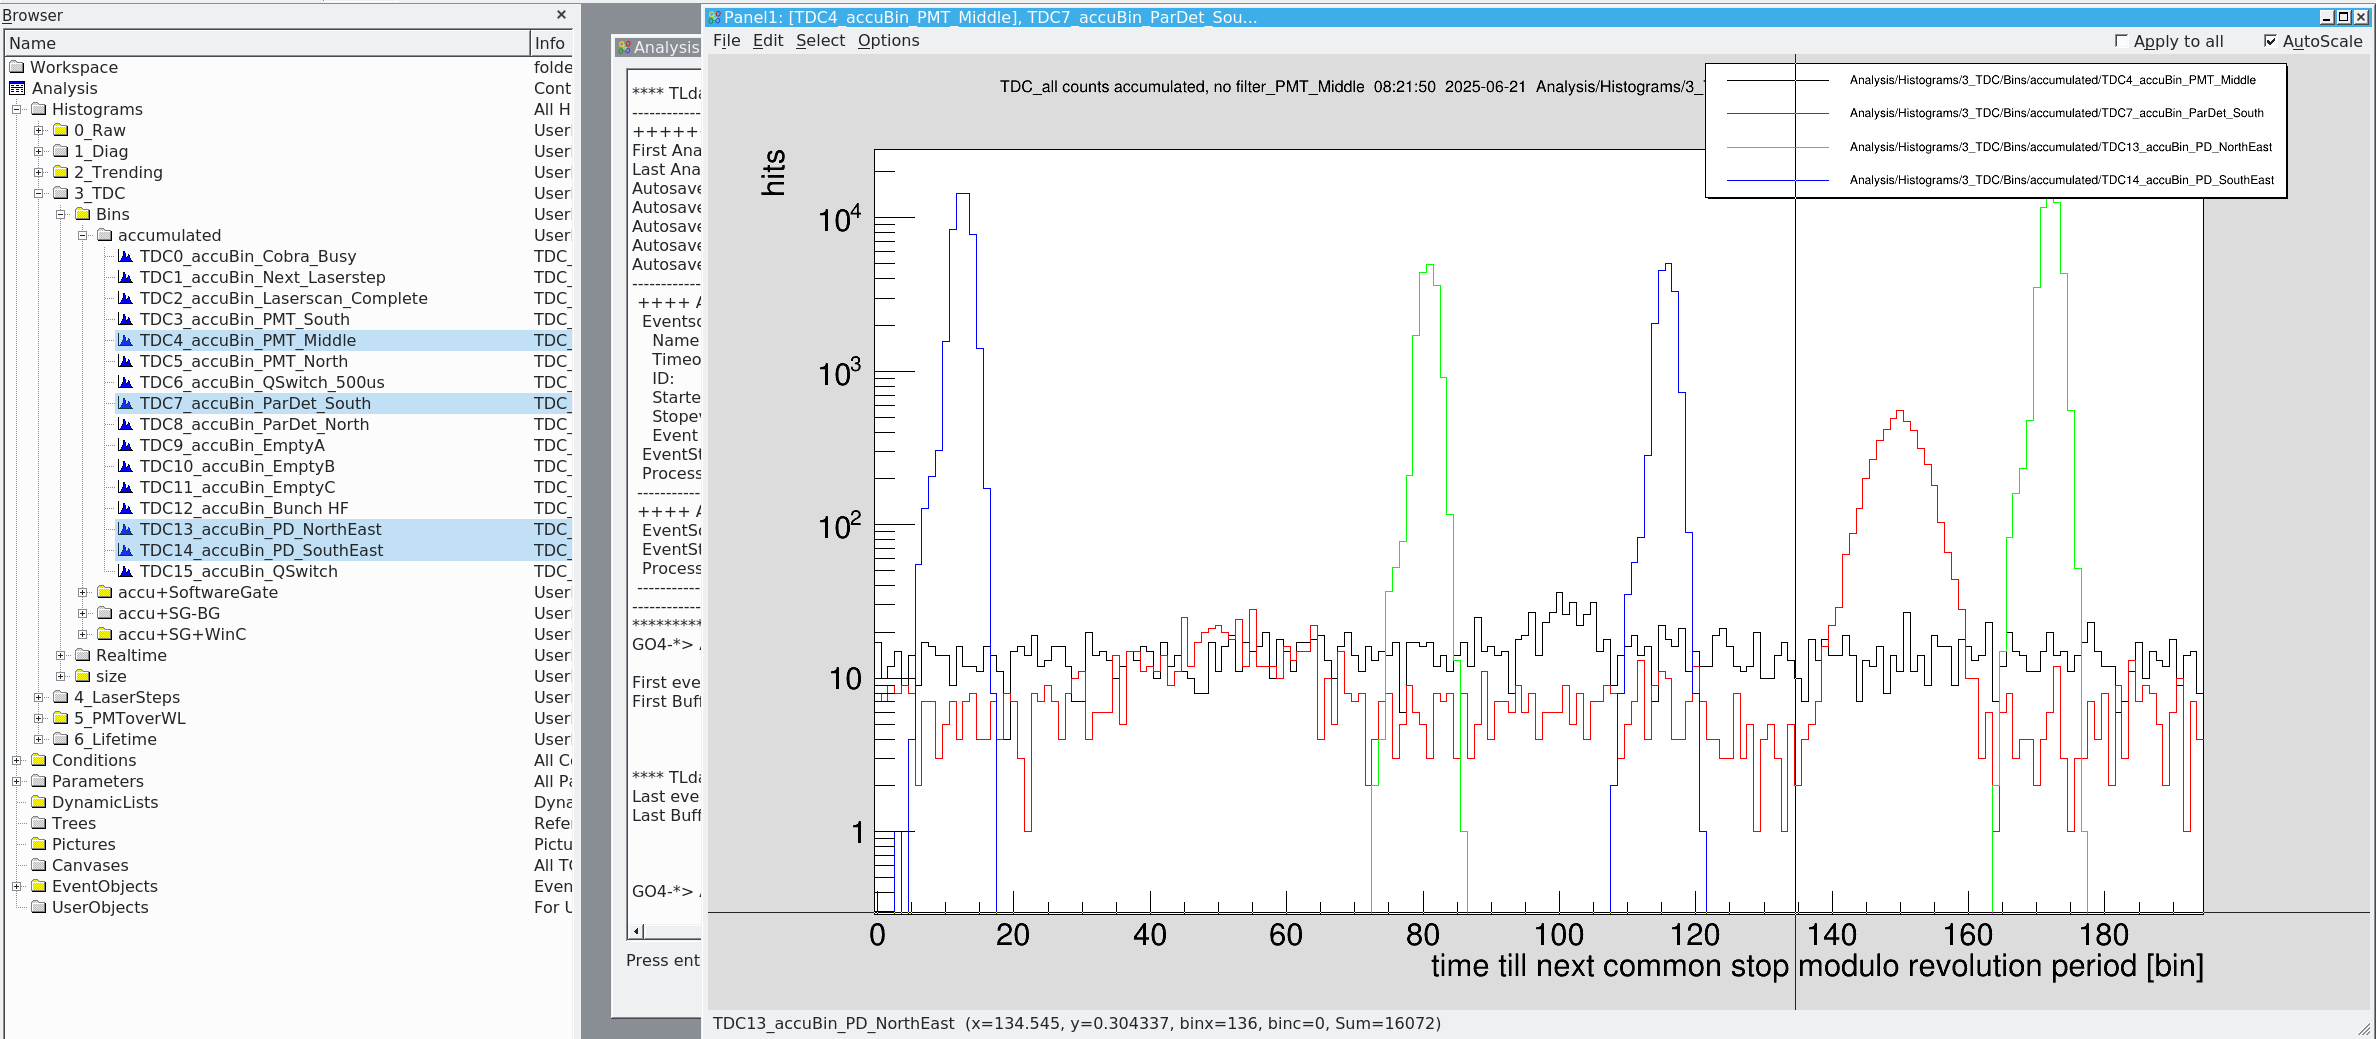
We roughly adjusted the timing based on attachment 1, for ions to be in center of electron cooler (east arc), corrected for PMTs being 2.5m closer to the north on the west arc
then did a new 30 injection accumulation (10.8k counts on particle detector) and readjusted the timing to fine tune this
(attachment 2, first settings right peaks, adjusted towards left)

Then we did a 60 injection accumulation (only 7.6k counts?) to check the settings and shift the timing by half a revolution (324 ns = 98 bins)
(attachment 3, data saved in /data.local2/2025_229Th/2025_229ThDAQ1_0099.lmd with DAQ1).

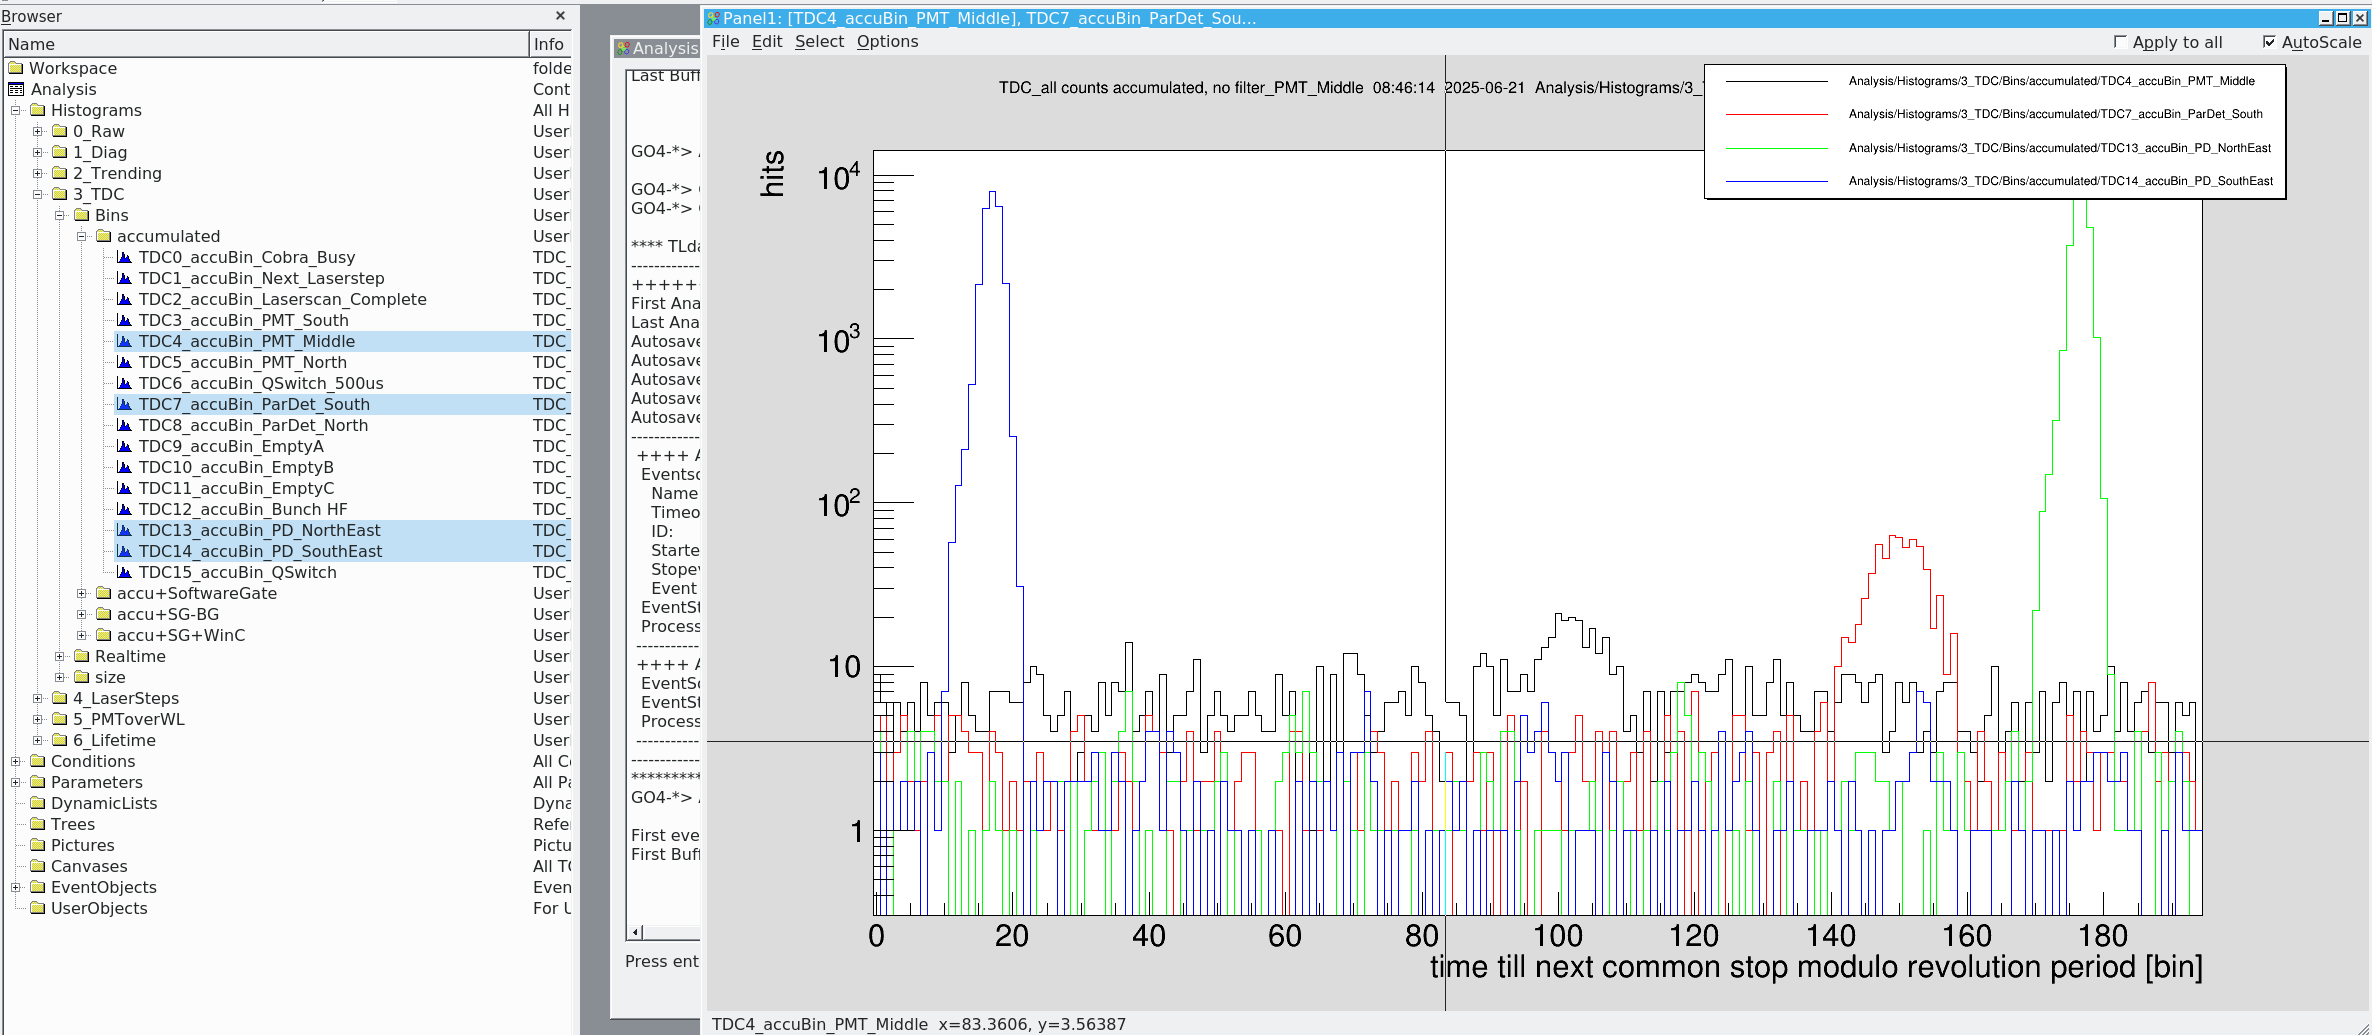
Checked these settings and particle counts with another injection (2.8k counts)
(attachment 4, data saved in /data.local2/2025_229Th/2025_229ThDAQ1_0100.lmd with DAQ1)


Estimated bunch width: 20bins = 67ns;corresponds to 20/200 of 1 evolution, so about 12m
assuming v+0.5c0: 11m |
| Attachment 1: Bildschirmfoto_IonBunch_PDs_2025-06-21.png
|
|
| Attachment 2: Bildschirmfoto_rough_timing_2025-06-21_07-22-59.png
|
|
| Attachment 3: Bildschirmfoto_timingcorrected_2025-06-21_08-21-53.png
|
|
| Attachment 4: Bildschirmfoto_timing_final_2025-06-21_08-46-18.png
|
|
|
51
|
Mon Jun 23 10:52:34 2025 |
Julian, Lukas, Zsolt, Nadine, Konstantin | Laser | Frequency conversion unit |
We exchanged the old BBO of the Cobra's FCU with a new one. The output power of the Cobra was around 120mJ. In the end, we achieved a UV power of about 21mJ. In addition, we optimized the fiber-coupling to the wavemeter. |
|
60
|
Wed Jun 25 05:53:54 2025 |
Rodolfo | Laser | FCU |
Cobra's FCU was recalibrated. Table saved as FCU_547-554_RS_2024-06-25.fcu. |
|
66
|
Fri Jun 27 06:55:45 2025 |
Esther. Konstantin | Laser | Laser-ion overlap |
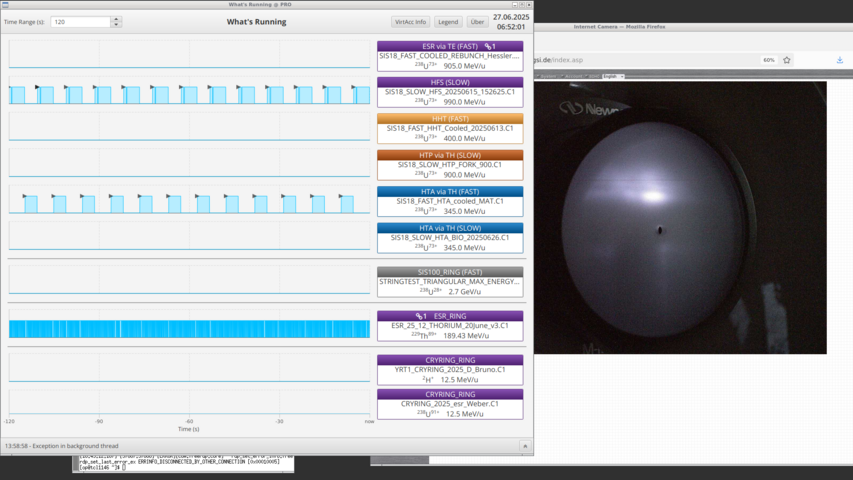
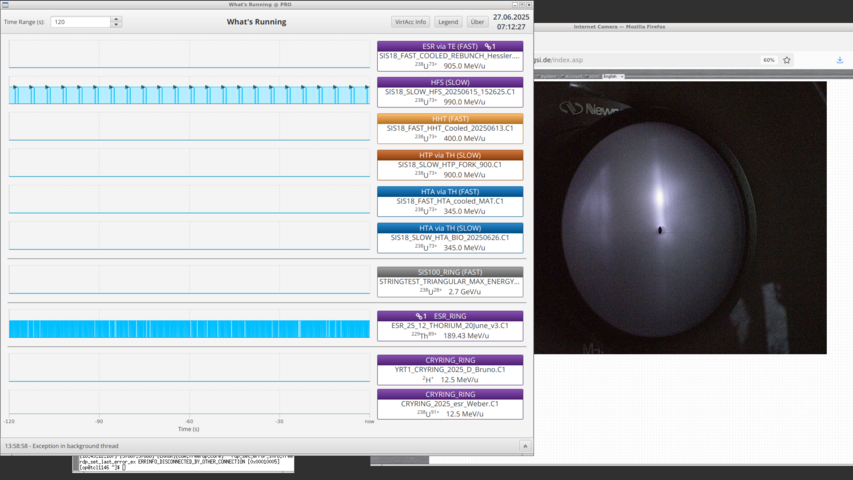
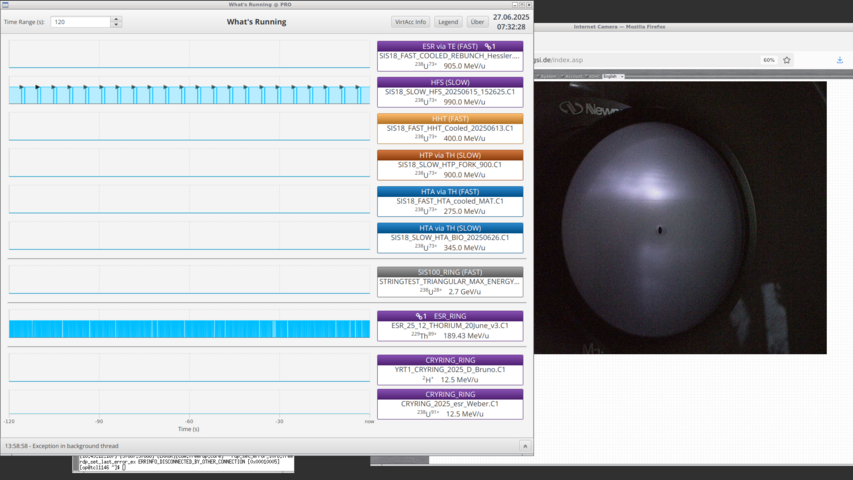
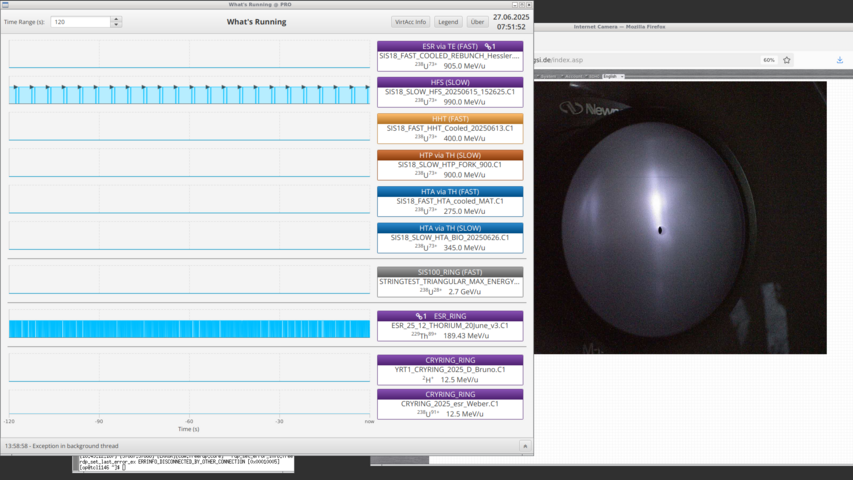
We cross-checked the laser-ion superposition by using the T-scrapers. We did it only after the scans in order to do not change the duty cycle by much. Attachements are in the order of the measurements compiled in the table.
|
motor | ion beam position (mm) from inside | |
GECEDS1VU | -0,5 | |
GECEDS1HA | -4 | |
GECEDS2VU | 0.9 | | |
GECEDS2VU | 0 |
|
Still looks fine to us. |
| Attachment 1: 2025-06-27_06-52-01-807.png
|
|
| Attachment 2: 2025-06-27_07-12-27-135.png
|
|
| Attachment 3: 2025-06-27_07-32-28-599.png
|
|
| Attachment 4: 2025-06-27_07-51-52-620.png
|
|
|
39
|
Sat Jun 21 11:42:50 2025 |
Arya, Julien, Wilfried | General | Test laser scan |
Test scan to see whether laser spot is moving while scanning

Aborted accumulation because SIS stopped. 12.9k counts
saved as /data.local2/2025_229Th/2025_229ThDAQ1_0103.lmd using DAC1 only

We filmed it and will try to attach it later
1. After resetting to high wavelength, the MRC stabilization takes a bit longer to adjust, beam not centered for the first 1-2s
2. During the scan the beam does not seem to jump around more than usual, but there might be a minimal wavelength dependent drift (maybe 1/3 of laser beam diameter towards bottom right over entire scan range) |
|
44
|
Sun Jun 22 11:31:59 2025 |
Arya, Carsten, Julien, Konstantin | General | Summary morning shift |
1. UNILAC running again, so we resumed the beam tuning wherre we stopped yesterday at 14:00

2. Goals: Reduce intensity and lifetime of "antibunch" contamination while maximising intensity for main bunch/on PD
   Adjusted bucketsize, el. cooler current, cooling times,..
   Managed to get bunch width to 6-8 bins and get 10k counts in 15 mins with only 20 injections
   but el. cooling still takes long and sometimes bunch phase jumps by 90° in "measurement manipulation"

4. Checked scan range again and found small discrepancy

3. Decided to switch el. cooler voltage (1st cooling) by +100V,
   ion beam position in el. cooler should not be afected by this too much, at the scrapers at which the dispersion is maximal it shifted the beam by 5mm

new revolution frequency: 1.54315 GHz
new electron cooler voltage: 104506 V(+95 V; slightly adjusted to match revolution frequency
"antibunch" vanishes within first 10s
bunch on PD wider, but might be missmatch of HF and cooler voltage |
|
1
|
Tue May 20 16:14:30 2025 |
Rodolfo, Simon | Detectors | PMT arrangement at ESR |
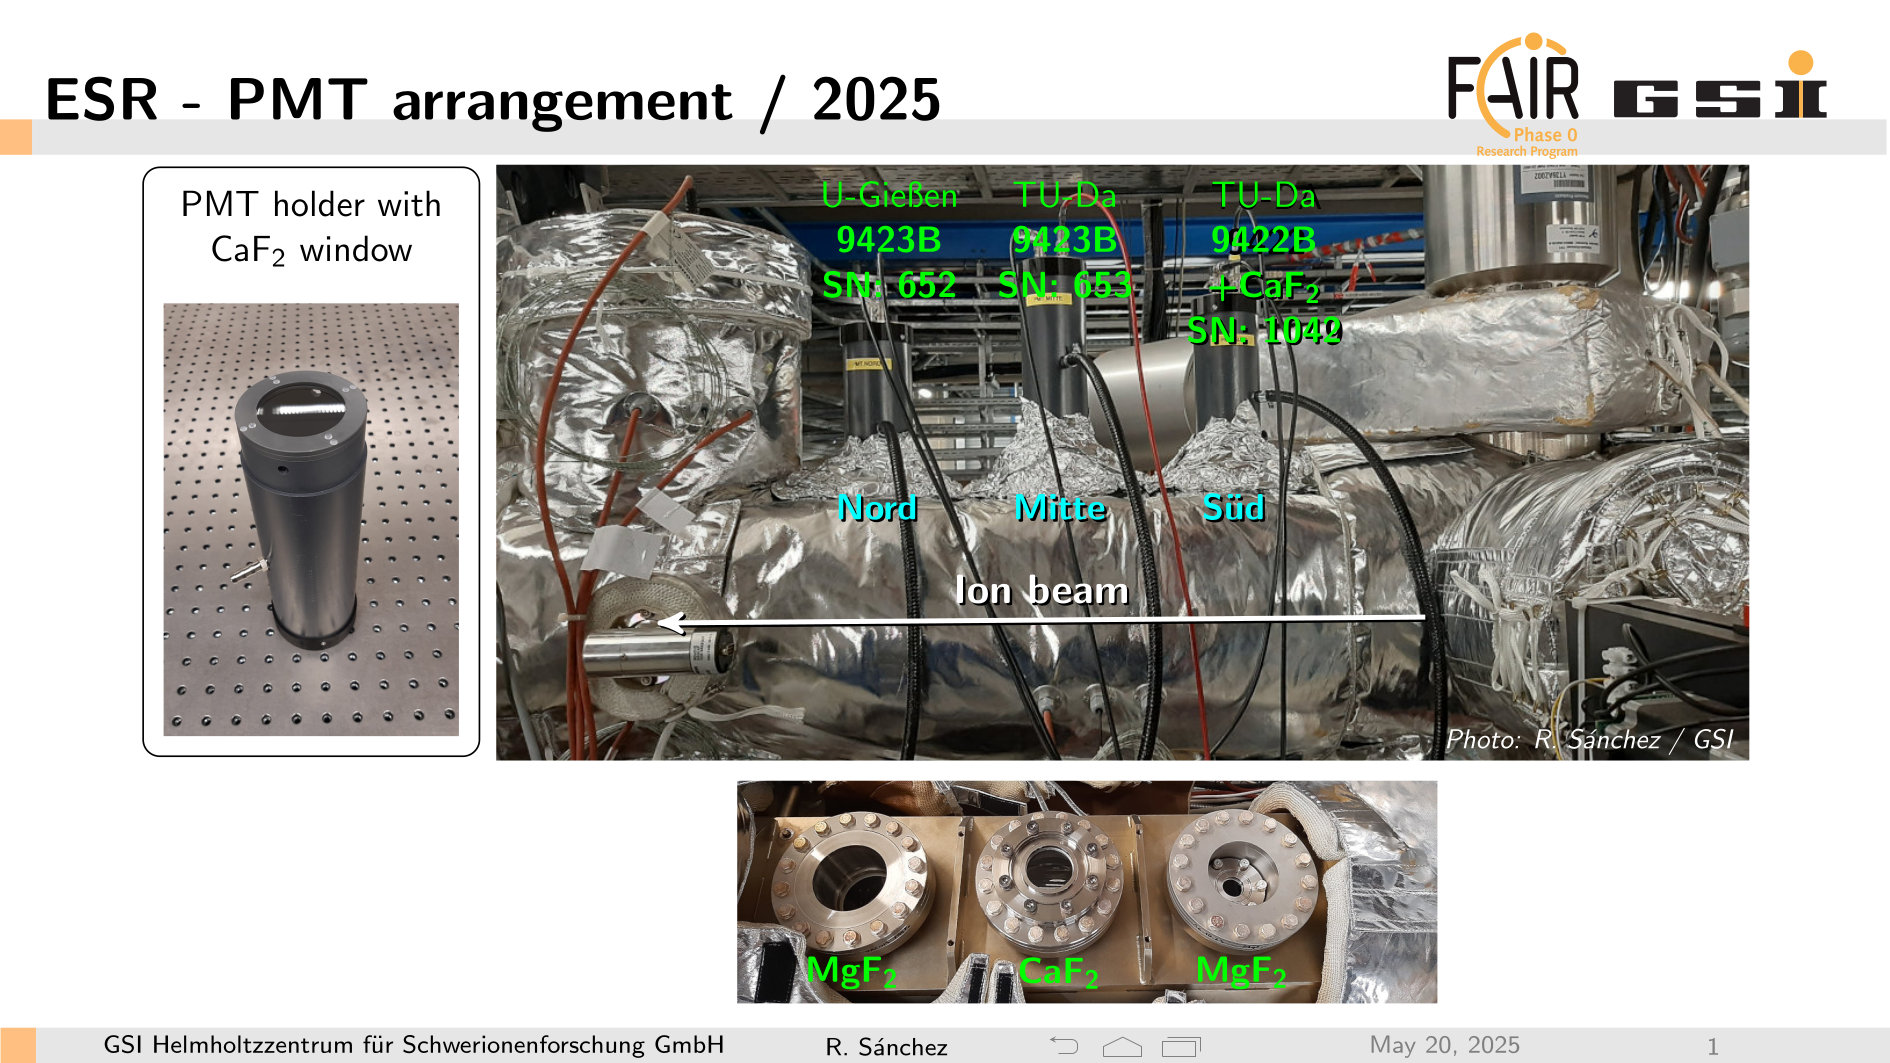
This is the arrangement of the photomultipiers at the optical detection region at ESR for Thorium 2025
|
PMT | Model | SN | | Operation Voltage | Threshold
| |
South | ET9422B | 1042 | Broadband | -1500 V |
| |
Middle | ET9423B | 653 | Smallband | -2650 V | 10 (preliminary)
| |
North | ET9423B | 652 | Smallband | -2650 V | 12 (preliminary)
| |
|
|
| Attachment 1: PMT_Arrangement_2025-05-20.jpg
|
|
|
2
|
Mon Jun 2 16:36:57 2025 |
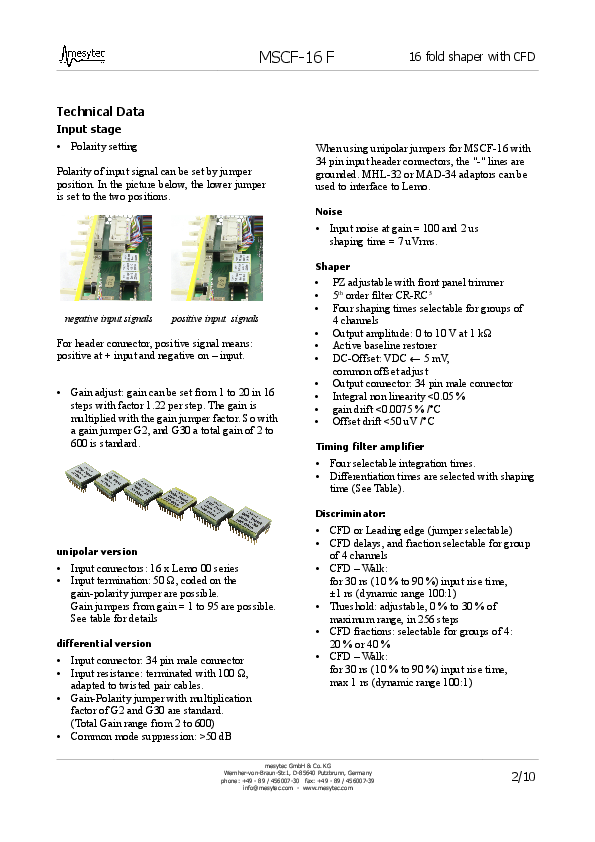
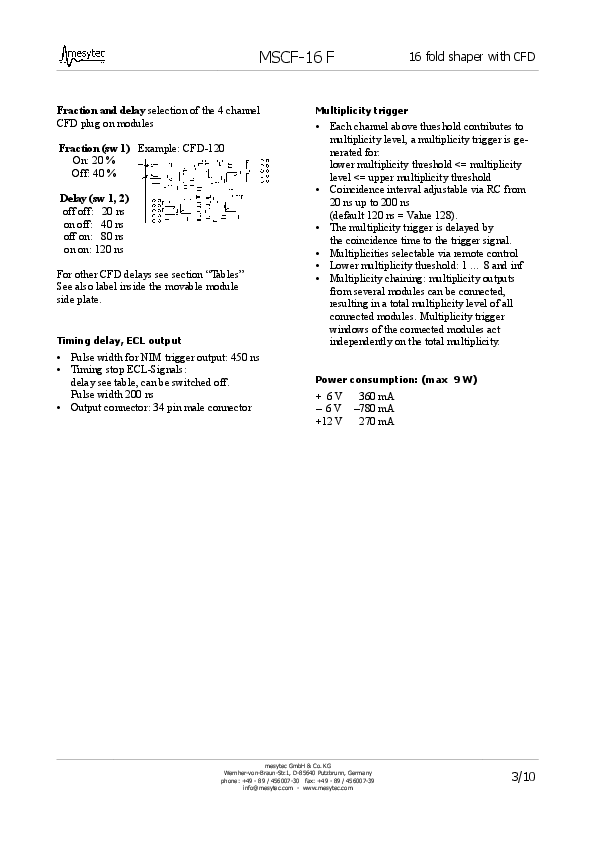
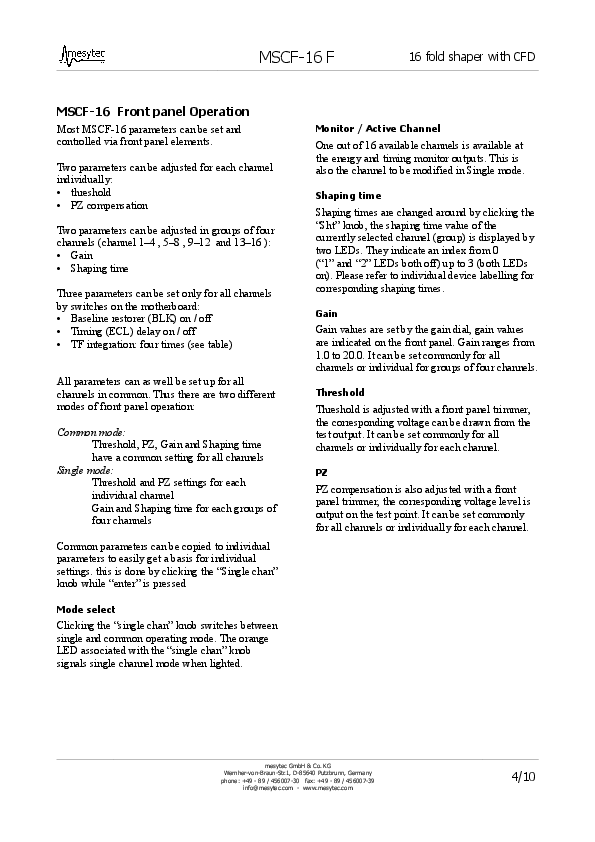
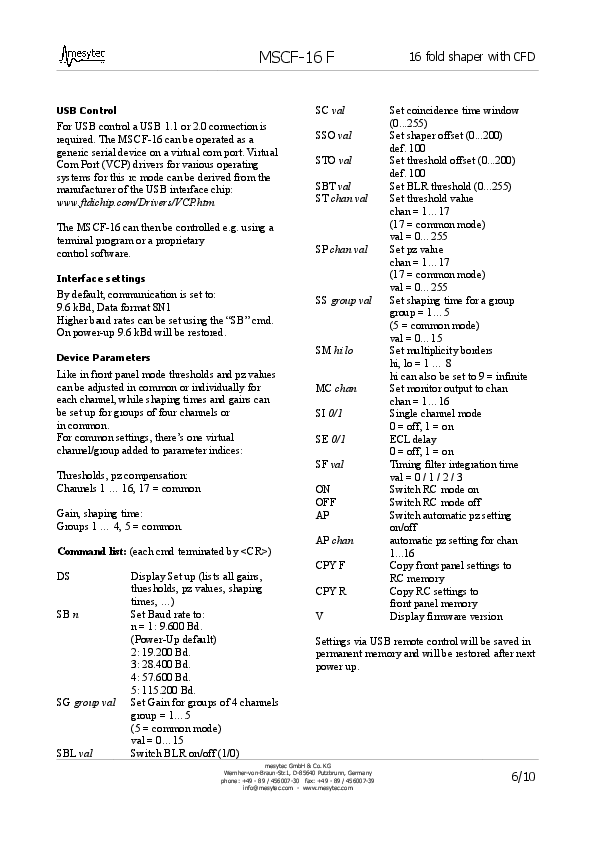
Carsten | Detectors | Mesycontrol |
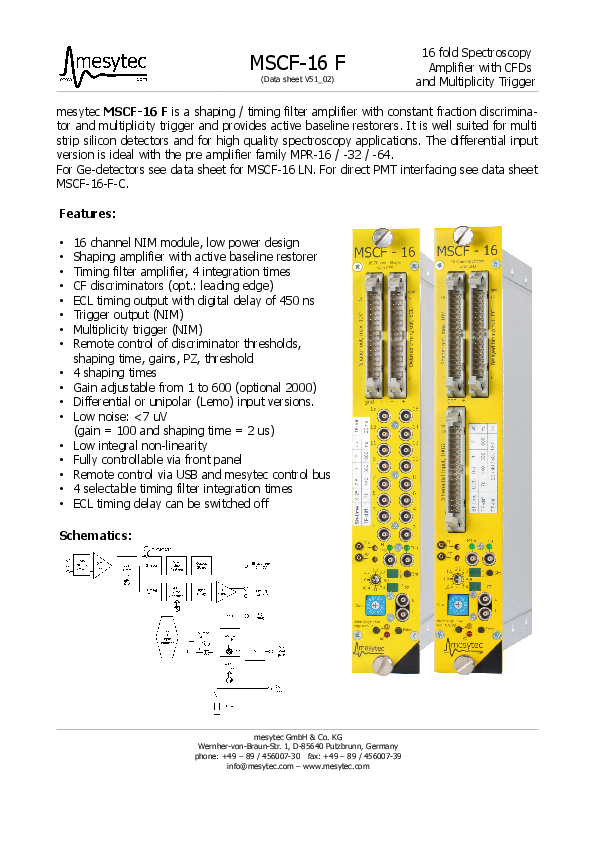
ssh -Y litv-exp@x86l-204
'mesycontrol' |
| Attachment 1: MSCF16-F-V.pdf
|

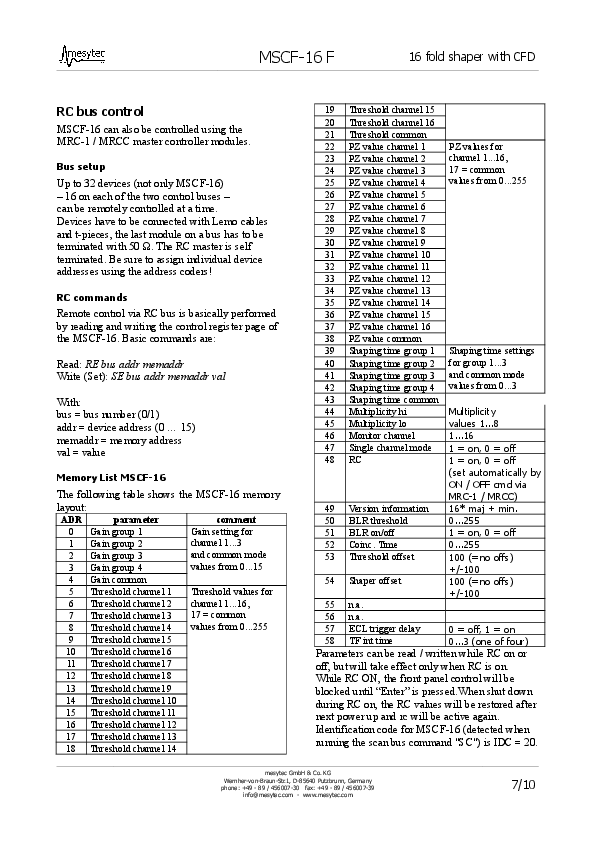
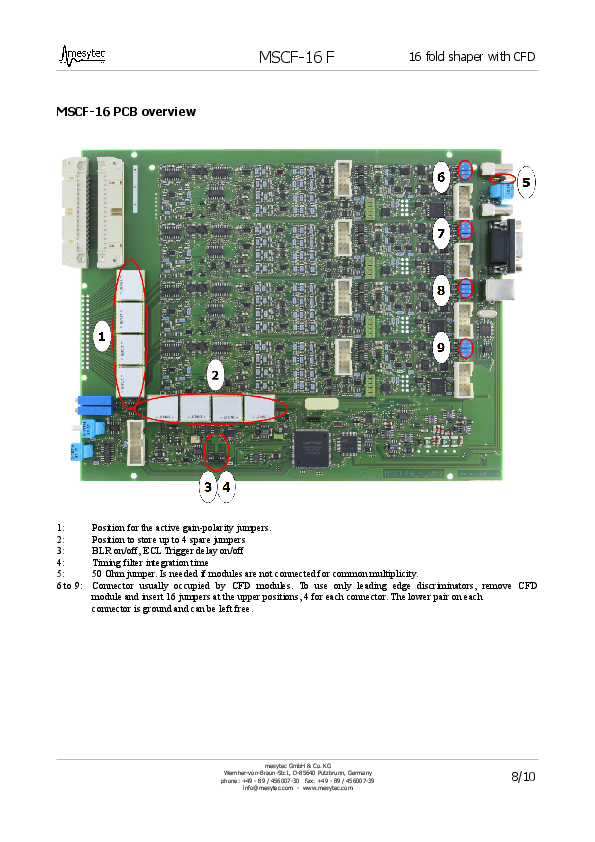
|
|
3
|
Wed Jun 4 16:17:47 2025 |
Simon | Detectors | Nitrogen |
| The nitrogen supply for the PMTs is turned ON. |
|
4
|
Wed Jun 4 16:18:57 2025 |
Rodolfo, Simon | Detectors | PMT dark count rates |
I adjusted the offsets of the amplifiers in the cave and measured the dark count rates :
|
PMT | Model | | Operation Voltage | Count rate (Hz)
| |
South | ET9422B | Broadband | -1500 V | 1300
| |
Middle | ET9423B | Smallband | -2650 V | 20
| |
North | ET9423B | Smallband | -2650 V | 30
|
Also the MCP anode of the XUV detector is now connected to the amplifiers and fed to the data cable of "PMT Cu".
| Quote: | This is the arrangement of the photomultipiers at the optical detection region at ESR for Thorium 2025
|
PMT | Model | SN | | Operation Voltage | Threshold
| |
South | ET9422B | 1042 | Broadband | -1500 V |
| |
Middle | ET9423B | 653 | Smallband | -2650 V | 10 (preliminary)
| |
North | ET9423B | 652 | Smallband | -2650 V | 12 (preliminary)
| |
|
|
|
|
7
|
Wed Jun 11 16:44:39 2025 |
Carsten, Jan | Detectors | Detector voltages and thresholds for DAQ2 (Mesycontrol) |
Voltages (2650v) for the small band 9423 is ok. Signals are nicely separated from background, thresholds can be easily set.
For the broadband 9422 the voltage is by far too low. Signals and BG are barely separated.
Increased voltage from 1500V to 1750V (according to datasheet Vmax = 2500V, 1500 V is the min voltage for gain 1e6...).
Now signals are better separated - threshold with mesycontrol can be set in such a way that the dark count rate is 300 - 400 Hz (was > 1kHz).
For detector south, the threshold in DAQ1 has to be readjusted.
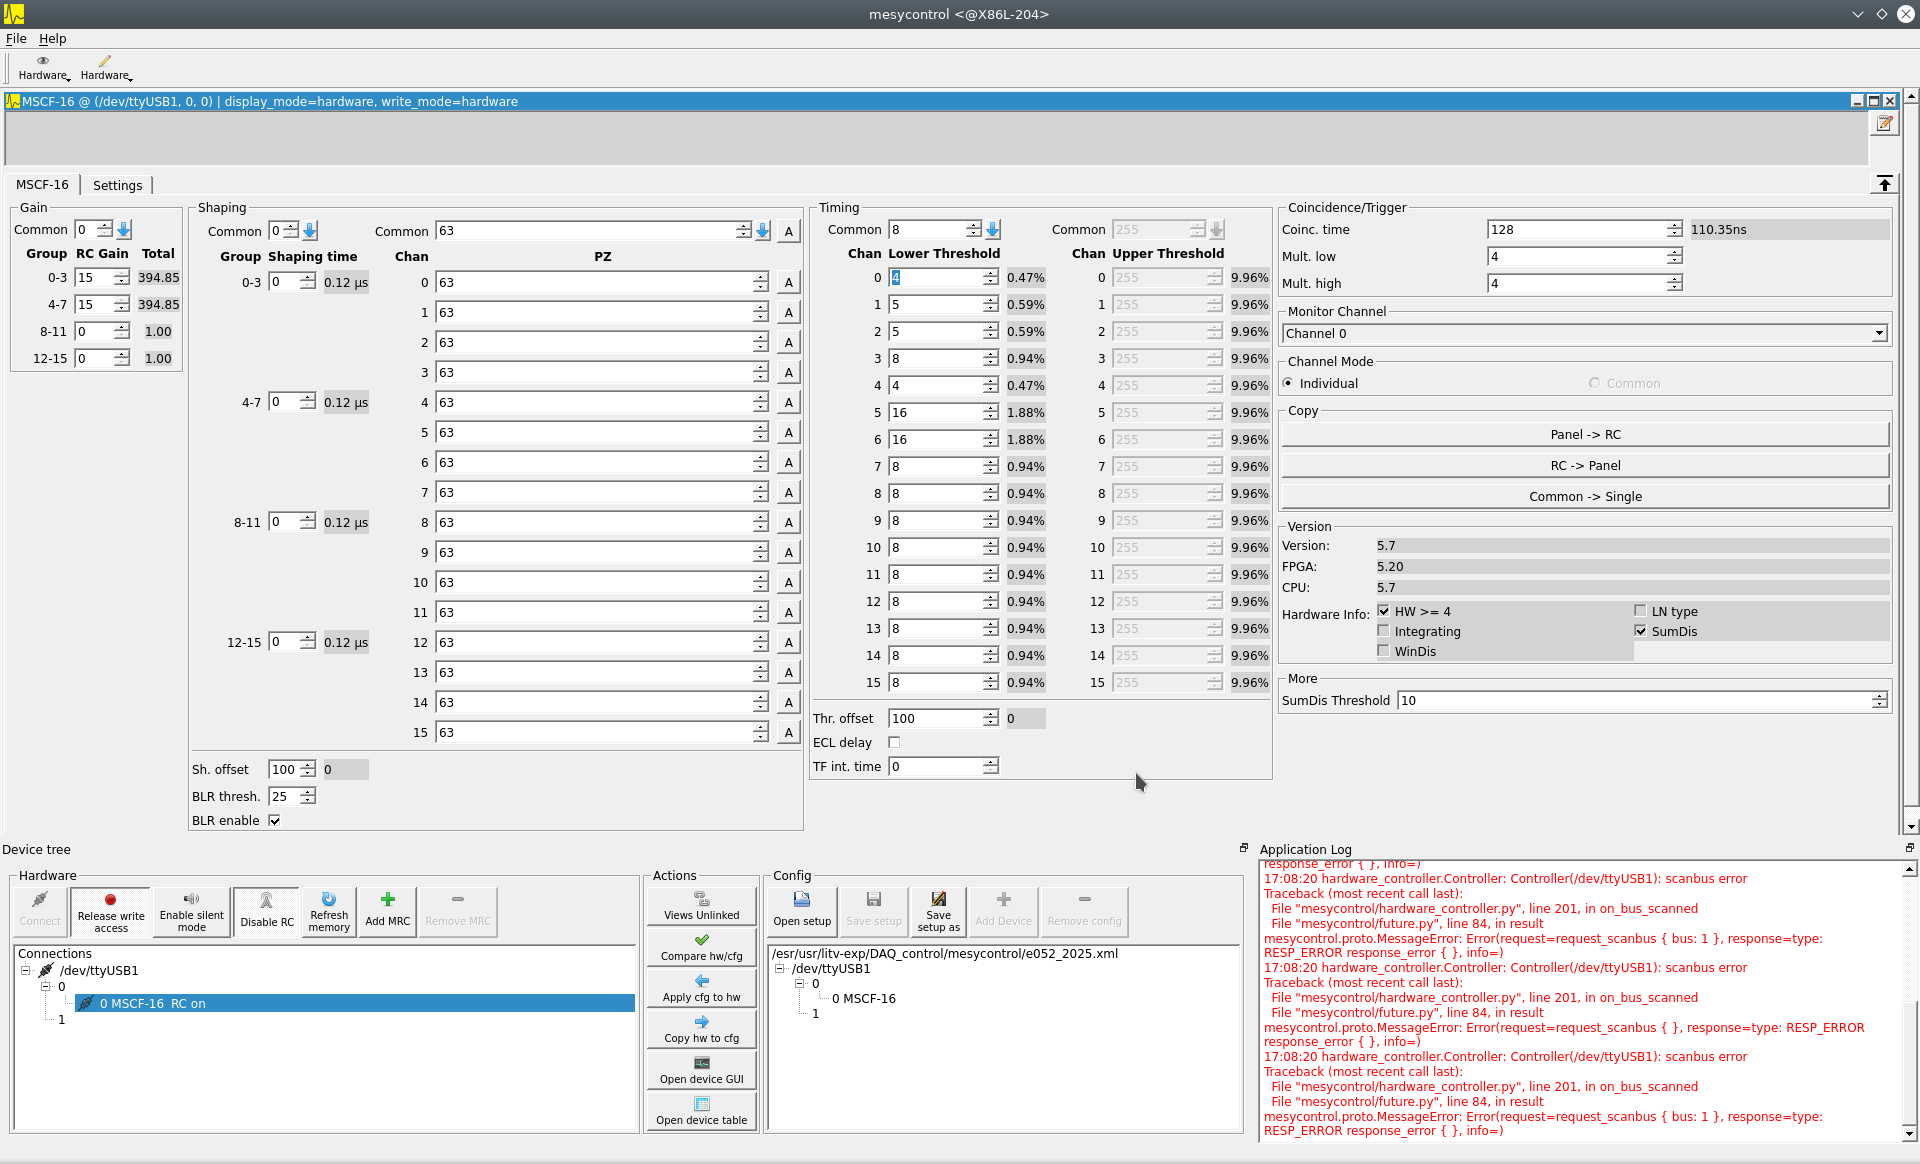
Below are the settings for Mesytec CFD. Internally the 2nC chips (x 20 ??? ) are used for both groups. Please note that thre are also 20nC chips in "parking position" (lower amplfication).
The Mesytec PMT CFD Version uses "nC" chips while the other Mesytec Shapers "gain / amplification", i.e. chips labeled with 20 are x20 and have a large amplification while the "nC" chips give the full scale range , aka the 20nC is tghe small amplification.
Note as well: Externally, the channel numbering starts with "1" while the Mesycontrol starts with "0".
The sum of all Mesytec signals defines the gate for the ADC.
Group 4-7 are the x100 signals (similar to Vuprom TDC). These signals go to the 25ps TDC and are used for timing, and to the ADC.
Group 0-3 is x10; thresholds are artificially set slightly too high, signals are used in the ADC only. Since these are the same signals as in the x100 group, their (correct) gate signals can be used in the ADC. The x10 capture also the very high signals.
ch 0(1): PMT South x10 (A).
ch 1(2): PMT Mid x10 (B).
ch 2(3): PMT North x10 (C).
ch 4(5): PMT South x100 (B).
ch 5(6): PMT Mid x100 (D).
ch 6(7): PMT North x100 (F). |
| Attachment 1: Mesytec_CFD_Settings_2025-06-11_17-17-33.png
|
|
|
13
|
Mon Jun 16 21:47:23 2025 |
Carsten, Wilfried, Simon | Detectors | New threshold values for PMTs |
We adjusted the thresholds for the PMTs and increased the voltage of PMT middle to 2.7kV
|
PMT | Model | | Operation Voltage | Threshold (mV)
| |
South | ET9422B | Broadband | -1750 V | 30
| |
Middle | ET9423B | Smallband | -2700 V | 18
| |
North | ET9423B | Smallband | -2650 V | 10
|
|
|
36
|
Sat Jun 21 03:13:02 2025 |
Alex, Anton, Rodolfo, Hiroshi | Detectors | Part Det South |
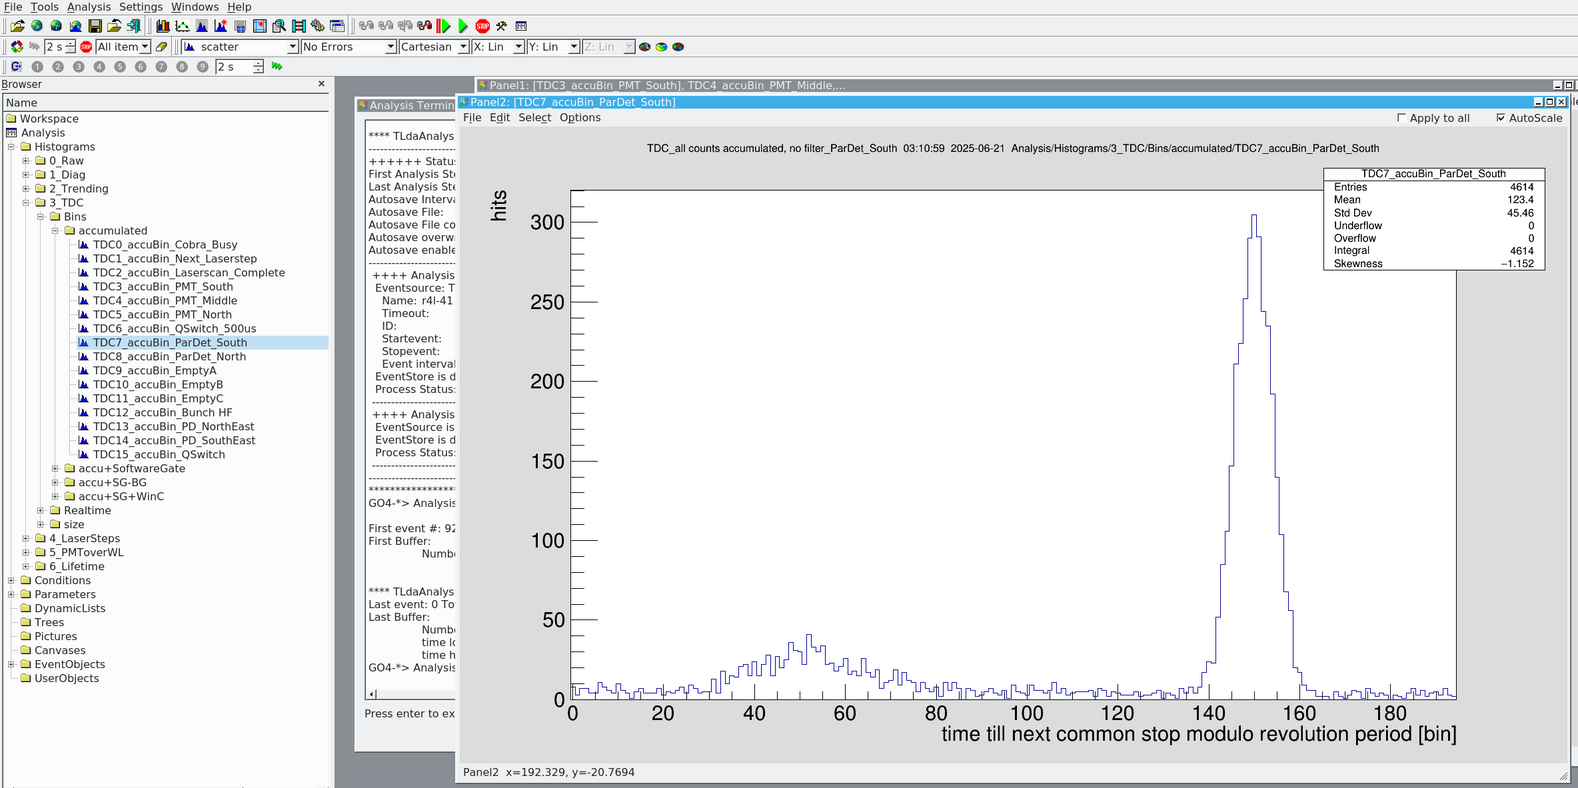
Bunch signal on Particle Detector South. On the
- right side: the thorium beam.
- left side: a satellite peak (isobar).
|
| Attachment 1: Bildschirmfoto_PartDetSouth_2025-06-21.png
|
|
|
40
|
Sat Jun 21 17:00:10 2025 |
Carsten, Peter, Danyal, Kristian, Marek | Detectors | PMT north exchanged |
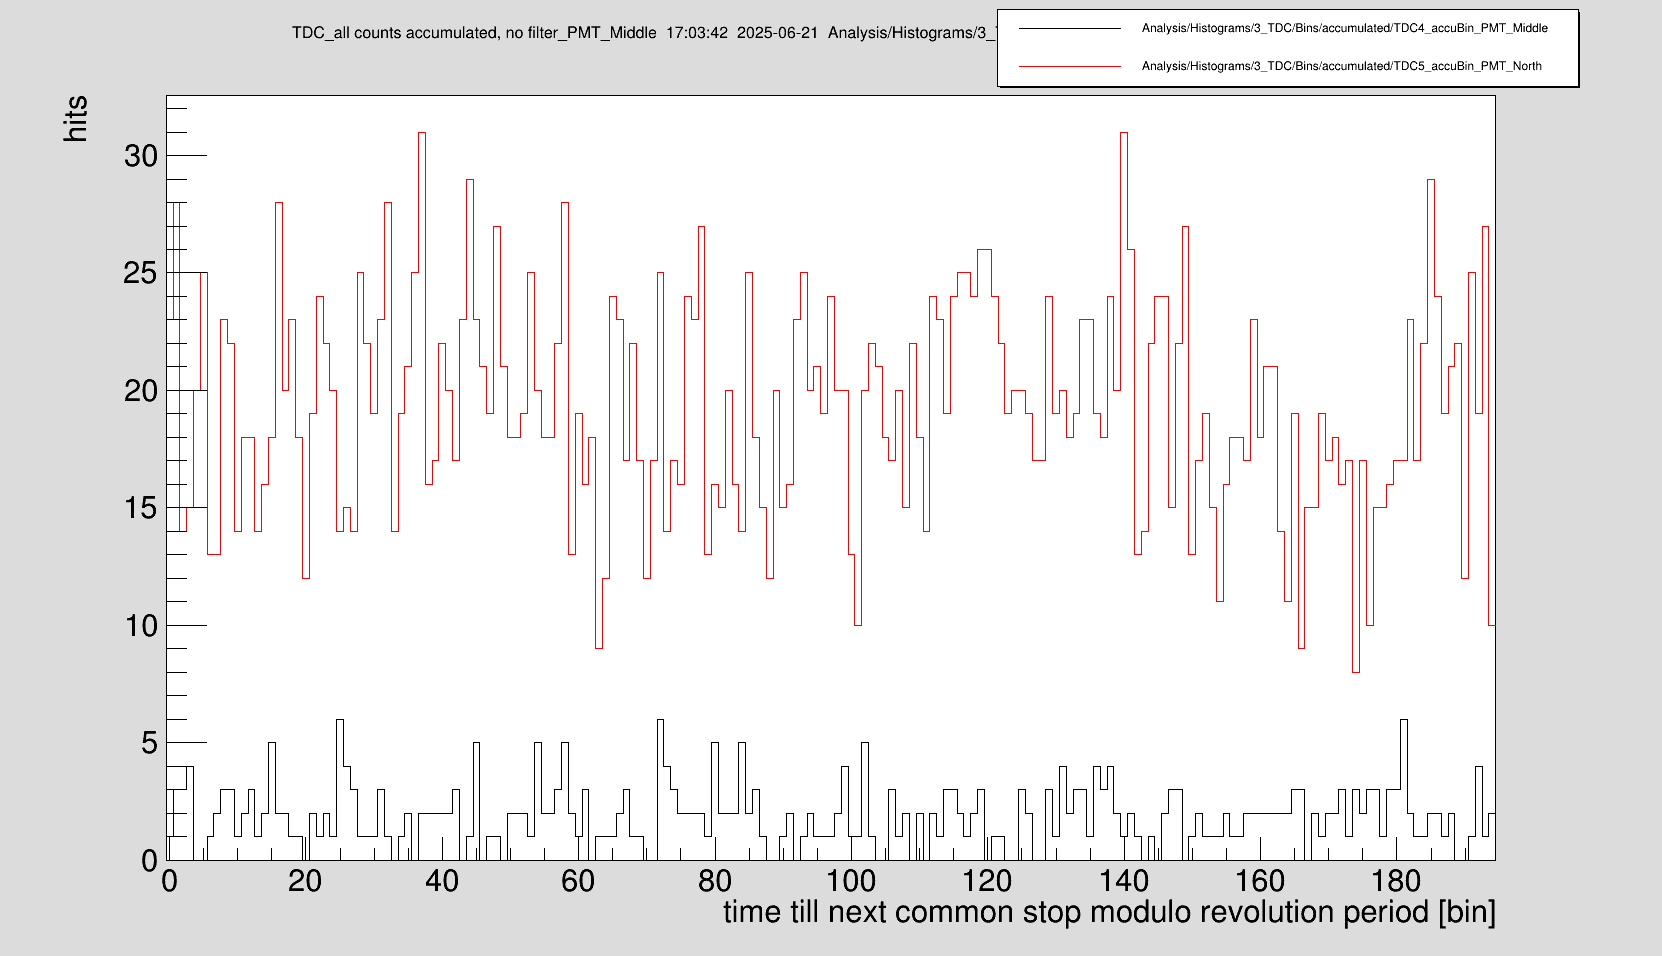
We noted that the dark countrate of PMT north is about 20x higher than that of PMT middle.

We went into the ESR cave to look for stray light.
We decided to put a black cloth over all the PMTs.
Also we made the tubes of the N2 airflow to the PMTs black (tape around).
This did not make a significant change.

We exchanged PMT north (same type 9423B) to see if that made a difference.
It did not really change either.

PMT north = 2650 V
PMT middle = 2700 V

The first picture below shows the dark rates for these two voltages.

At about 17:00 we changed the voltage of PMT north to 2700 V.
This did not change anything.


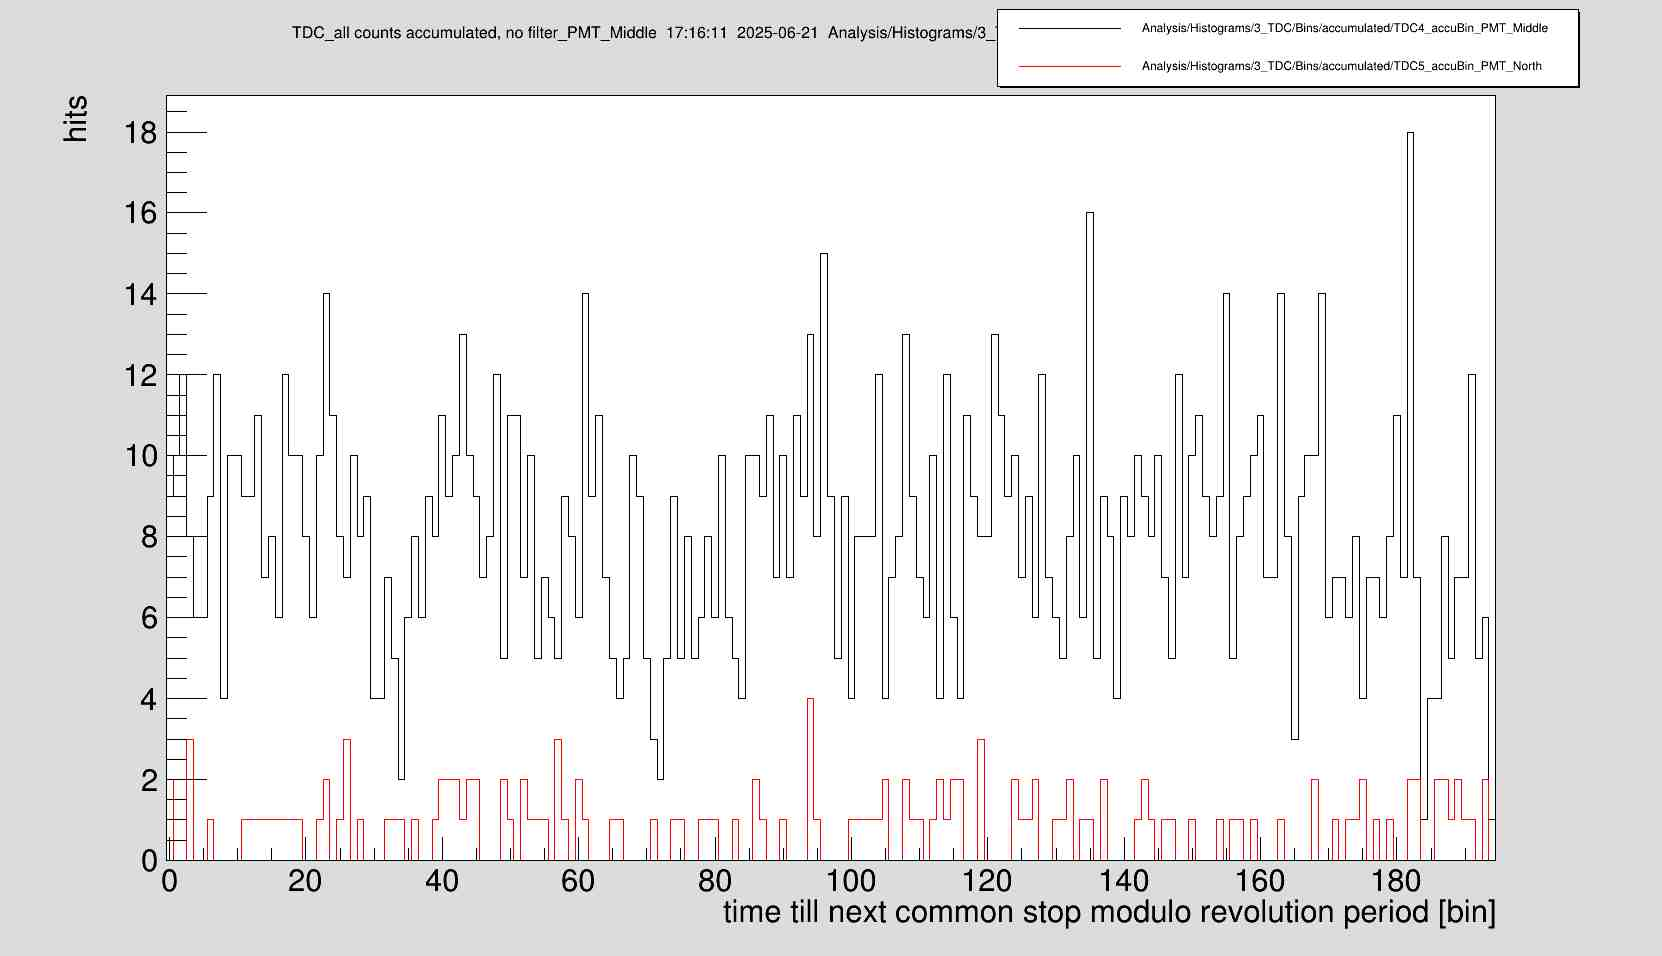
Carsten swapped the cables of PMT north and PMt middle (inside ESR, before the amps) at 17:14.
The second picture below shows the result of that.
Now black and red are exchanged.


Carsten swapped the cables back again (17:20).
Carsten and Kristian will look at the PMT signals in the ESR cave. |
| Attachment 1: Panel4.png
|
|
| Attachment 2: Panel4.jpg
|
|
|
41
|
Sat Jun 21 18:00:49 2025 |
Carsten, Peter, Danyal, Kristian, Marek | Detectors | PMT signals |
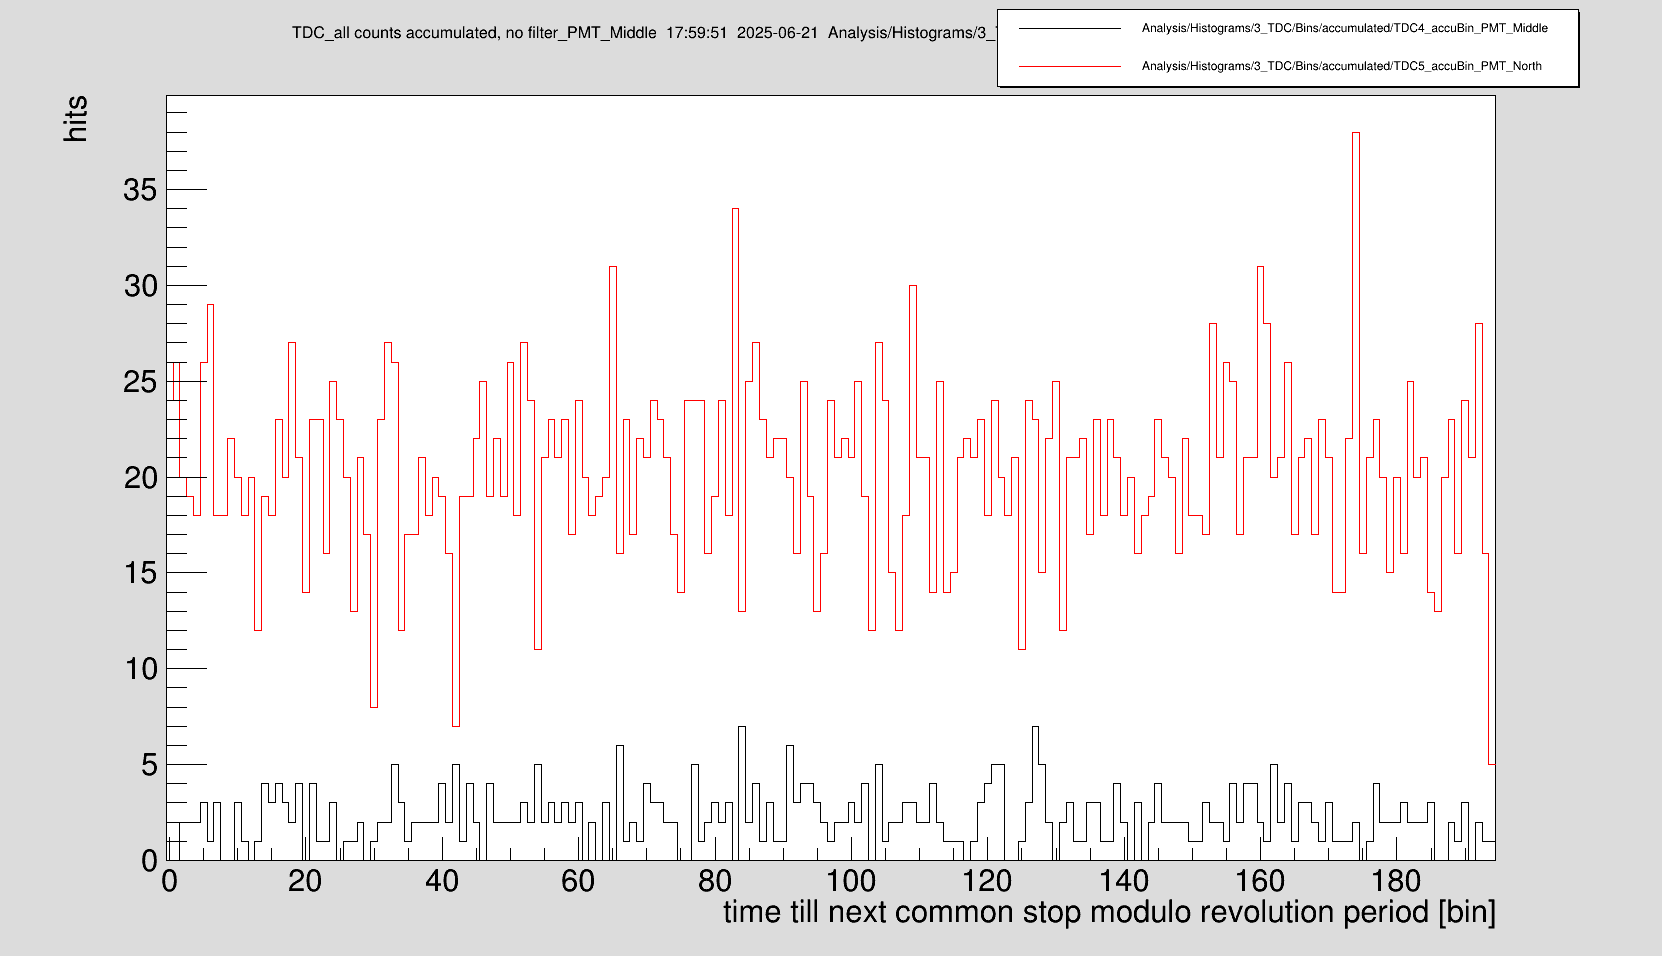
Carsten and Kristian changed (18:00) the thresholds of PMT north and PMT middle in the ESR cave.
See picture below. The effect is negligible.


Carsten will now (18:05) change the channel of the pre-amp of PMT north. |
| Attachment 1: Panel4.gif
|
|
|
42
|
Sat Jun 21 21:55:18 2025 |
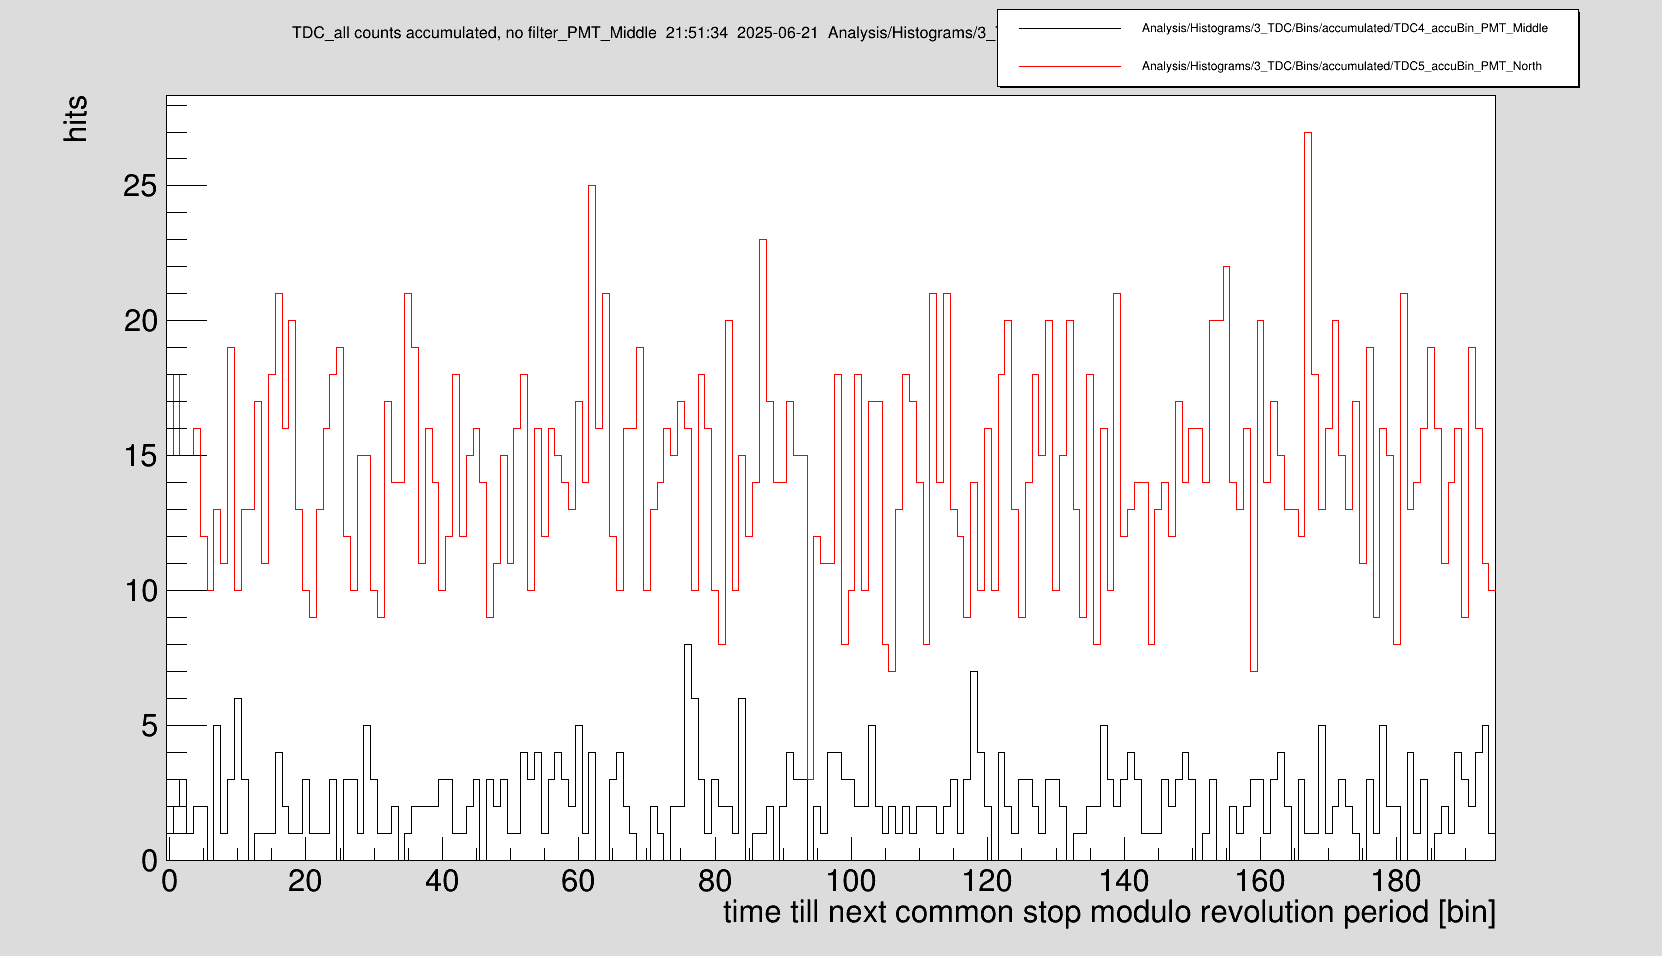
Peter, Danyal, Marek | Detectors | PMT rates |
We have made two foam rings (outer diameter ca. 70 mm with a thickness of 10 mm each and placed them successively underneath PMT north.

ring 1: ID = 55 mm
ring 2: ID = 47 mm

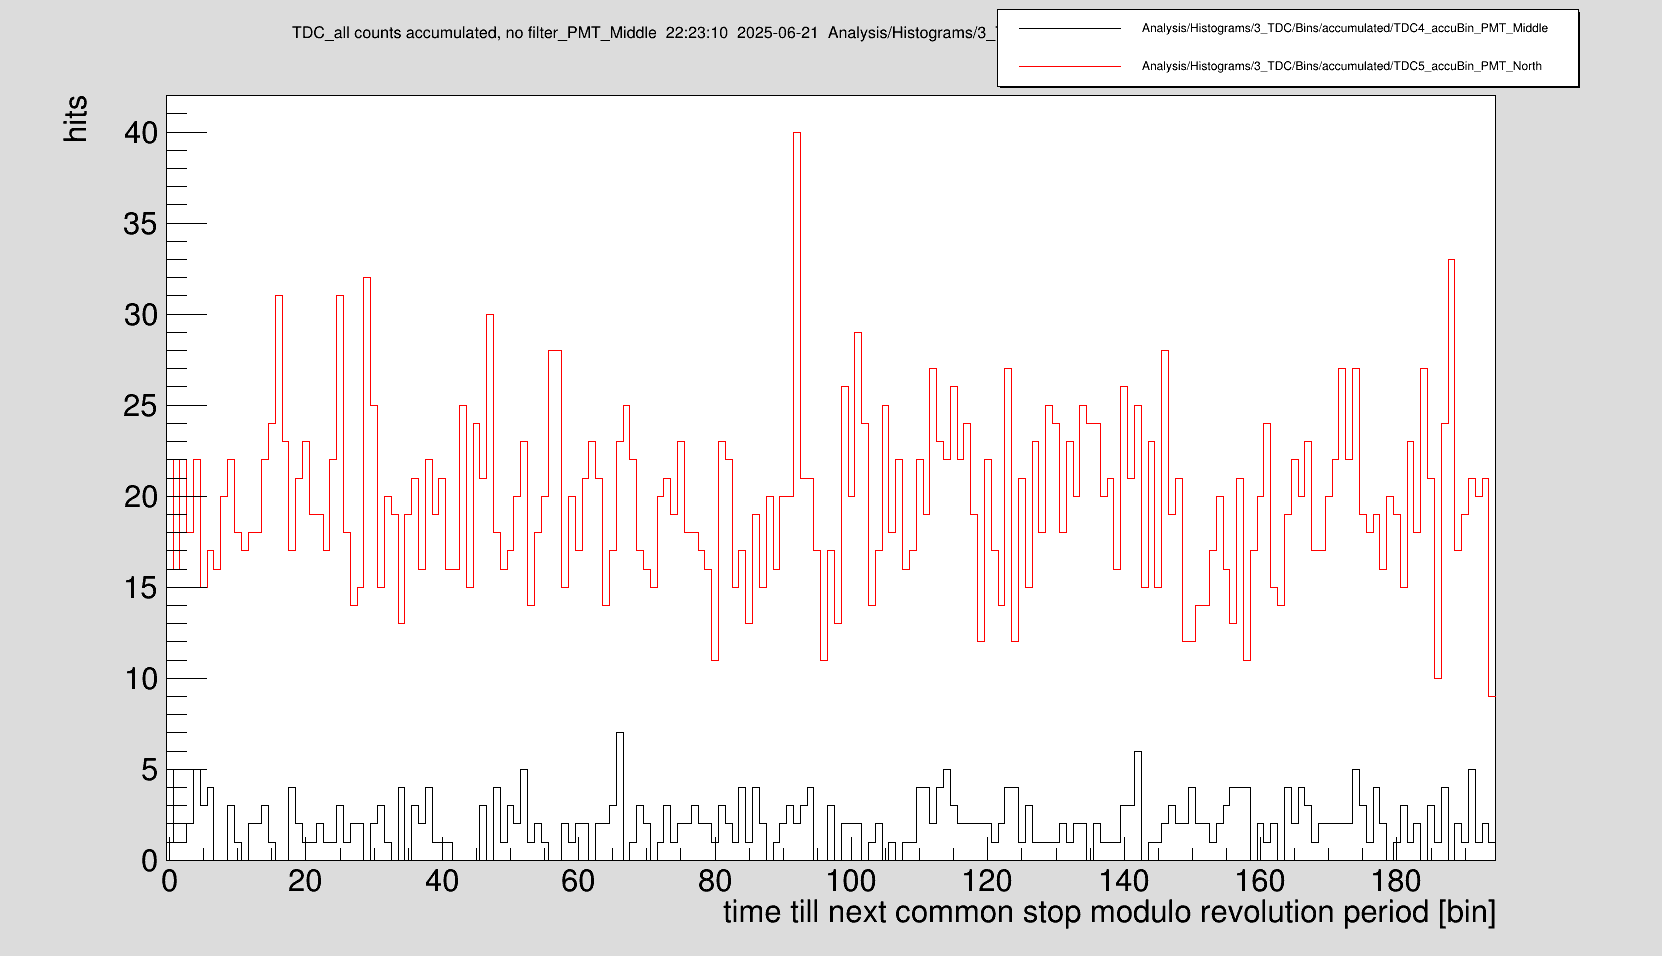
Without rings we had measured ca. 20 counts per channel in a time of about 7 minutes. (1st picture below)

With ring 1 we have measured ca. 18 counts per channel in 7 mins.

with ring 1 and ring 2 we have measured ca. 15 counts per channel in 7 mins. (2nd picture below)

It is clear that the rate of PMT north decreases with increasing distance from the beampipe.

At this point it is not yet clear to us if the experiment will benefit from the 2 rings.

If the rings should be implemented, we propose to have one proper ring (20 mm high) made by the mechanical workshop. |
| Attachment 1: no_rings_under_PMT_north.png
|
|
| Attachment 2: 2_rings_under_PMT_north.png
|
|