| ID |
Date |
Author |
Category |
Subject |
|
18
|
Thu May 6 21:45:30 2021 |
Helmut | Detectors | beam position on TE5 grids |
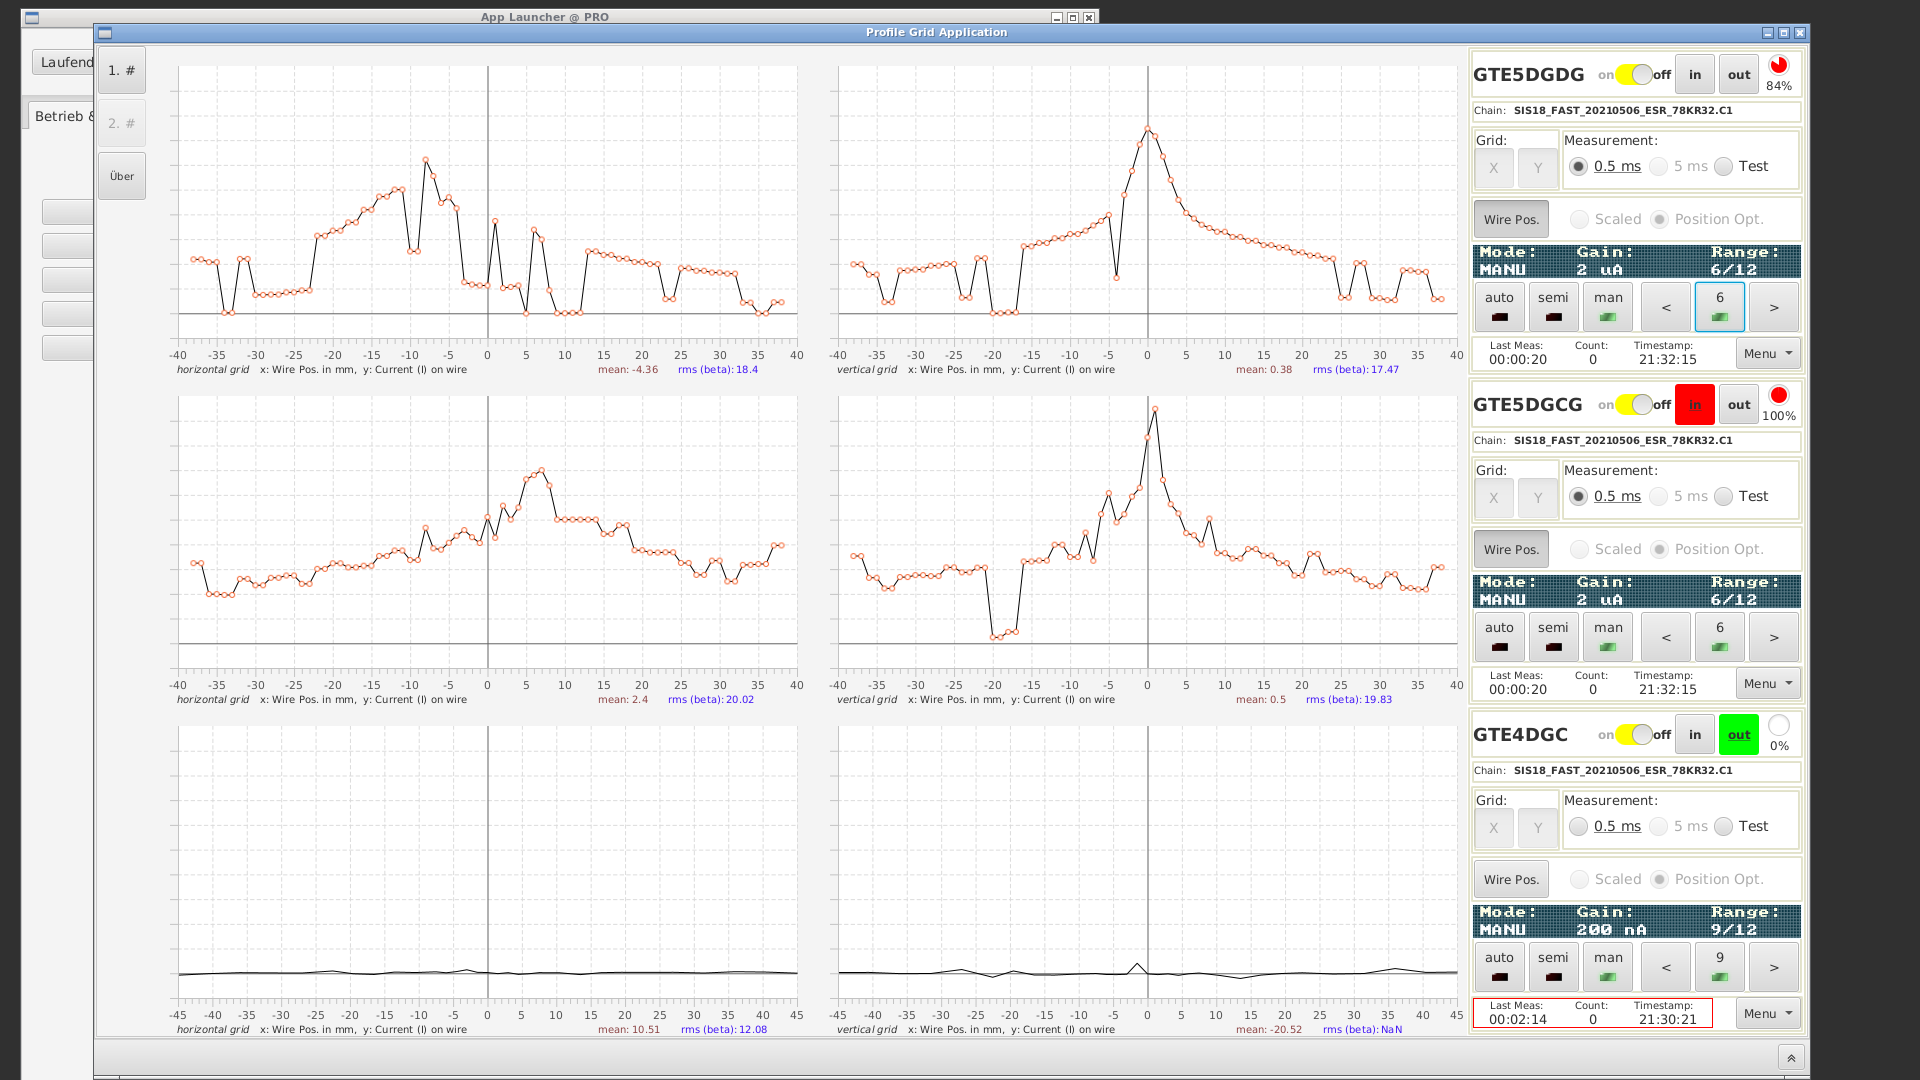
The two grids do not work very well, one x position is opposite to the other.
But at least a guidance for the future, this was good injection of 78Kr with a thick Be target. |
| Attachment 1: 2021-05-06_21-32-36-171.png
|
|
|
76
|
Sat May 8 16:08:58 2021 |
Helmut Weick | Accelerator | beam position of Kr before ESR |
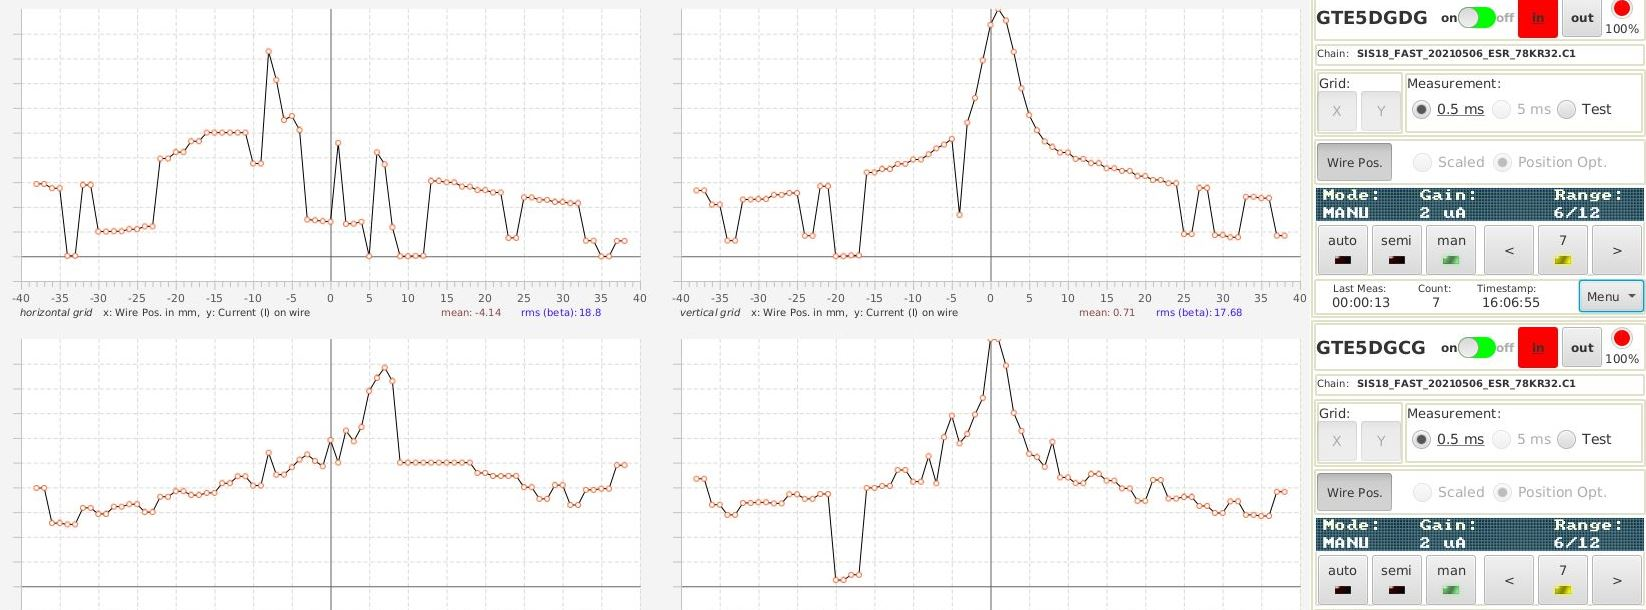
Checked beam positions in beamline before ESR,
they all look the same as before, with direct Kr beam.
Compare with old elog entry #.
Also on Leuchttarget it is in the center like before. |
| Attachment 1: TE3DG3-Kr.JPG
|

|
| Attachment 2: TE3DGC-Kr.JPG
|

|
| Attachment 3: TE5-grids-Kr.jpg
|
|
|
145
|
Wed Jun 30 01:38:20 2021 |
Shahab | Runs | beam is back from Linac but not in the ESR |
|
|
58
|
Fri May 7 20:34:27 2021 |
Kanika, Michael, Shahab | Runs | back to 15 sec recording |
now we are going back to 15 sec operation. Cave M (bio) operation is over |
|
167
|
Thu Jul 1 14:47:15 2021 |
Yury, Helmut | Accelerator | added high Brho scrapers |
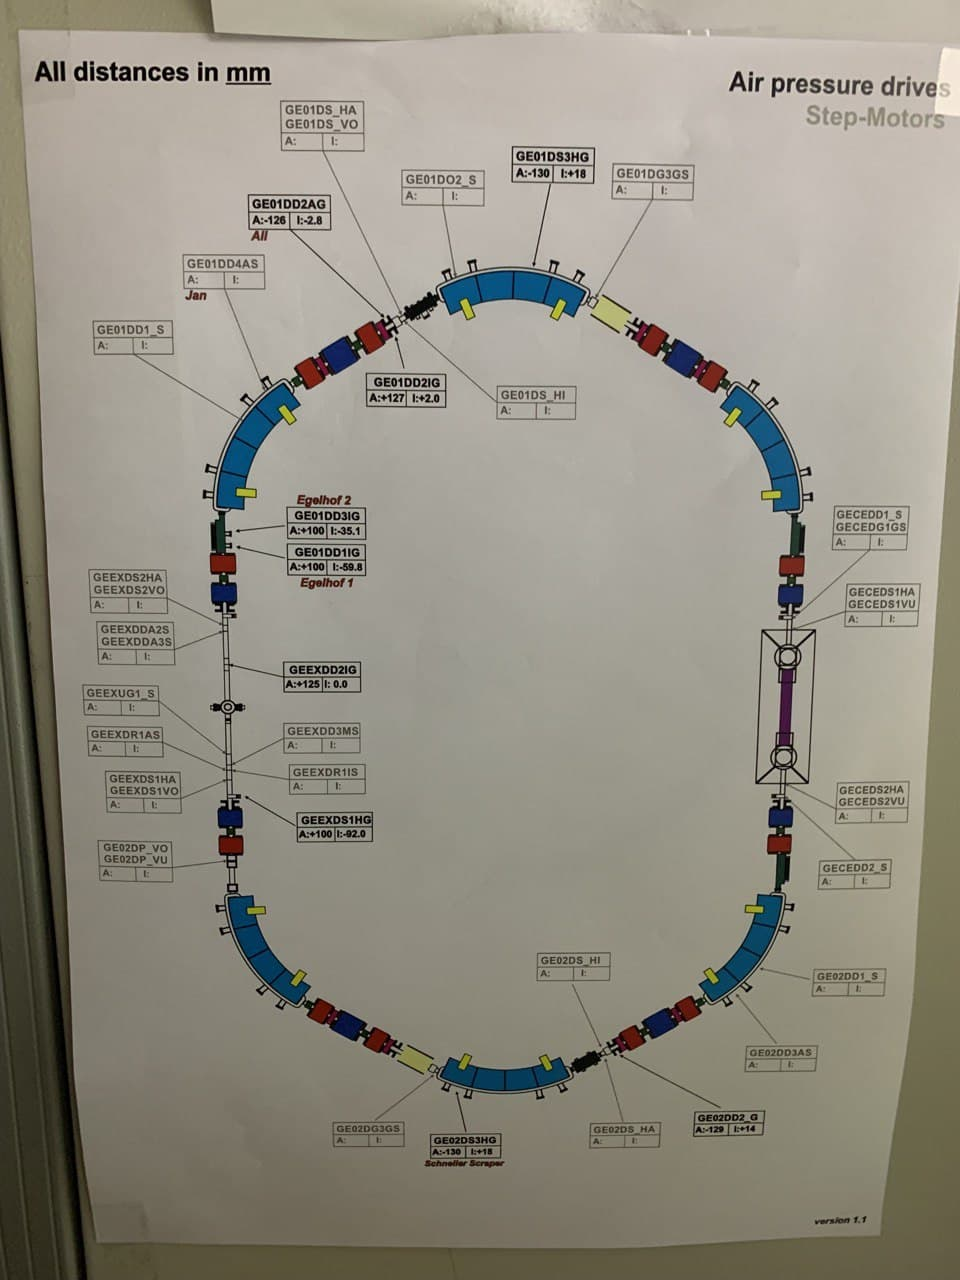
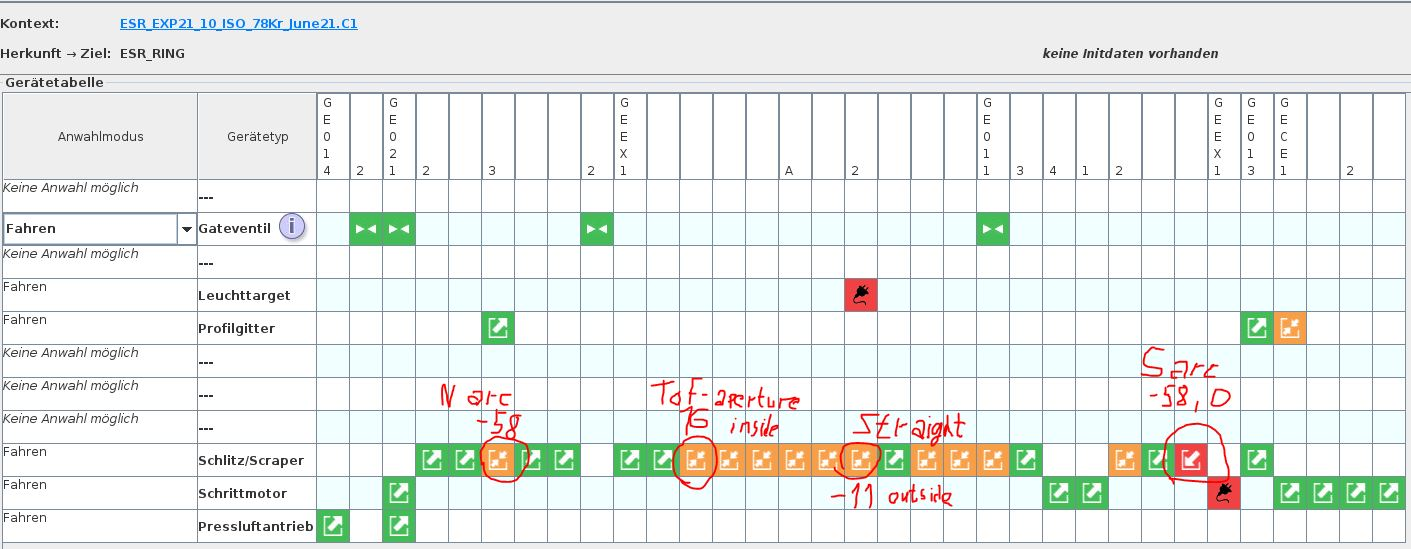
So far only scrapers for low Brho were used:
  GE01DS_HI = -58mm (arc from inside) and
  GEEXDS2HA = -11.2 (straight from outside)
We also want a cut on high Brho to avoid possible strange lines.

GE01DS_HA is limited in motion, at the maximum inside position (0.0 mm) there is no effect.

Next EEXDS1HG (aperture for ToF-detctor) in mm
120 -  completely out
 60 - no effect full beam
 45 -   "
 30 -   "
 20 -   "
 10 - very little beam remaining
  5 - gone
 12 - little beam
 14 - narow but little
 16 - narrow with small tail in left side
 20 - again like full
100 - full (as reference for the eye)

Then similar with E02DSHG in arc dipole in mm
 -130 - full
  -60 - full
  -40 - gone
  -45 - very tiny
  -55 - full
  -50 - less beam
  -52 - similar
  -53 - no difference
  -58 - looks like full

Now add EEXDS1HG again with -16mm, no difference, so keep both in.
==> we cut in arc from both sides and on straight secton from both sides
    Intensity does not look different to scrapers out.
It looks like a bit less 70Se in ESR then 1h before, but maybe other reason. |
| Attachment 1: ESR-scraper-overview.jpg
|
|
| Attachment 2: scrapers-used.JPG
|
|
|
125
|
Mon May 10 01:34:37 2021 |
Chris C | General | Zoom screenshot |
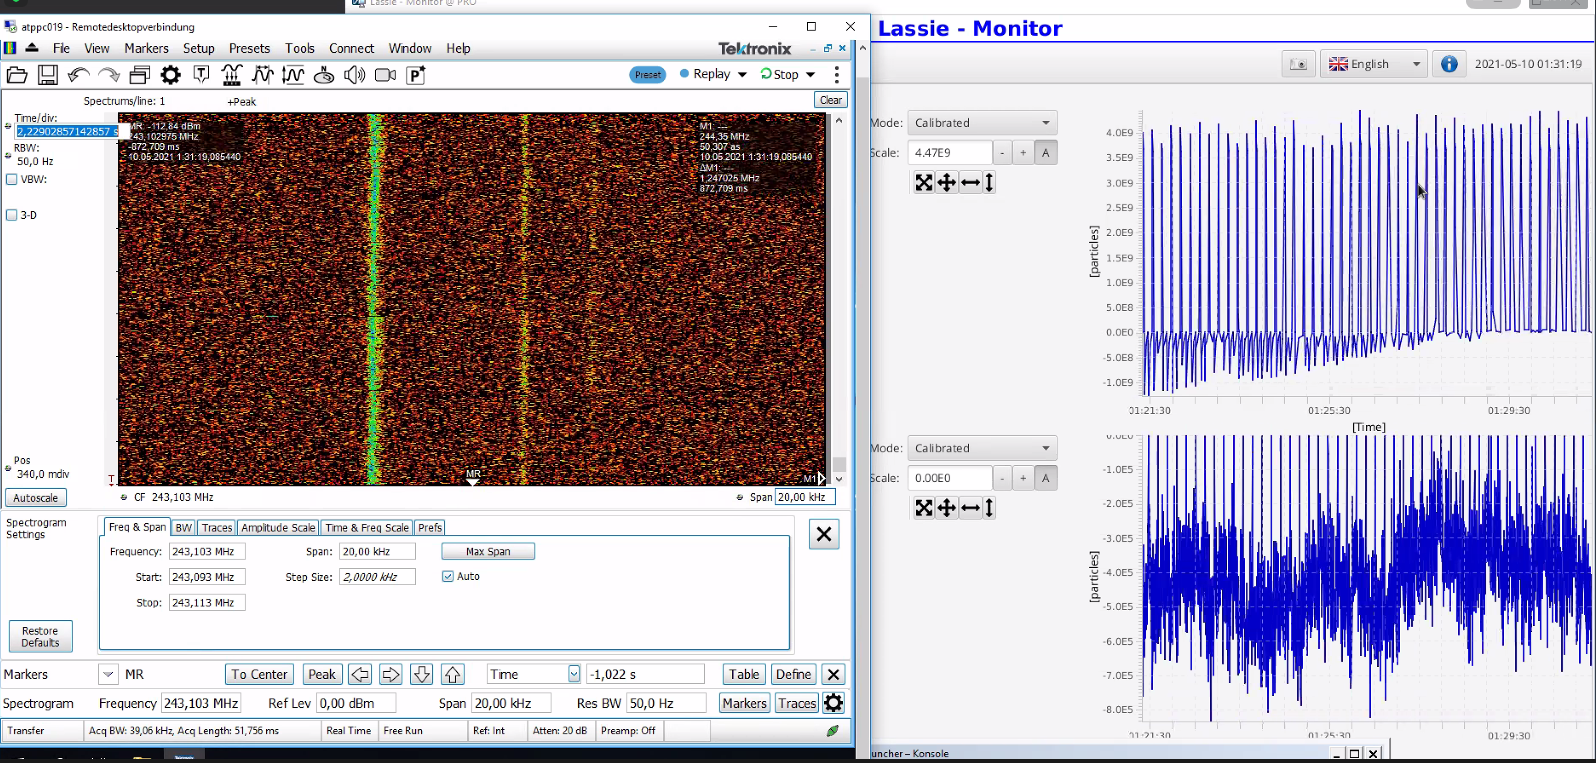
How things look currently in Zoom-world. |
| Attachment 1: Zoom_monitoring_2021-10-05_0131CET.PNG
|
|
|
69
|
Sat May 8 07:34:08 2021 |
Akash, Nic, Jelena, Zsolt | General | Zoom has its own mind |
Zoom kicked us all out... we managed to get back in...screen sharing is back on. |
|
56
|
Fri May 7 19:56:10 2021 |
Kanika, Michael, Shahab | Runs | ZOOM session restart |
restart zoom session |
|
98
|
Sun May 9 06:15:09 2021 |
Iris, Chris G., Jacobus, Michele | Runs | Triplet: zoom in |
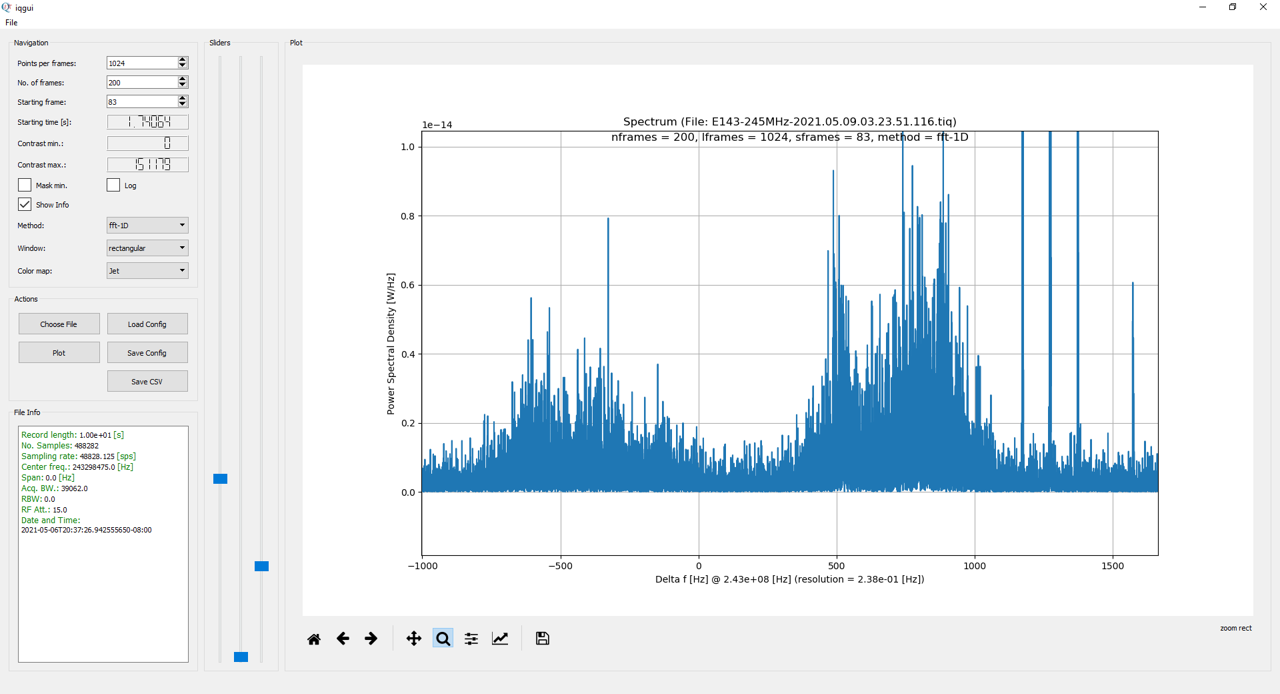
Zoom into the triplet: the satellite peaks on the right are clearly visible.
This is just one file but one *might* see some substructure. Yuri mentioned a 318 ms isomer in 45Sc at 12 keV but that cannot be resolved.

Maybe someone can look at the added-up ROOT files if that looks better or is just statistics?

> Short update from Yuri: these are not our isomers. These are 45Sc (left, 12 keV isomer not resolvable) and 75Br (center), and the right-most peak of the triplet is a satellite (has a different line shape, much narrower).
> |
| Attachment 1: 116-triplet.png
|
|
|
37
|
Fri May 7 08:55:33 2021 |
Ragan, Andrew, Yuri | General | Trigger changed |
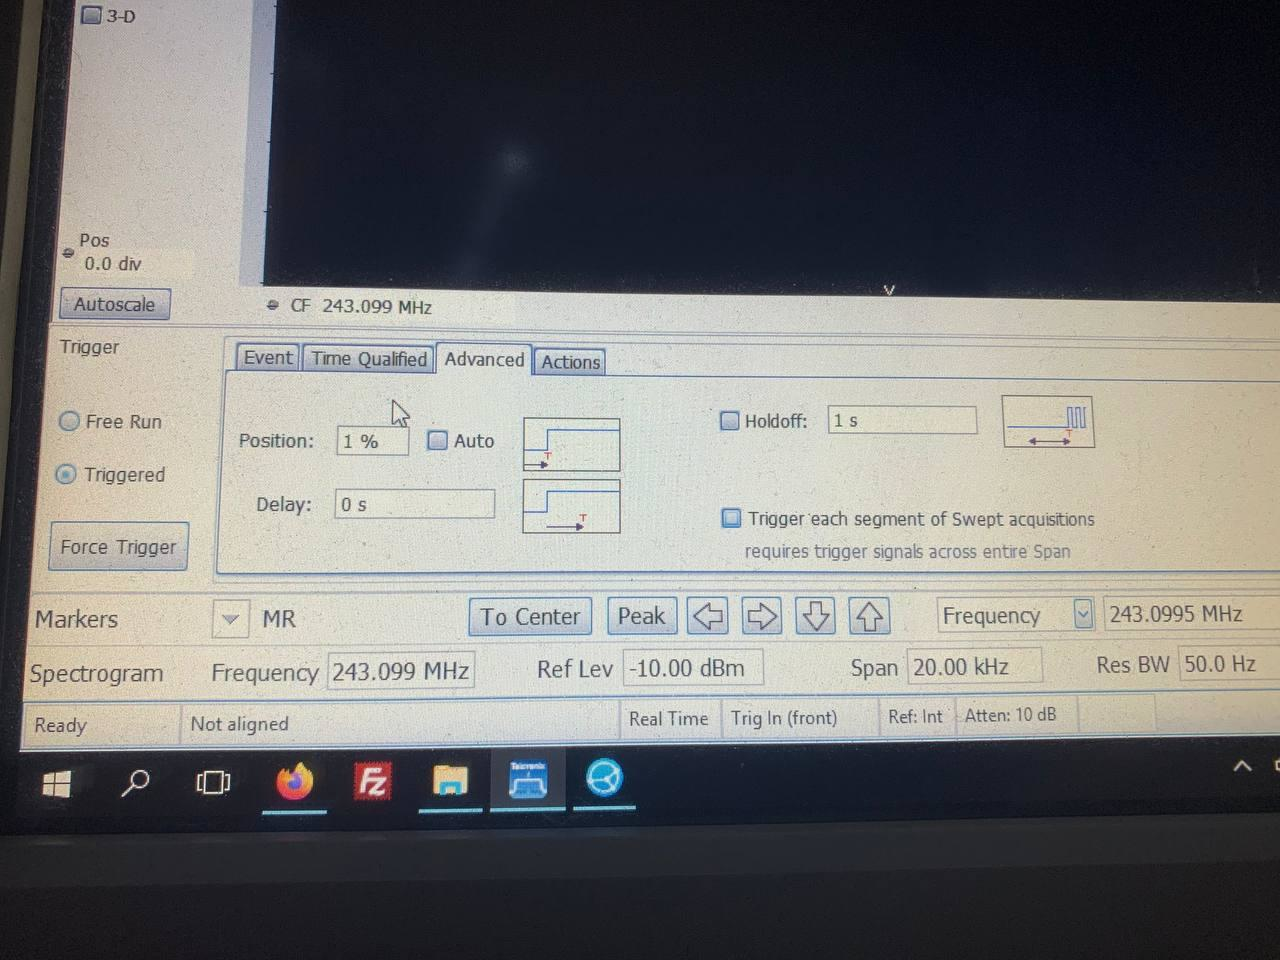
Trigger for both the spectrum analyzers is changed from 50% to 1% by Yuri.
For this, the ESR pattern was stopped at 08:50 and was started back at 08:53. |
| Attachment 1: photo_2021-05-07_08-58-58.jpg
|
|
|
35
|
Fri May 7 07:52:12 2021 |
Ragan, Andrew | General | To change trigger position |
Xiangcheng suggested to change the trigger position in order to start the file with the injection. Nothing is changed at the moment. Maybe Shahab or Yuri can do it when they arrive. |
|
11
|
Thu May 6 14:30:23 2021 |
W. Korten | General | Target thickness |
Thickness of the Carbon target in the TE line has been measured by centering the primary 78Kr beam in the ESR:
Beam energy 370 MeV/u, with thin stripper, ESR energy 368.65 MeV
Adjust beam with "thick" target to keep ESR energy at 368.65 MeV/u -> Beam energy 445 MeV/u
Energy loss 75+1.35=76.35 MeV
Target thickness : 9.97 mm |
|
9
|
Thu May 6 13:26:56 2021 |
Helmut Weick | Detectors | TE5 profile grids do not work |
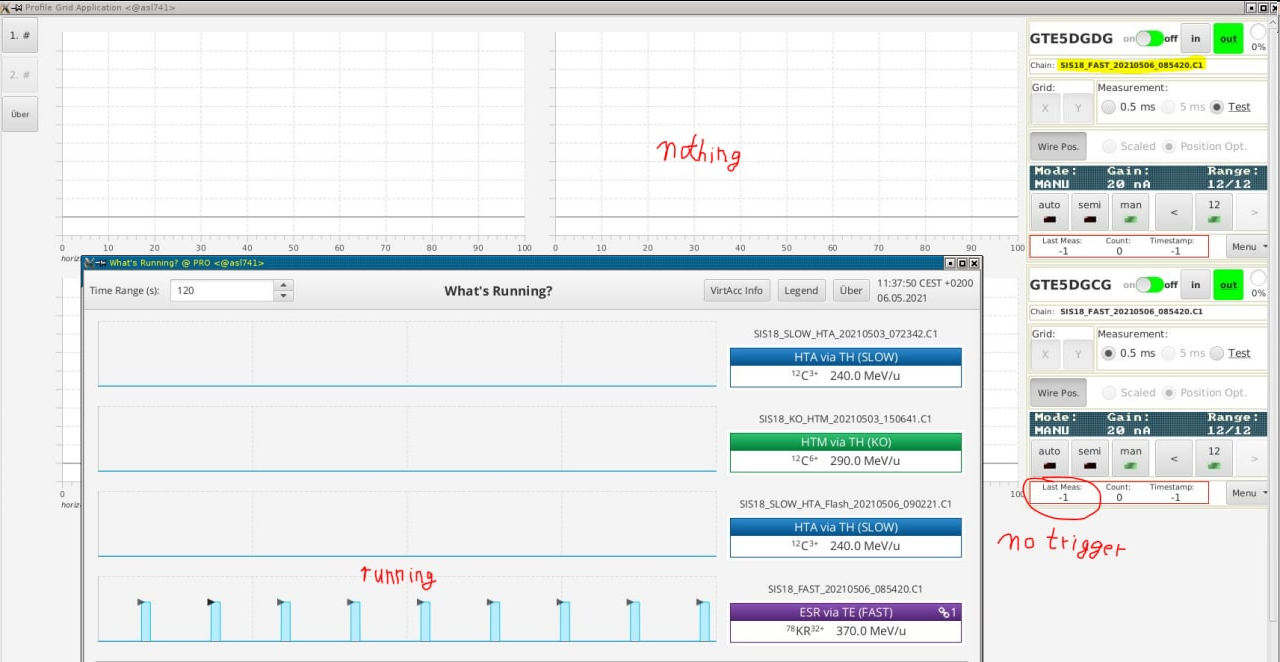
There are several issues.

1. The stepper motor drive does not react from Device-Control, -> check controller in FRS Messhütte
2. They don't get a trigger, other grids in TE-line do -> check raw signals also in FRS Messhütte, ask Strahldiagnose
3. For less noise pockets of grids should be evacuated, but most likely the pump is still off or not even connected -> enter ESR and connect

Check also manual at https://web-docs.gsi.de/~weick/frs/current_grids.html
Below picture of no trigger shown in App. Usually it should say last trigger a few seconds ago and display some noise. |
| Attachment 1: no_trigger.png
|
|
|
224
|
Sat Jul 3 01:28:08 2021 |
The remote Canadian eager beavers (Guy and Iris) | Analysis | Summed spectra 410 MHz from 21:00-23:59 (70Se) |
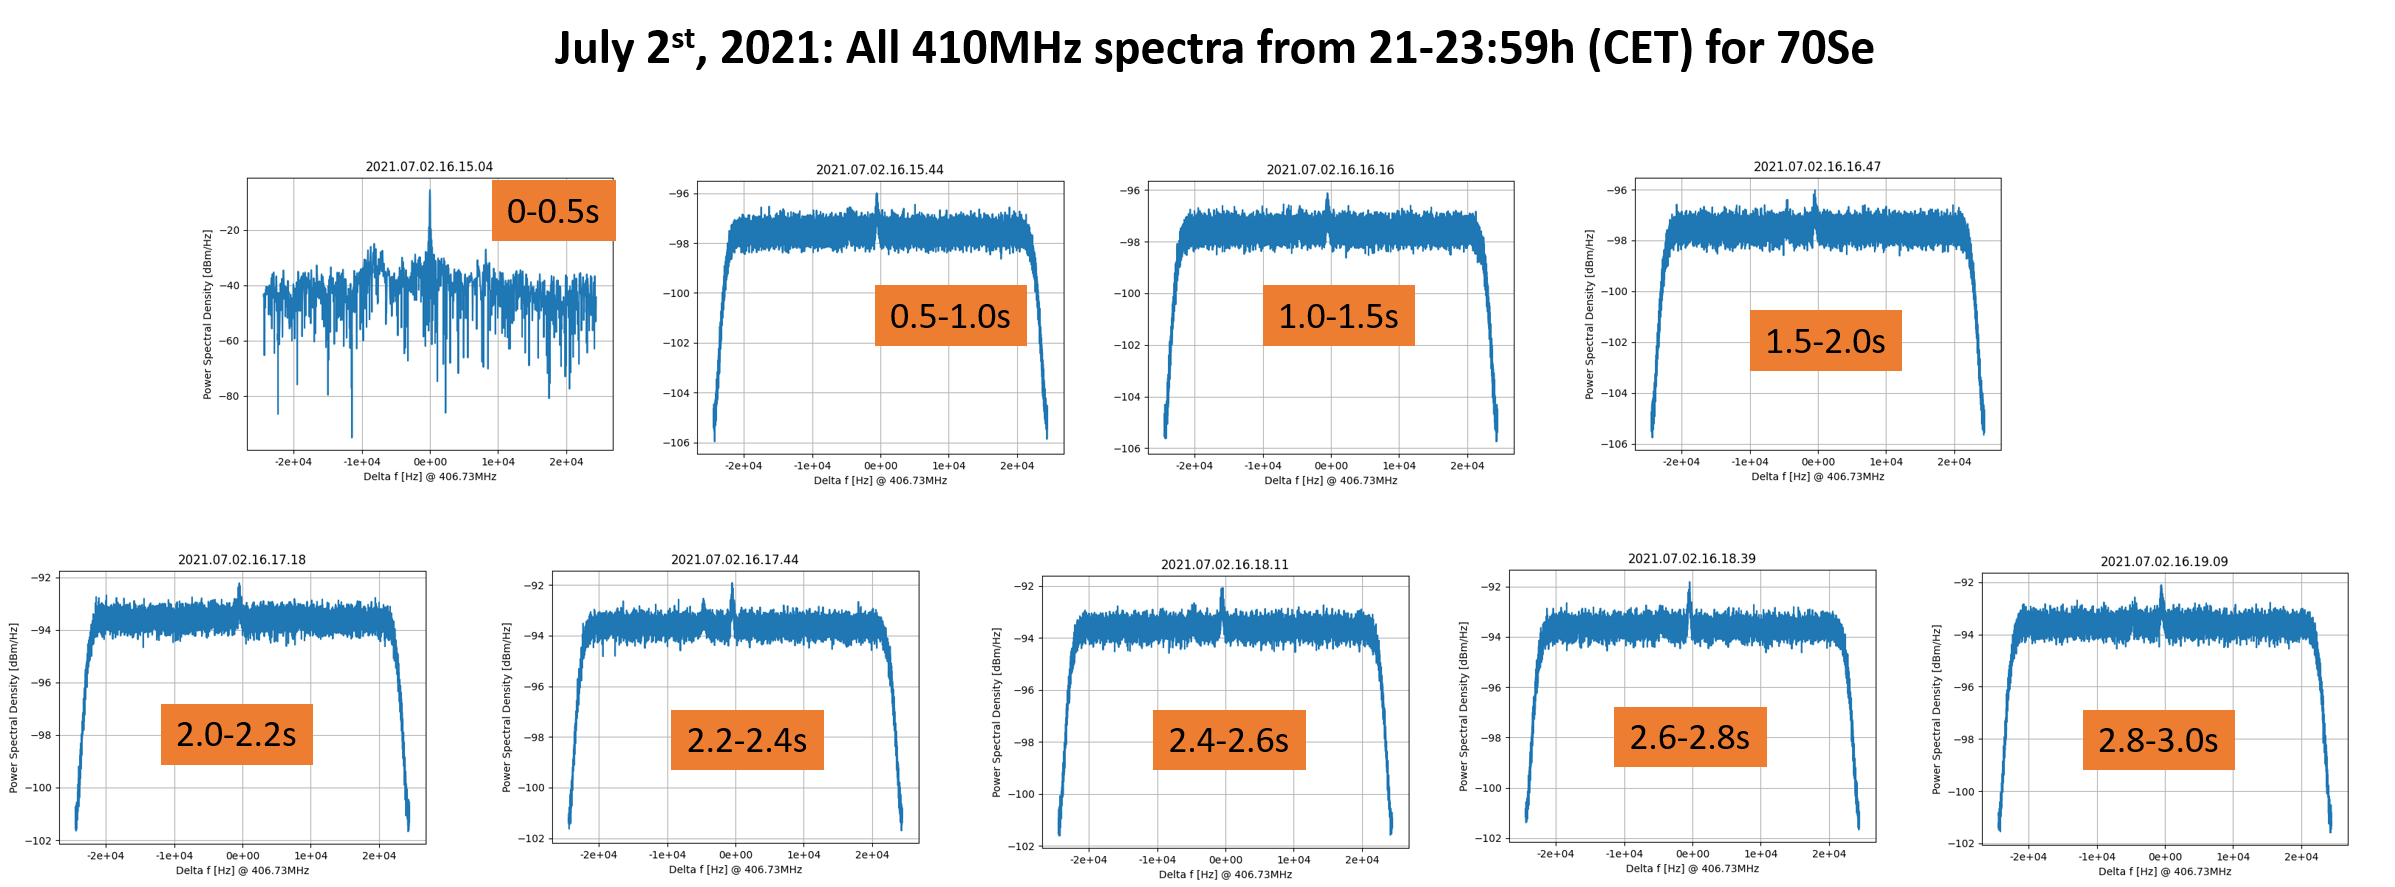
Here's a picture with all injections with an ion in the spectrum (empty ones were removed- list below). The time slices are 0-0.5-1-1.5-2s, then in 0.2s steps up to 3s. Not really anything to see :-(  The previous shift was right, looking at single spectra might be more useful. I'll group the pictures and upload some "interesting" ones.


Here is the list of spectra btw 21-23:59 which we have removed since they were empty or had just an ion on the far left side:

Name
410MHz-2021.07.02.22.00.29.051.tiq
410MHz-2021.07.02.22.02.03.277.tiq
410MHz-2021.07.02.22.05.11.820.tiq	one line far left
410MHz-2021.07.02.22.10.57.361.tiq
410MHz-2021.07.02.22.12.00.189.tiq
410MHz-2021.07.02.22.16.11.439.tiq	possible weak at beginning, up to 2.5s, tbd
410MHz-2021.07.02.22.16.42.837.tiq
410MHz-2021.07.02.22.17.14.236.tiq
410MHz-2021.07.02.22.18.17.037.tiq	possible weak at beginning, up to 2.5s, tbd
410MHz-2021.07.02.22.18.48.439.tiq
410MHz-2021.07.02.22.22.55.403.tiq
410MHz-2021.07.02.22.23.26.786.tiq
410MHz-2021.07.02.22.28.48.088.tiq
410MHz-2021.07.02.22.35.40.568.tiq
410MHz-2021.07.02.22.36.12.157.tiq	weak on left?
410MHz-2021.07.02.22.36.43.749.tiq
410MHz-2021.07.02.22.37.15.343.tiq
410MHz-2021.07.02.22.37.46.933.tiq
410MHz-2021.07.02.22.45.40.791.tiq
410MHz-2021.07.02.22.52.31.388.tiq
410MHz-2021.07.02.22.53.02.969.tiq
410MHz-2021.07.02.22.56.44.073.tiq
410MHz-2021.07.02.22.31.59.417.tiq	possible weak at beginning, up to 2.5s, tbd
410MHz-2021.07.02.22.49.21.896.tiq	possible weak at beginning, up to 2.5s, tbd


410MHz-2021.07.02.21.00.28.254.tiq
410MHz-2021.07.02.21.04.09.536.tiq
410MHz-2021.07.02.21.04.41.147.tiq
410MHz-2021.07.02.21.12.03.629.tiq
410MHz-2021.07.02.21.14.10.043.tiq
410MHz-2021.07.02.21.16.16.423.tiq
410MHz-2021.07.02.21.16.48.033.tiq
410MHz-2021.07.02.21.17.19.643.tiq
410MHz-2021.07.02.21.17.51.252.tiq
410MHz-2021.07.02.21.19.57.661.tiq
410MHz-2021.07.02.21.20.29.255.tiq
410MHz-2021.07.02.21.23.07.234.tiq
410MHz-2021.07.02.21.26.48.358.tiq
410MHz-2021.07.02.21.28.23.122.tiq	only peak on left
410MHz-2021.07.02.21.29.57.884.tiq
410MHz-2021.07.02.21.30.29.475.tiq
410MHz-2021.07.02.21.34.42.242.tiq
410MHz-2021.07.02.21.43.39.320.tiq
410MHz-2021.07.02.21.44.42.497.tiq
410MHz-2021.07.02.21.46.48.867.tiq
410MHz-2021.07.02.21.47.20.469.tiq
410MHz-2021.07.02.21.49.58.434.tiq	maybe something on the left
410MHz-2021.07.02.21.51.33.210.tiq
410MHz-2021.07.02.21.53.07.993.tiq
410MHz-2021.07.02.21.53.39.589.tiq	only peak on left
410MHz-2021.07.02.21.54.12.383.tiq
410MHz-2021.07.02.21.56.17.947.tiq
410MHz-2021.07.02.21.57.52.120.tiq
410MHz-2021.07.02.21.59.57.662.tiq


410MHz-2021.07.02.23.04.07.211.tiq
410MHz-2021.07.02.23.06.45.360.tiq
410MHz-2021.07.02.23.07.16.983.tiq
410MHz-2021.07.02.23.13.04.692.tiq
410MHz-2021.07.02.23.14.07.894.tiq
410MHz-2021.07.02.23.20.26.941.tiq	possible line at beginning
410MHz-2021.07.02.23.22.33.289.tiq
410MHz-2021.07.02.23.24.39.645.tiq	possible line at beginning
410MHz-2021.07.02.23.25.42.835.tiq
410MHz-2021.07.02.23.27.17.623.tiq
410MHz-2021.07.02.23.27.49.229.tiq
410MHz-2021.07.02.23.28.20.832.tiq
410MHz-2021.07.02.23.28.52.428.tiq
410MHz-2021.07.02.23.29.24.021.tiq
410MHz-2021.07.02.23.29.55.608.tiq
410MHz-2021.07.02.23.33.36.787.tiq
410MHz-2021.07.02.23.35.11.557.tiq
410MHz-2021.07.02.23.37.17.912.tiq	weak line at beginning
410MHz-2021.07.02.23.42.02.249.tiq
410MHz-2021.07.02.23.46.46.400.tiq	weak line on the left
410MHz-2021.07.02.23.47.17.981.tiq
410MHz-2021.07.02.23.48.21.143.tiq
410MHz-2021.07.02.23.48.52.727.tiq
410MHz-2021.07.02.23.53.36.878.tiq
410MHz-2021.07.02.23.55.43.122.tiq
410MHz-2021.07.02.23.56.14.685.tiq
410MHz-2021.07.02.23.59.55.607.tiq |
| Attachment 1: July2-21-0h-410MHz_AllSpectra_70Se.png
|
|
|
227
|
Sat Jul 3 03:41:48 2021 |
The remote Canadian eager beavers (Guy & Iris) | Analysis | Summed Spectra Summary |
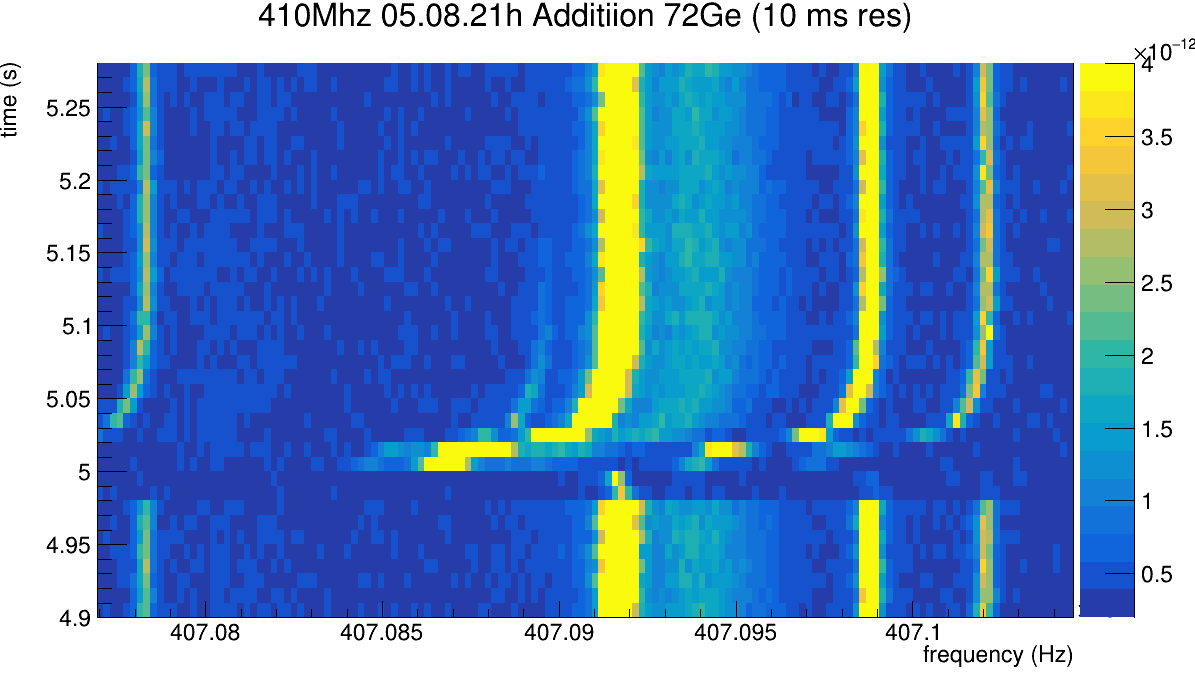
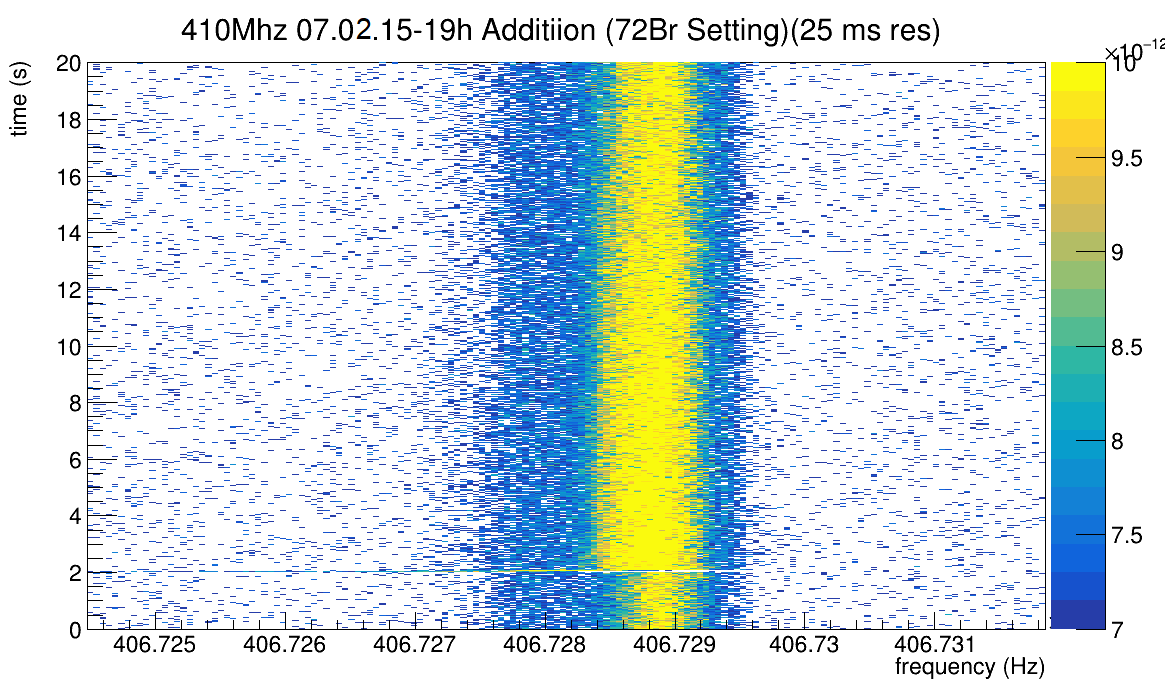
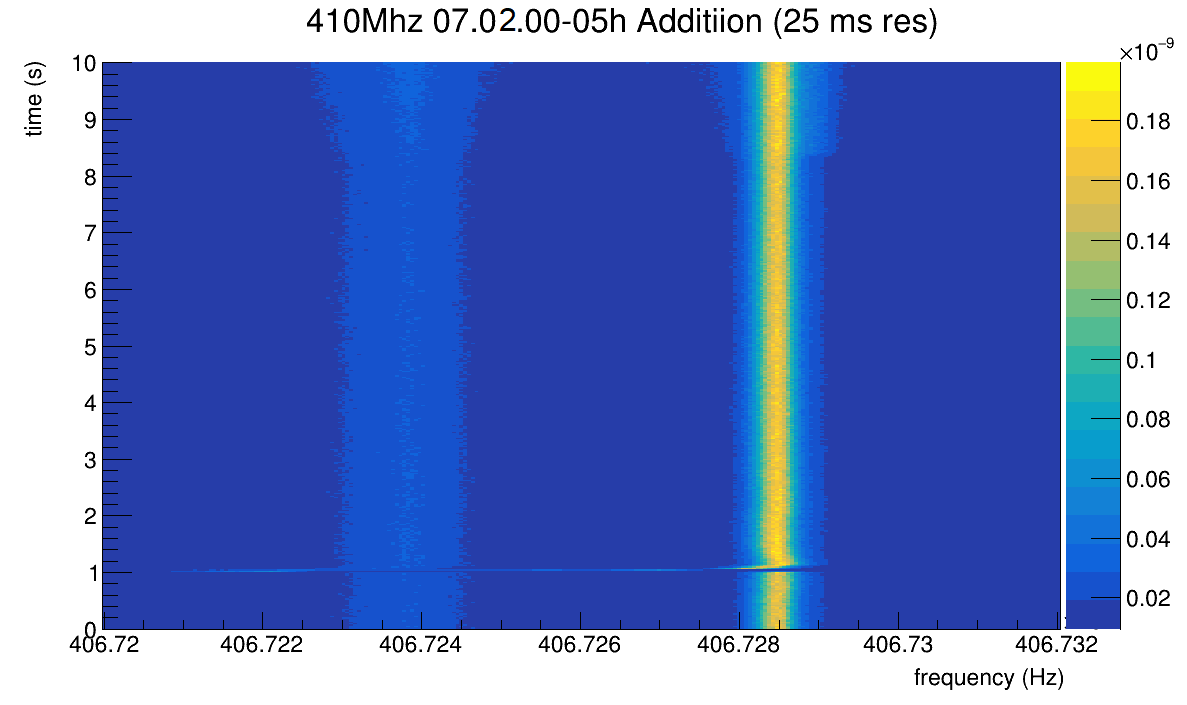
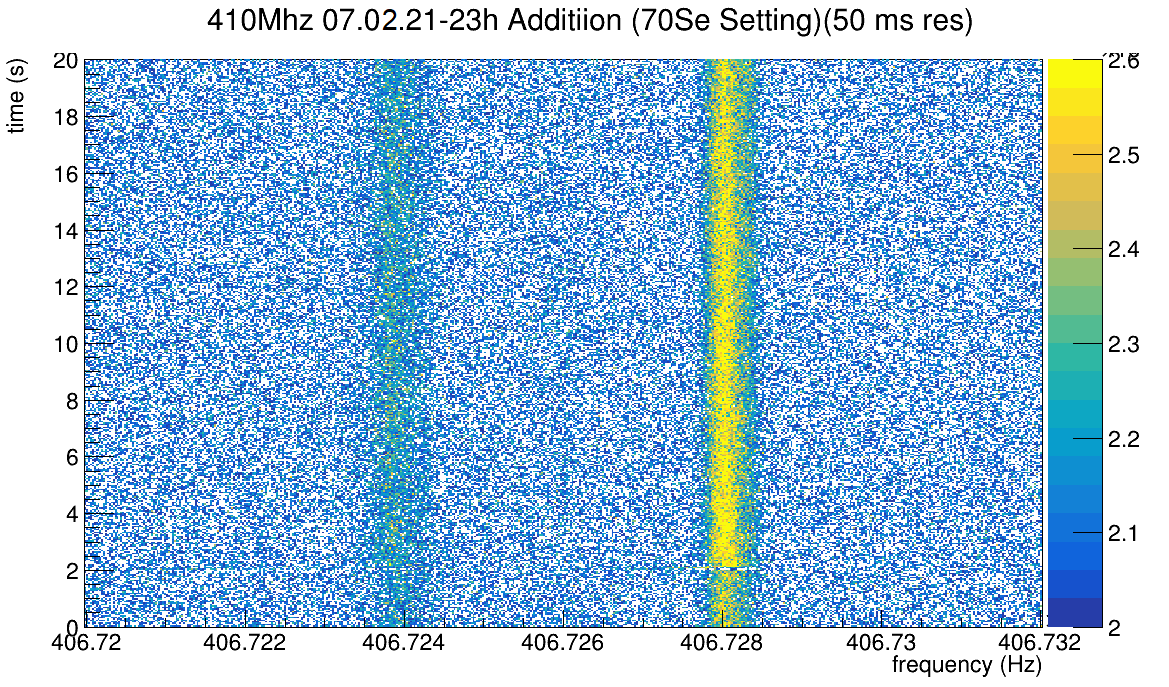
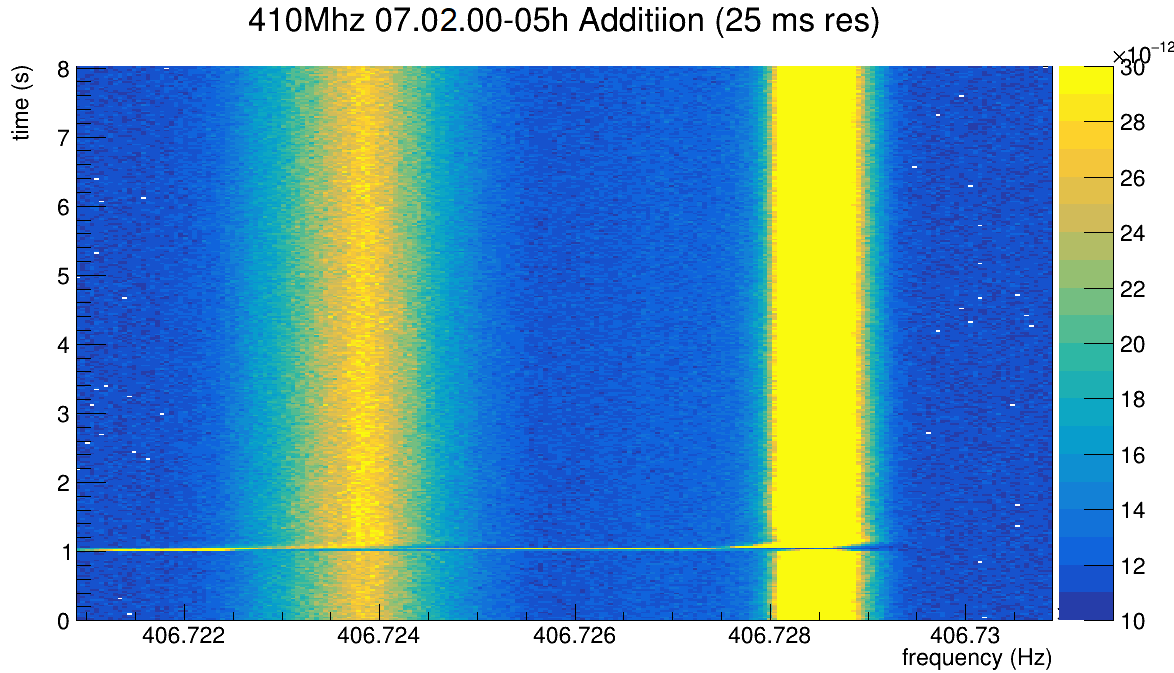
To summarise the method of bulk summing the spectra, I've created frequency vs time spectra by using the e143_analyser.py script to stack a series of -s slices. I applied it to some of last runs data with 72Ge, to the 72Br data, last night's less-scraped 70Se, and tonight's more-scraped 70Se, respectively.

A few comments: the 72Ge isomer trail is obvious, but I would never have found it in this total sum if I didn't know where to look. I had to turn up the contrast a lot before it was visible. The 72Br isomer is less obvious than in the single particle tracks, but it too is obvious. You can see that the peak is wider to left at the injection, and
then narrows out as the isomer decays. This is what we would see if the two peak weren't well resolved.
With that in mind, the 70Se data is challenging. We've established the broad peak is not the isomer as it is not present in the 245MHz detector., and the many single lines seen in the well-scraped data correspond in frequency exactly to this broad band. The 70Se peak doesn't get broader at the base at injection like 72Br, and there isn't any
line visible in the sum in between. I was nervous that the contrast might be the problem like with 72Ge, but I turned up the contrast on the less-scraped data, but no signal emerged.

So I conclude that if the 70Se isomer is to be found, it needs to be done on a shot-by-shot basis with comparison to the sum to see if it matches the intruder broad peak. |
| Attachment 1: 72Ge_sum.png
|
|
| Attachment 2: 72Br_sum.png
|
|
| Attachment 3: 70Se_not-scraped.png
|
|
| Attachment 4: 70Se_strong-scraped.png
|
|
| Attachment 5: 70Se_not-scraped_high_contrast.png
|
|
|
199
|
Fri Jul 2 06:33:48 2021 |
The remote Canadian beavers (Iris and Guy) | Analysis | Summary of spectra 4:00-6:00 (410 MHz) |
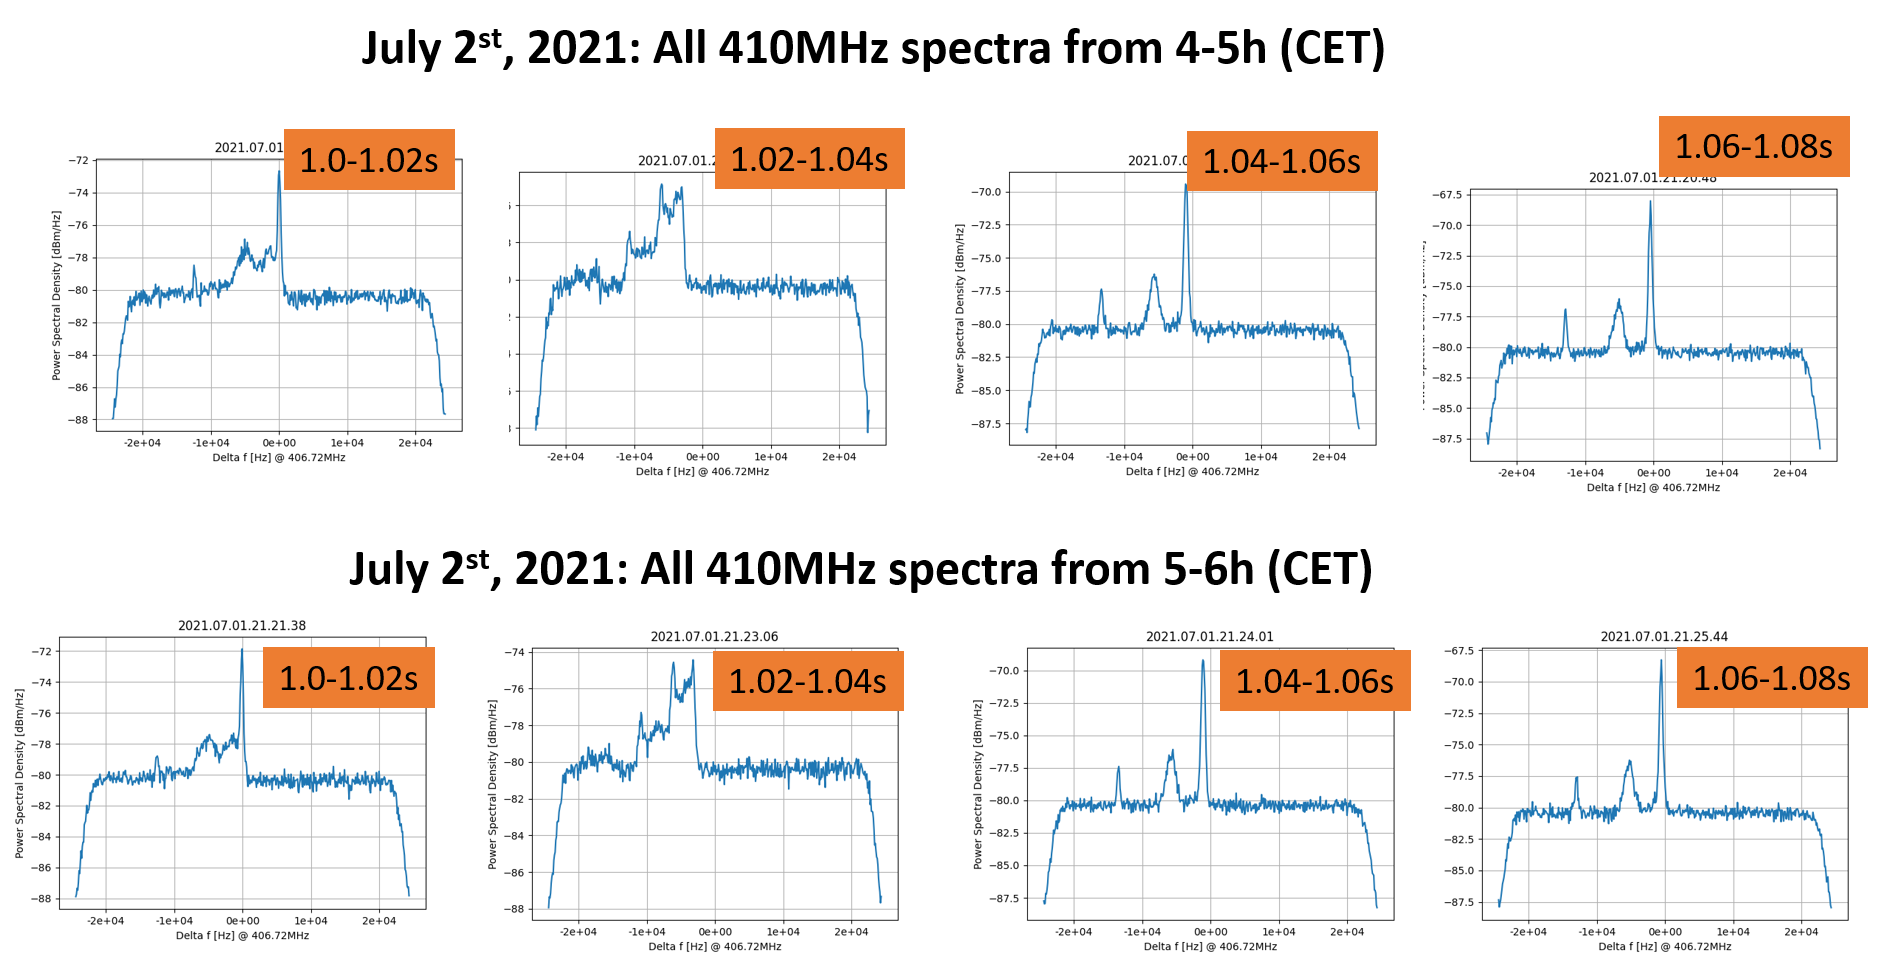
Same as before for 4-5h and 5-6h.
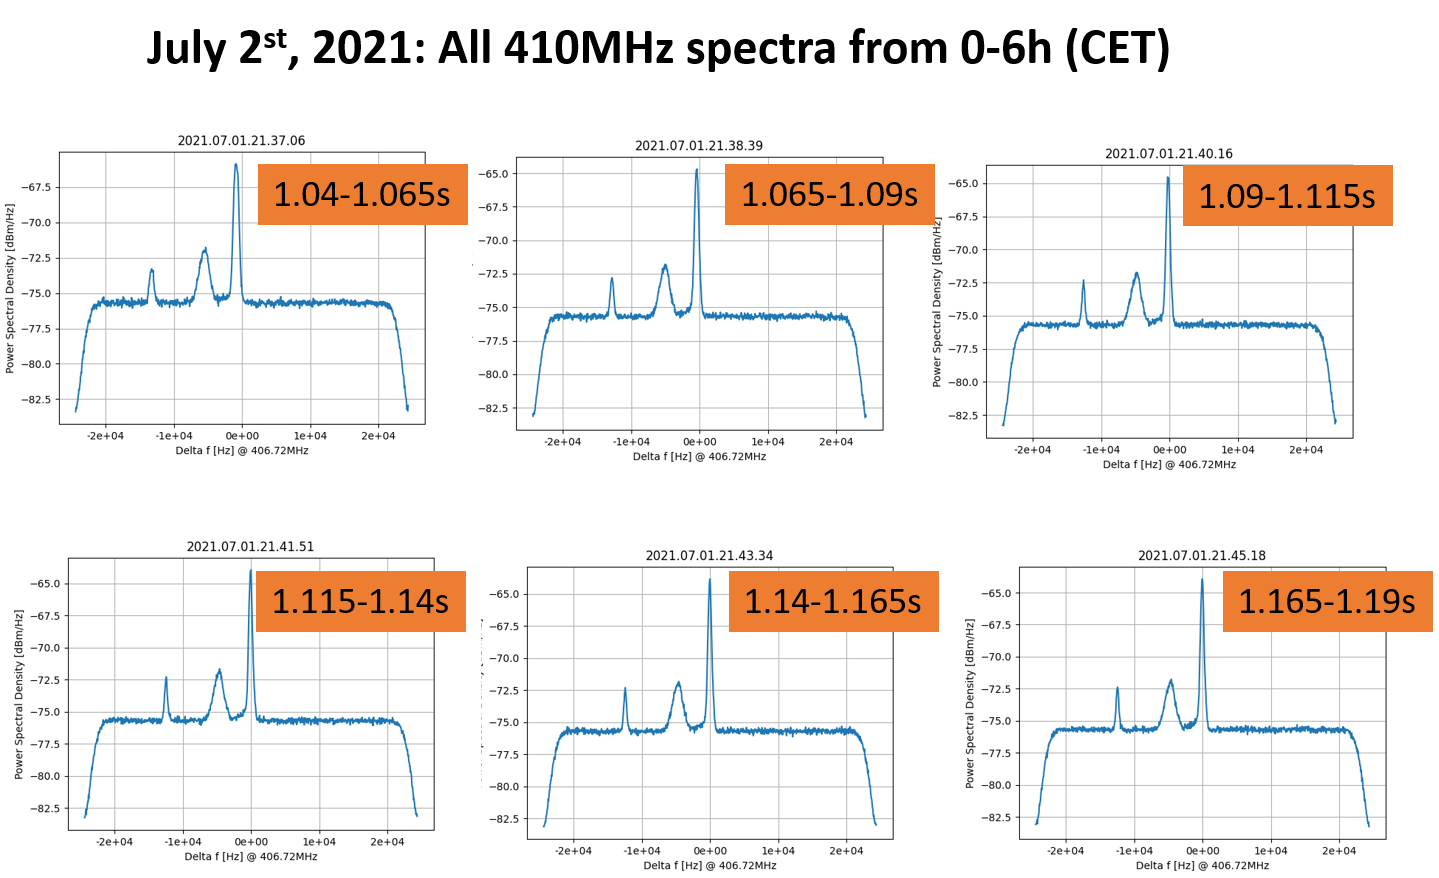
No isomer, I think :-( (Sorry, Wolfram!)

> Same as before for 0-4h on July 2nd.
>
> > Same as before, for 0-1h on July 2nd
> >
> >
> > > The last hour before the gas bottle change is summarized here.
> > > The first pic shows the 410 MHz spectra taken from 22-23h on the 410 MHz analyzer, in time slices of 0.1 sec from 0s-2s.
> > > The second pic shows the spectra in 20ms slices from 1s-1.16s.
> > >
> > > python3 e143_analyzer.py -s 1.0 -t 0.02 /home/dillmann/.../sparc-daq-02.gsi.de/E143-410MHz/410MHz-2021.07.01.22*
> > >
> > > The third spectra was taken in May, for comparison.
> > >
> > > I don't think we see anything... |
| Attachment 1: July2-4-6h-410MHz_Spectra_0.02s_steps_start_1s.png
|
|
|
190
|
Fri Jul 2 01:34:03 2021 |
The remote Canadian beavers (Iris, Guy) | Analysis | Summary of spectra 22:00-23:00 |
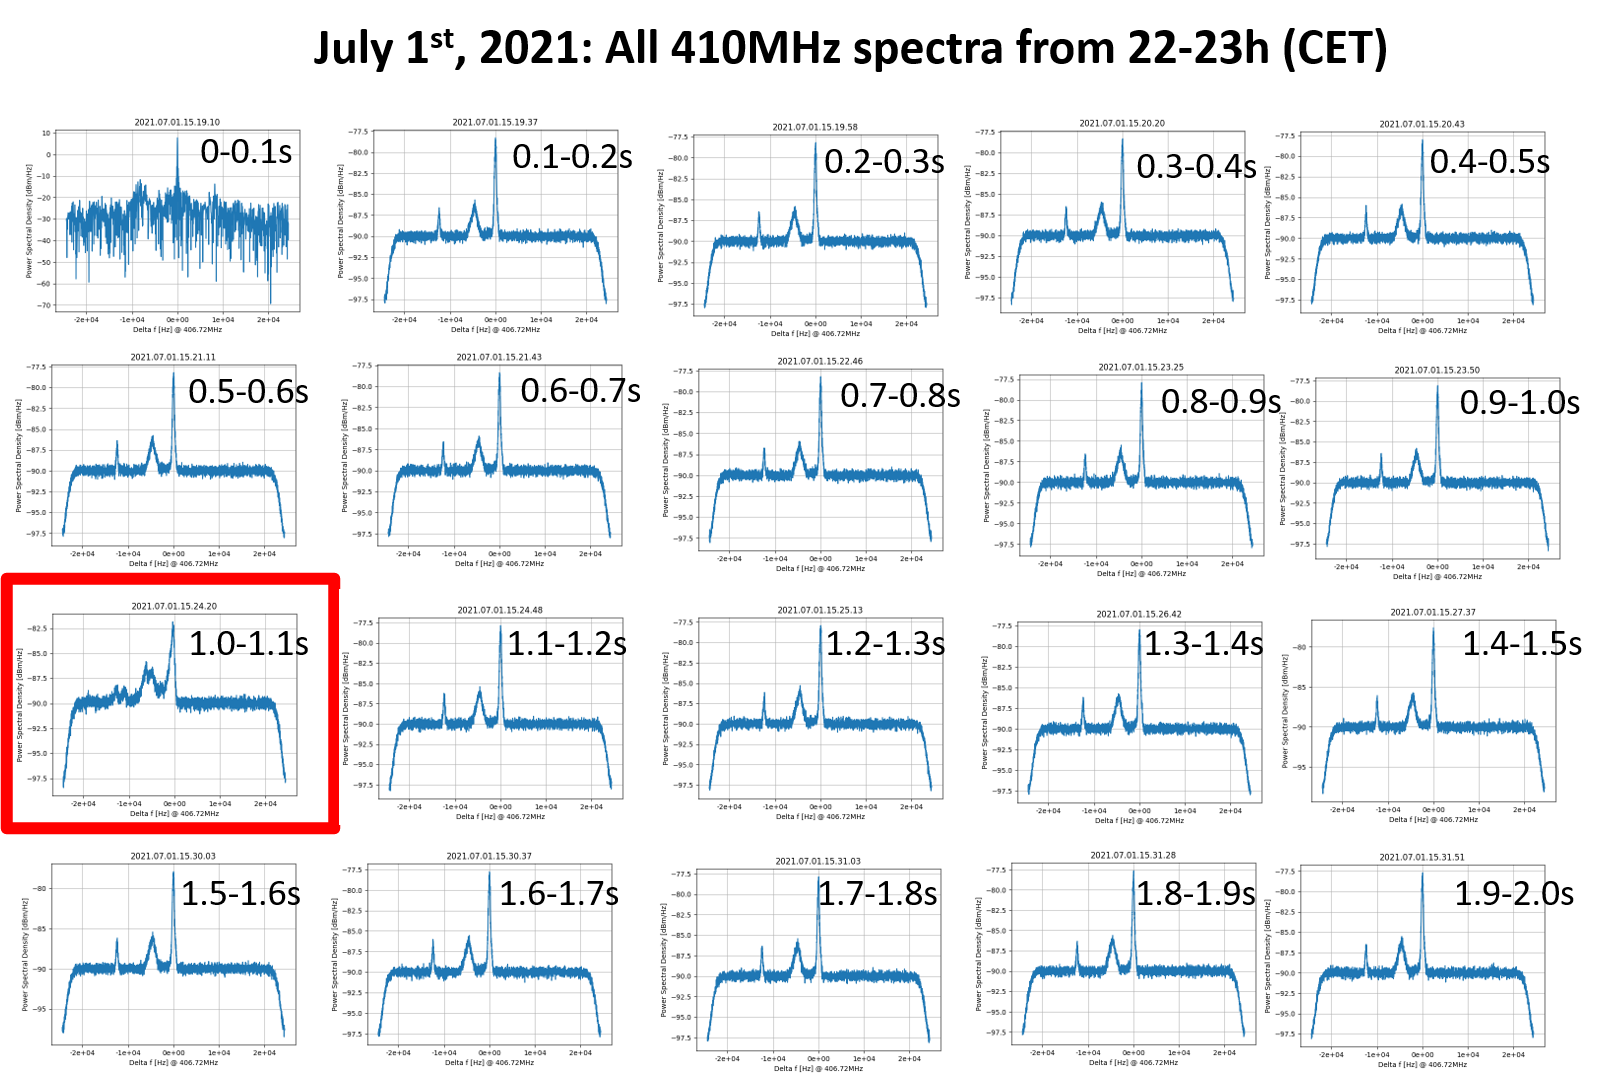
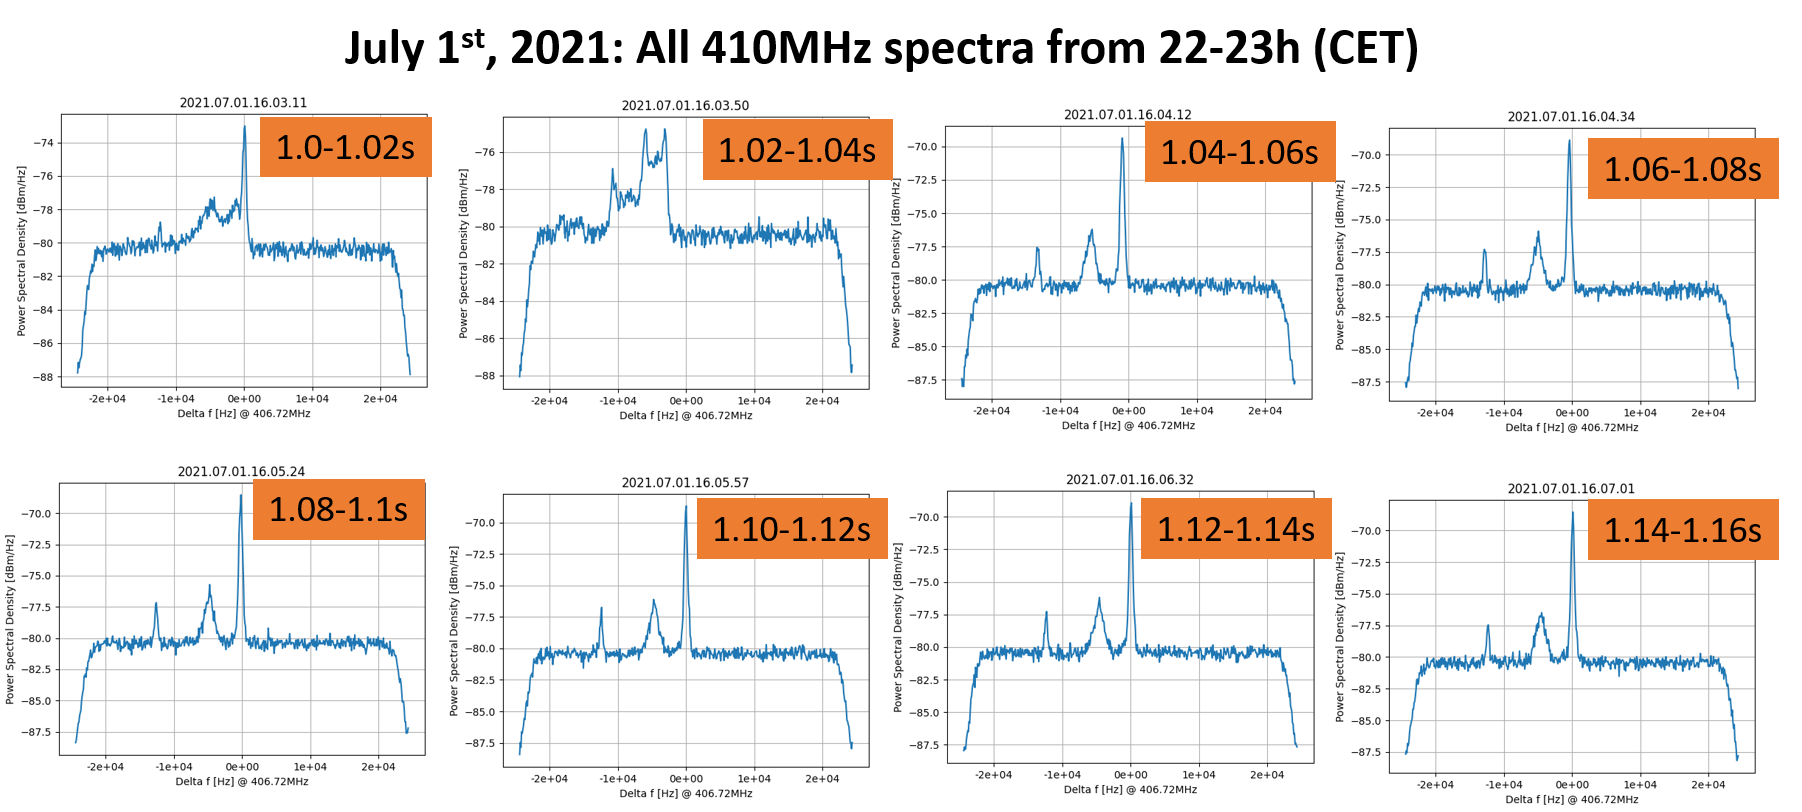
The last hour before the gas bottle change is summarized here.
The first pic shows the 410 MHz spectra taken from 22-23h on the 410 MHz analyzer, in time slices of 0.1 sec from 0s-2s.
The second pic shows the spectra in 20ms slices from 1s-1.16s.

python3 e143_analyzer.py -s 1.0 -t 0.02 /home/dillmann/.../sparc-daq-02.gsi.de/E143-410MHz/410MHz-2021.07.01.22*

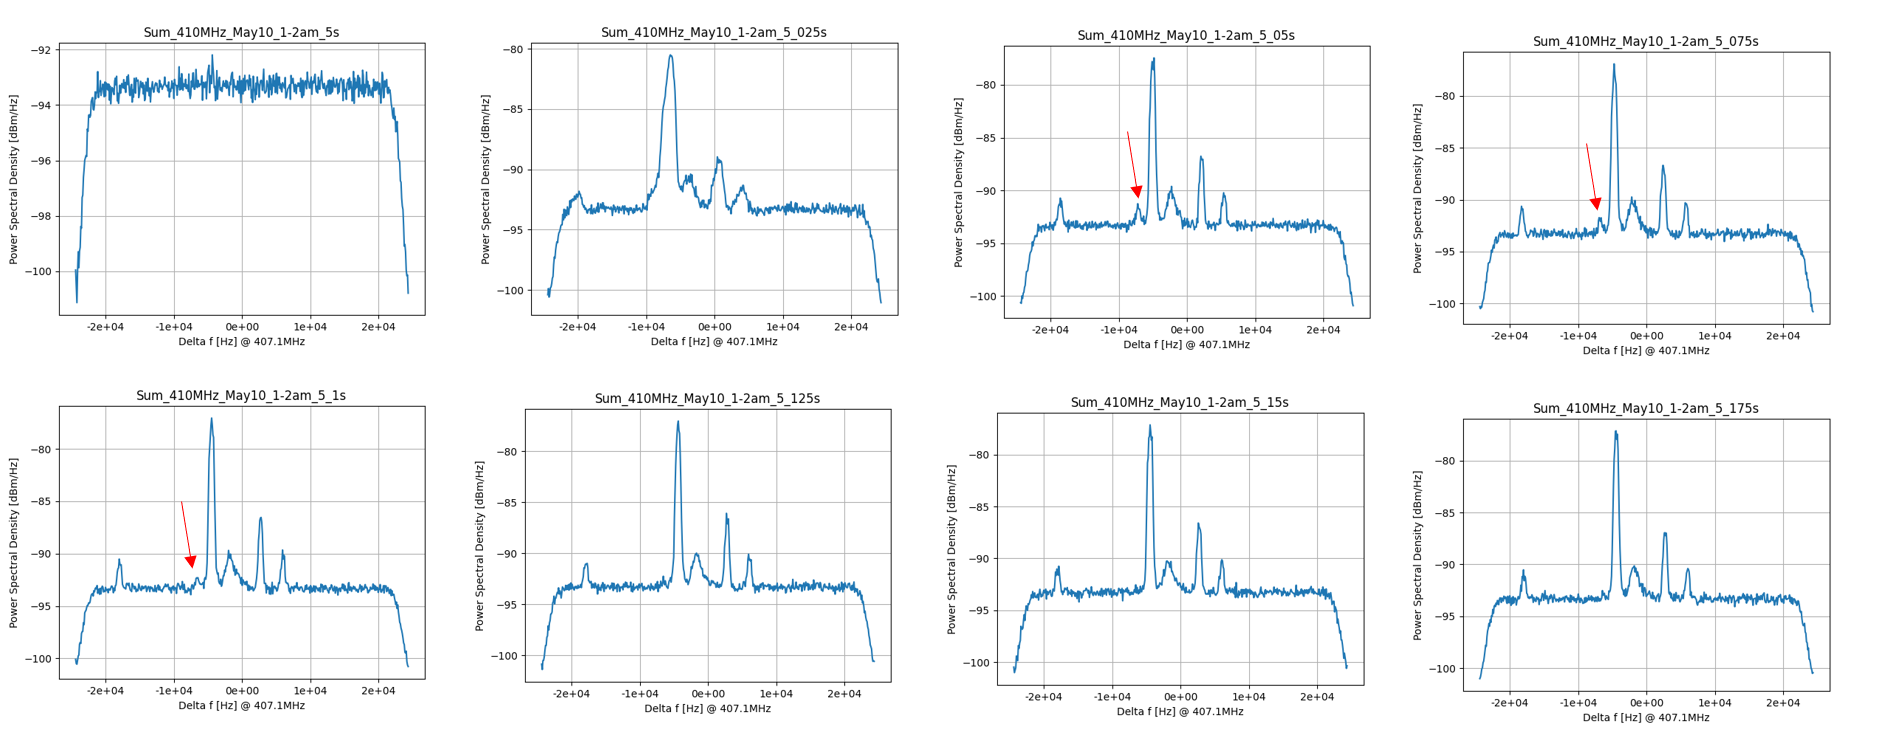
The third spectra was taken in May, for comparison.

I don't think we see anything... |
| Attachment 1: July1-22-23h-410MHz_Spectra_0.1s_steps.png
|
|
| Attachment 2: July1-22-23h-410MHz_Spectra_0.02s_steps_start_1s.png
|
|
| Attachment 3: Sum_410MHz_May10-1-2am_5_0-5_175s.png
|
|
|
201
|
Fri Jul 2 06:52:11 2021 |
The remote Canadian eager beavers (Iris and Guy) | Analysis | Summary of spectra 0:00-6:00 (410 MHz) |
Same as before but for 0-6h, 25ms time slices starting at 1.04s.

> Same as before for 4-5h and 5-6h.
> No isomer, I think :-( (Sorry, Wolfram!)
>
> > Same as before for 0-4h on July 2nd.
> >
> > > Same as before, for 0-1h on July 2nd
> > >
> > >
> > > > The last hour before the gas bottle change is summarized here.
> > > > The first pic shows the 410 MHz spectra taken from 22-23h on the 410 MHz analyzer, in time slices of 0.1 sec from 0s-2s.
> > > > The second pic shows the spectra in 20ms slices from 1s-1.16s.
> > > >
> > > > python3 e143_analyzer.py -s 1.0 -t 0.02 /home/dillmann/.../sparc-daq-02.gsi.de/E143-410MHz/410MHz-2021.07.01.22*
> > > >
> > > > The third spectra was taken in May, for comparison.
> > > >
> > > > I don't think we see anything... |
| Attachment 1: July2-4-0-6h-410MHz_AllSpectra_0.025s_steps_start_1.04s.png
|
|
|
196
|
Fri Jul 2 04:27:38 2021 |
The remote Canadian beavers (Iris and Guy) | Analysis | Summary of spectra 0:00-4:00 (410 MHz) |
Same as before for 0-4h on July 2nd.

> Same as before, for 0-1h on July 2nd
>
>
> > The last hour before the gas bottle change is summarized here.
> > The first pic shows the 410 MHz spectra taken from 22-23h on the 410 MHz analyzer, in time slices of 0.1 sec from 0s-2s.
> > The second pic shows the spectra in 20ms slices from 1s-1.16s.
> >
> > python3 e143_analyzer.py -s 1.0 -t 0.02 /home/dillmann/.../sparc-daq-02.gsi.de/E143-410MHz/410MHz-2021.07.01.22*
> >
> > The third spectra was taken in May, for comparison.
> >
> > I don't think we see anything... |
| Attachment 1: July2-0-4h-410MHz_Spectra_0.02s_steps_start_1s.png
|

|
|
193
|
Fri Jul 2 02:03:36 2021 |
The remote Canadian beavers (Iris, Guy) | Analysis | Summary of spectra 0:00-1:00 |
Same as before, for 0-1h on July 2nd


> The last hour before the gas bottle change is summarized here.
> The first pic shows the 410 MHz spectra taken from 22-23h on the 410 MHz analyzer, in time slices of 0.1 sec from 0s-2s.
> The second pic shows the spectra in 20ms slices from 1s-1.16s.
>
> python3 e143_analyzer.py -s 1.0 -t 0.02 /home/dillmann/.../sparc-daq-02.gsi.de/E143-410MHz/410MHz-2021.07.01.22*
>
> The third spectra was taken in May, for comparison.
>
> I don't think we see anything... |
| Attachment 1: July2-0-1h-410MHz_Spectra_0.02s_steps_start_1s.png
|

|