| ID |
Date |
Author |
Category |
Subject |
|
227
|
Sat Jul 3 03:41:48 2021 |
The remote Canadian eager beavers (Guy & Iris) | Analysis | Summed Spectra Summary |
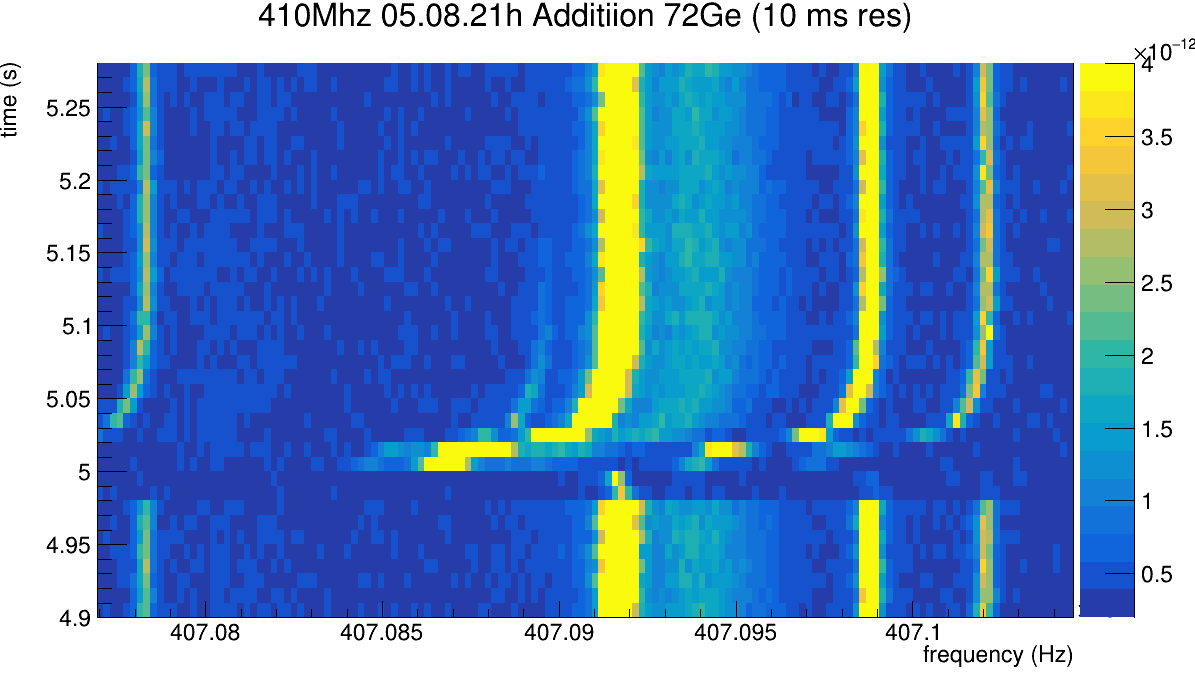
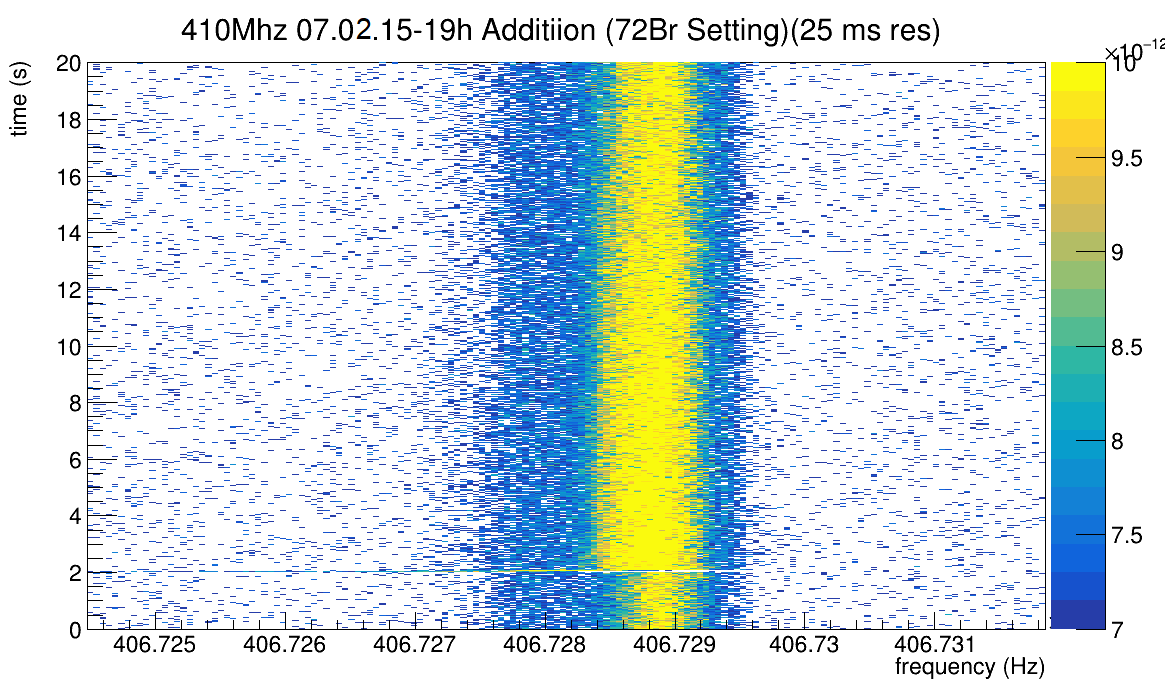
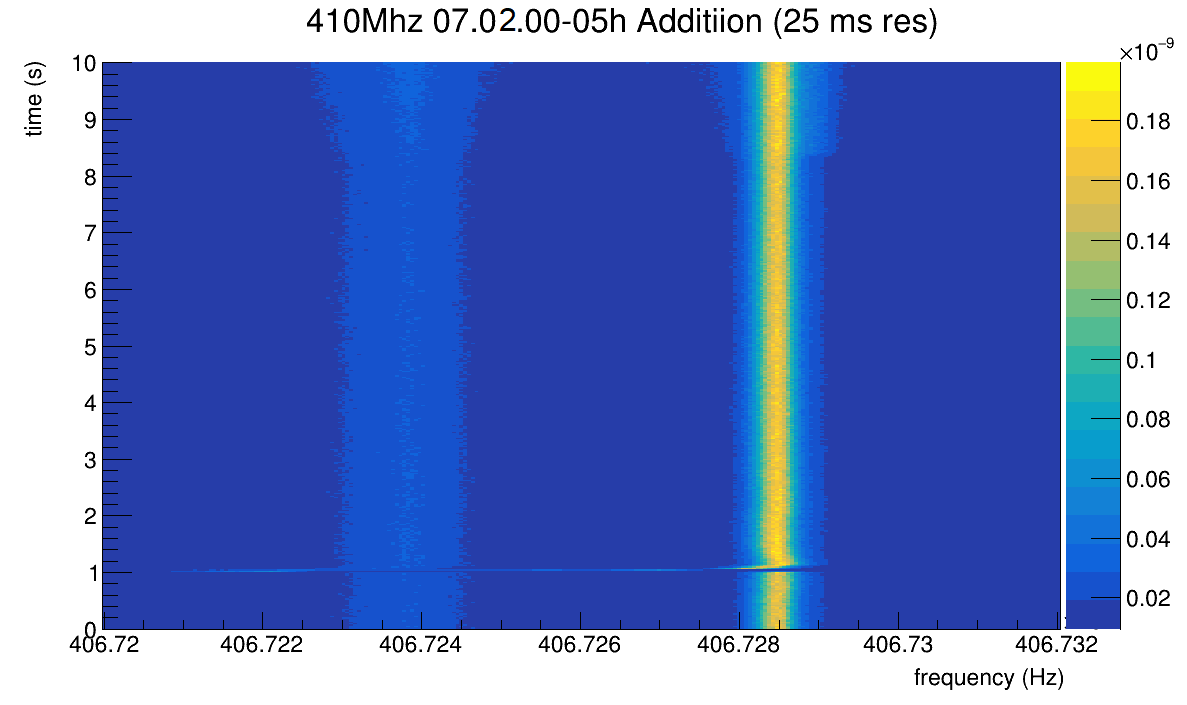
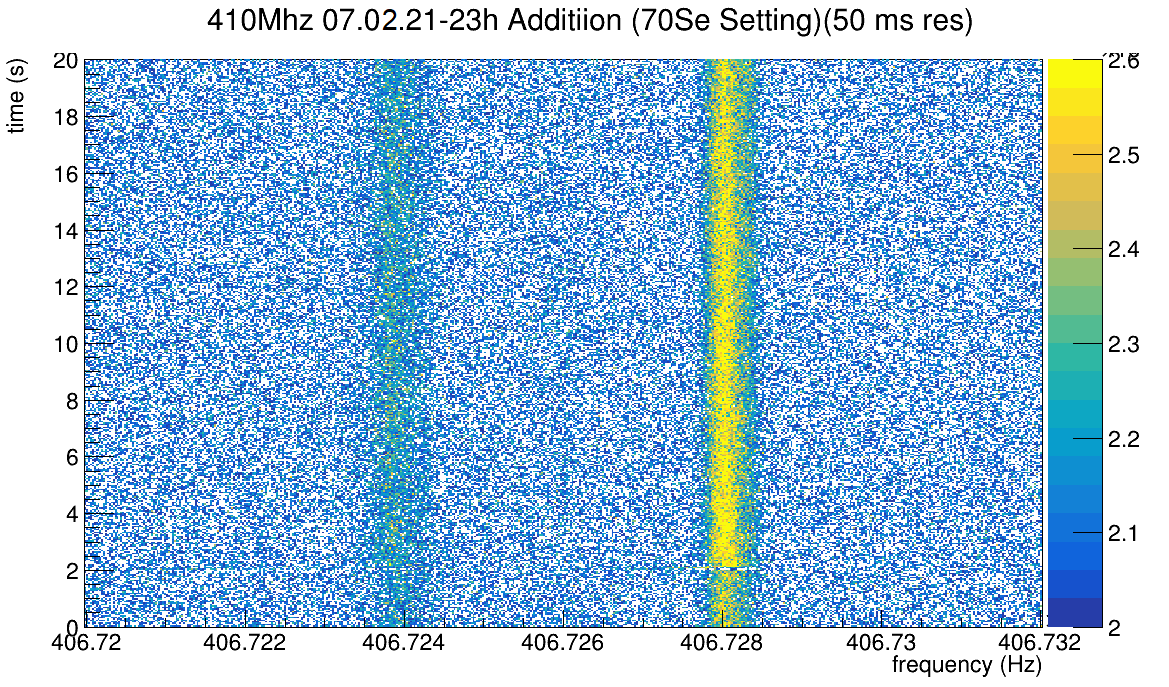
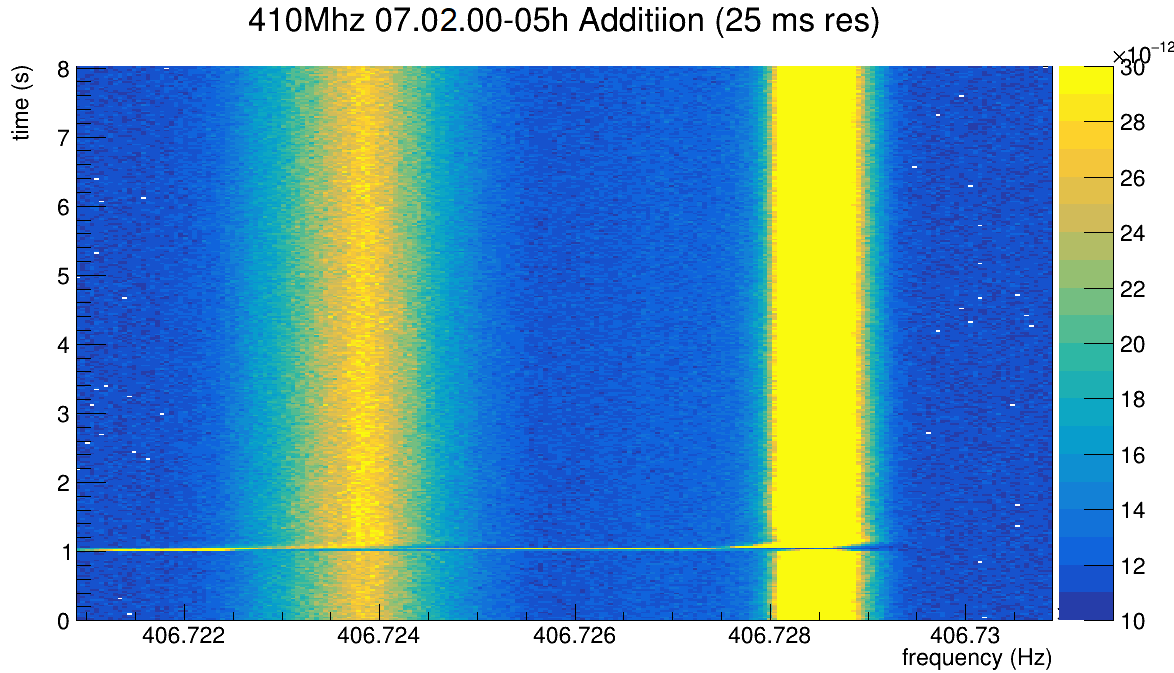
To summarise the method of bulk summing the spectra, I've created frequency vs time spectra by using the e143_analyser.py script to stack a series of -s slices. I applied it to some of last runs data with 72Ge, to the 72Br data, last night's less-scraped 70Se, and tonight's more-scraped 70Se, respectively.

A few comments: the 72Ge isomer trail is obvious, but I would never have found it in this total sum if I didn't know where to look. I had to turn up the contrast a lot before it was visible. The 72Br isomer is less obvious than in the single particle tracks, but it too is obvious. You can see that the peak is wider to left at the injection, and
then narrows out as the isomer decays. This is what we would see if the two peak weren't well resolved.
With that in mind, the 70Se data is challenging. We've established the broad peak is not the isomer as it is not present in the 245MHz detector., and the many single lines seen in the well-scraped data correspond in frequency exactly to this broad band. The 70Se peak doesn't get broader at the base at injection like 72Br, and there isn't any
line visible in the sum in between. I was nervous that the contrast might be the problem like with 72Ge, but I turned up the contrast on the less-scraped data, but no signal emerged.

So I conclude that if the 70Se isomer is to be found, it needs to be done on a shot-by-shot basis with comparison to the sum to see if it matches the intruder broad peak. |
| Attachment 1: 72Ge_sum.png
|
|
| Attachment 2: 72Br_sum.png
|
|
| Attachment 3: 70Se_not-scraped.png
|
|
| Attachment 4: 70Se_strong-scraped.png
|
|
| Attachment 5: 70Se_not-scraped_high_contrast.png
|
|
|
228
|
Sat Jul 3 04:33:50 2021 |
The remote Canadian eager beavers (Guy & Iris) | Analysis | Slight shift in 70Se frequency |
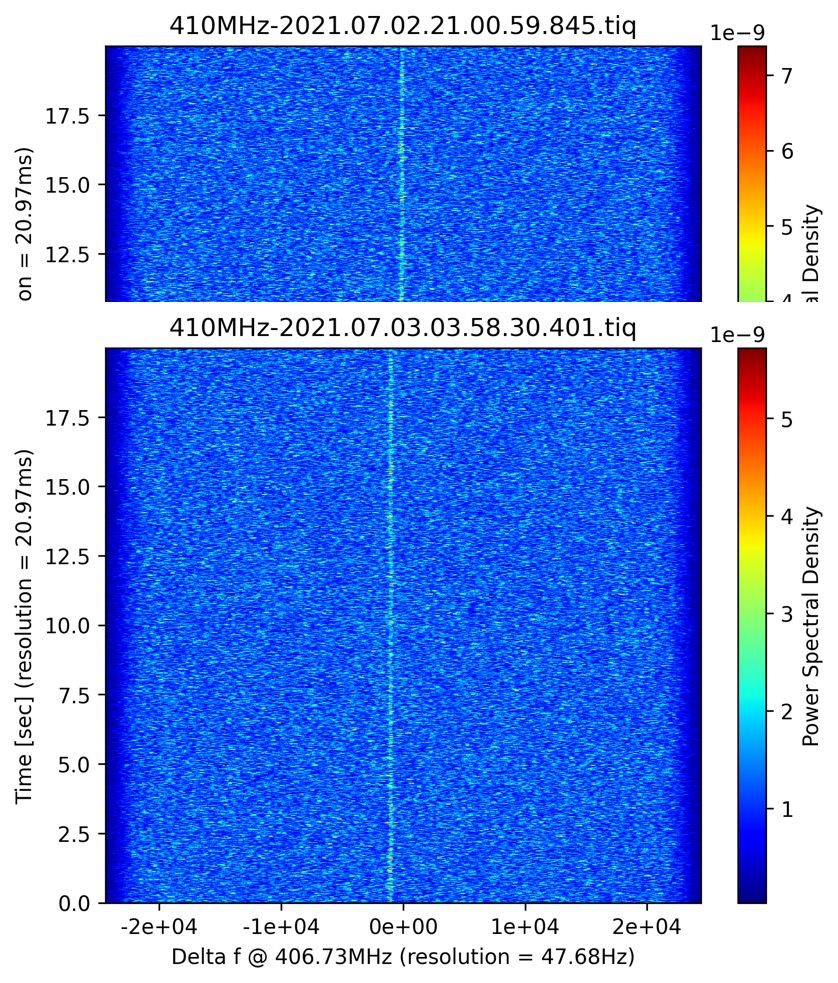
Looks like the beam is slightly drifting...the 70Se peak frequency is slightly shifted to the left, by ~0.5 kHz compared to earlier spectra. Might be a problem with the analyzer (?) or the storage ring energy (slightly lower?)... nothing drastical but to be observed. |
| Attachment 1: 70Se-shift-21h-4h.png
|
|
|
230
|
Sat Jul 3 06:48:38 2021 |
The remote Canadian eager beavers (Guy & Iris) | Analysis | Closer potential isomer tracks |
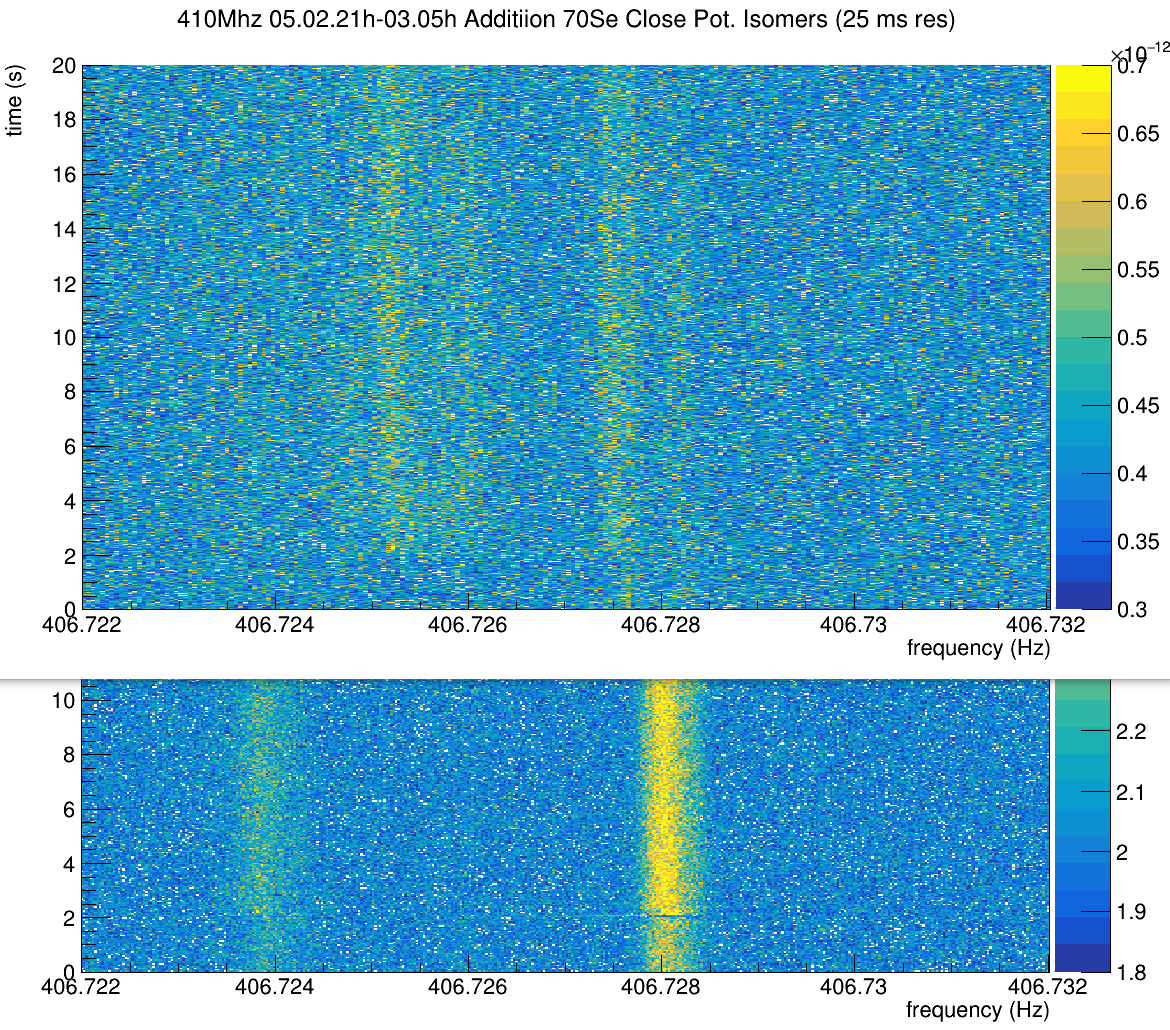
After looking through >800 shots from Jul 2nd 21h to Jul 3rd 05h, we couldn't find a single example of a "smoking gun" isomer decay. I.e. I'm talking about the examples Liliana posted earlier. We did find many examples (roughly 10%) where the ion track spontaneously
disappeared, but this shouldn't be the isomer as there was no frequency shift.

We did, as Iris mentioned, observe some line "in-between" the broad peak unique to the 410MHz, and listed them here (https://triumfoffice365-my.sharepoint.com/:x:/g/personal/dillmann_triumf_ca/EdKsMfSC3AlHopA36PdLBlsBE2MCSY0hh5qIsuau5HFBmg?rtime=Z2os4J492Ug).
I then proceeded to sum these files to see if they lined up. The result it attached, with the previous total sum from 21-00h Jul 2nd at the bottom for comparison. It seems the 70Se line has shifted, this is observed in the other shots too. However, despite the low
statistics, these other shots don't line up with the broad peak identified before, although they don't line up well with each other individually either.
In either case, we think these files might be worth offline analysis as they're the only possible hint of the 70Se isomer so far. |
| Attachment 1: 70Se_close_pot_isomers.png
|
|
|
Draft
|
Sat Jul 3 06:49:55 2021 |
The remote Canadian eager beavers (Guy &Iris) | Analysis | List of possible spectra with isomer decay |
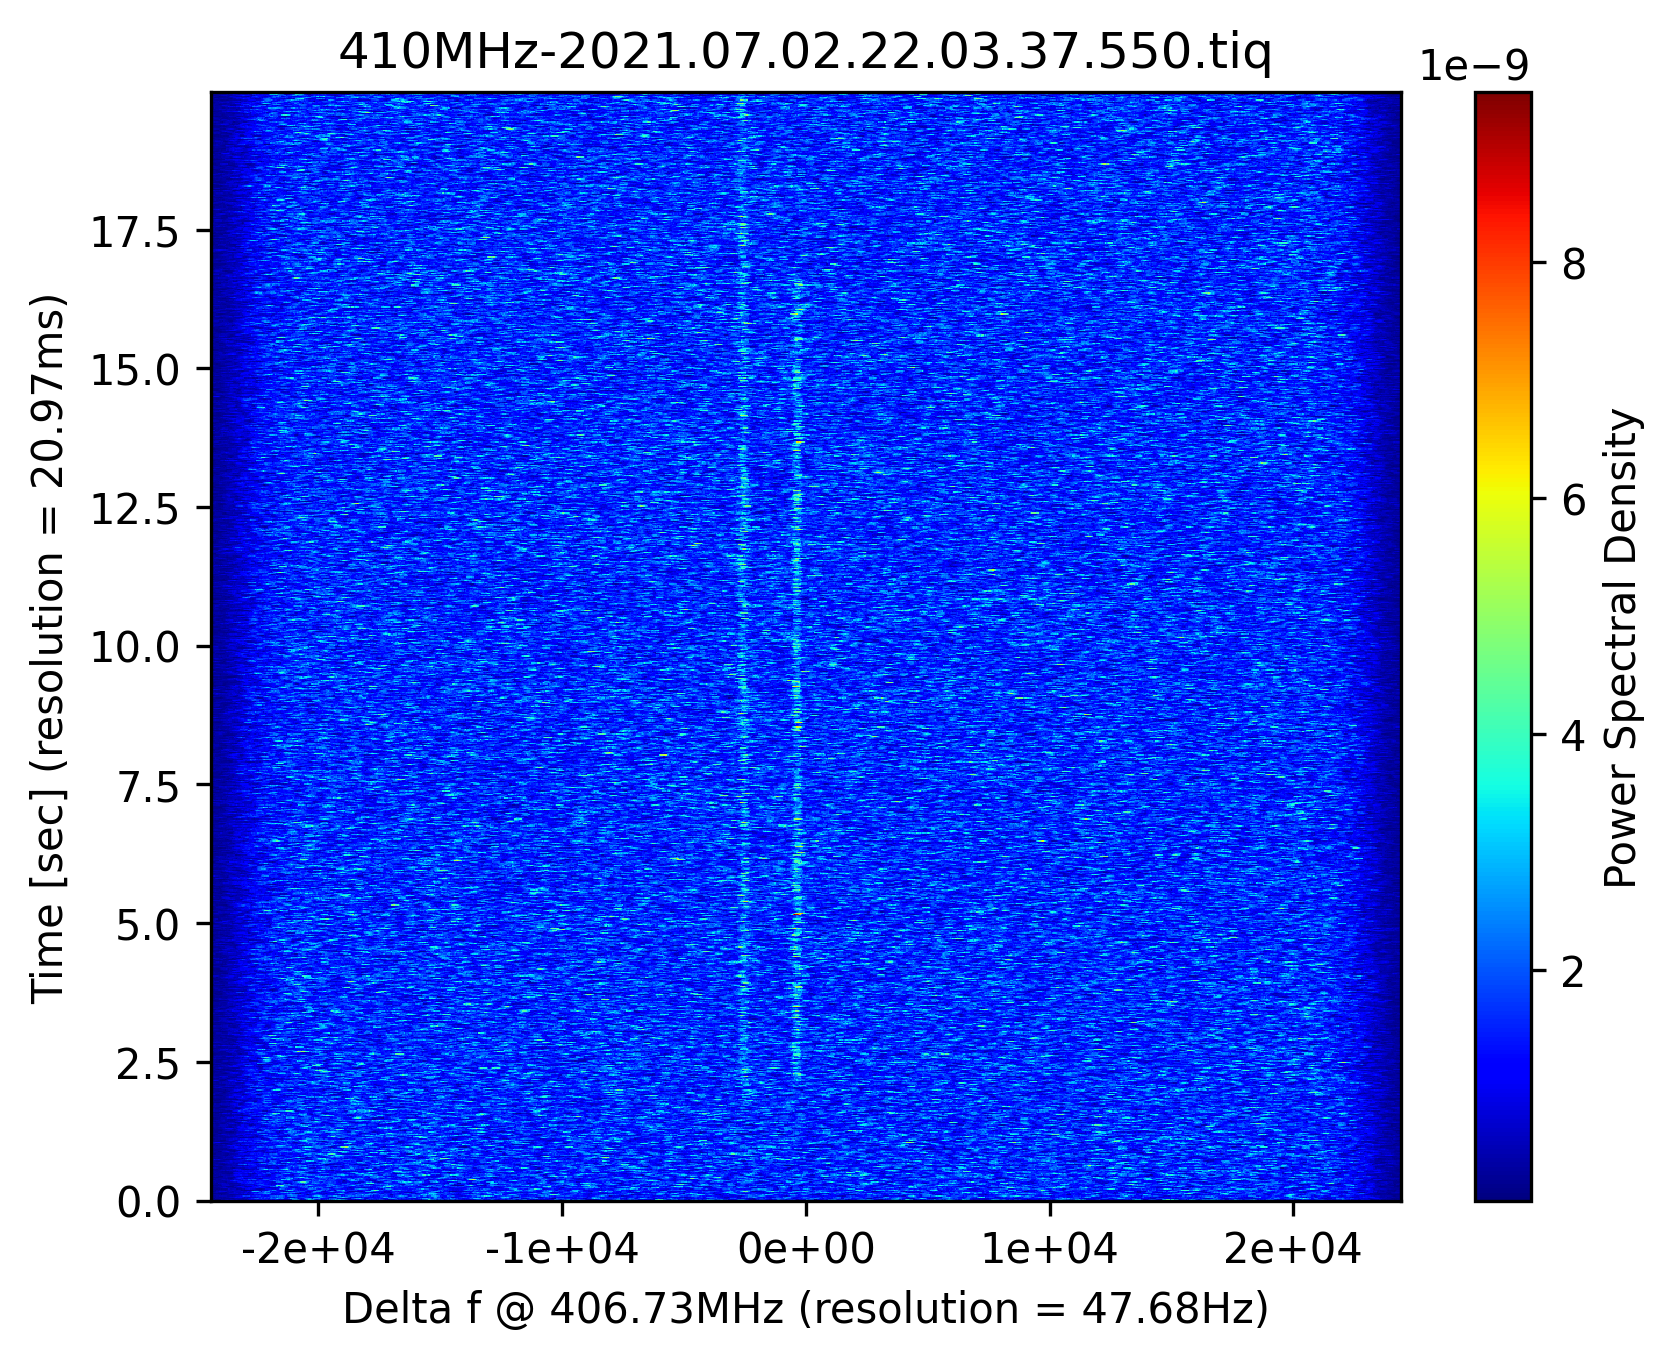
Attached is an example for the possible isomer (on the left) next to the 70Se (right).

Here's the list with the files to look at, btw 21:00-6:30. Further analysis needs to be done offline. The slight frequency shift overnight made it a bit harder to see, unfortunately.

Name	Comment
410MHz-2021.07.02.21.18.54.456.tiq
410MHz-2021.07.02.21.27.19.948.tiq	slightly different freq
410MHz-2021.07.02.21.33.07.438.tiq
410MHz-2021.07.02.21.42.36.139.tiq	slightly different freq
410MHz-2021.07.02.21.52.04.801.tiq
410MHz-2021.07.02.22.03.37.550.tiq	appears at ~3.5s
410MHz-2021.07.02.22.12.31.601.tiq	slightly different freq
410MHz-2021.07.02.22.30.24.641.tiq	slightly different freq
410MHz-2021.07.02.22.40.24.894.tiq	triplet
410MHz-2021.07.02.23.04.38.838.tiq
410MHz-2021.07.03.01.00.29.856.tiq	slightly different freq
410MHz-2021.07.03.01.29.59.709.tiq	slightly different freq
410MHz-2021.07.03.01.45.47.532.tiq
410MHz-2021.07.03.01.47.22.303.tiq	a bit more shifted to the left
410MHz-2021.07.03.01.54.44.606.tiq
410MHz-2021.07.03.02.14.45.610.tiq	a bit more shifted to the left
410MHz-2021.07.03.02.28.58.637.tiq	slightly different freq
410MHz-2021.07.03.02.55.49.838.tiq	a bit more shifted to the left
410MHz-2021.07.03.03.15.50.713.tiq	a bit more shifted to the left
410MHz-2021.07.03.03.55.52.357.tiq	slightly different freq
410MHz-2021.07.03.03.56.55.568.tiq	a bit more shifted to the left

410MHz-2021.07.03.01.11.33.702.tiq
410MHz-2021.07.03.01.20.31.004.tiq
410MHz-2021.07.03.00.07.18.136.tiq
410MHz-2021.07.03.00.42.04.236.tiq
410MHz-2021.07.03.00.45.45.337.tiq
410MHz-2021.07.03.04.22.44.303.tiq
410MHz-2021.07.03.04.26.25.486.tiq
410MHz-2021.07.03.04.45.54.495.tiq
410MHz-2021.07.03.04.49.35.705.tiq

410MHz-2021.07.03.05.25.24.517.tiq
410MHz-2021.07.03.05.58.03.370.tiq
410MHz-2021.07.03.06.19.07.475.tiq |
| Attachment 1: 410MHz-2021.07.02.22.03.37.550.tiq.png
|
|
|
233
|
Sat Jul 3 07:35:31 2021 |
The remote Canadian eager beaver (Iris) | Analysis | Closer potential isomer tracks |
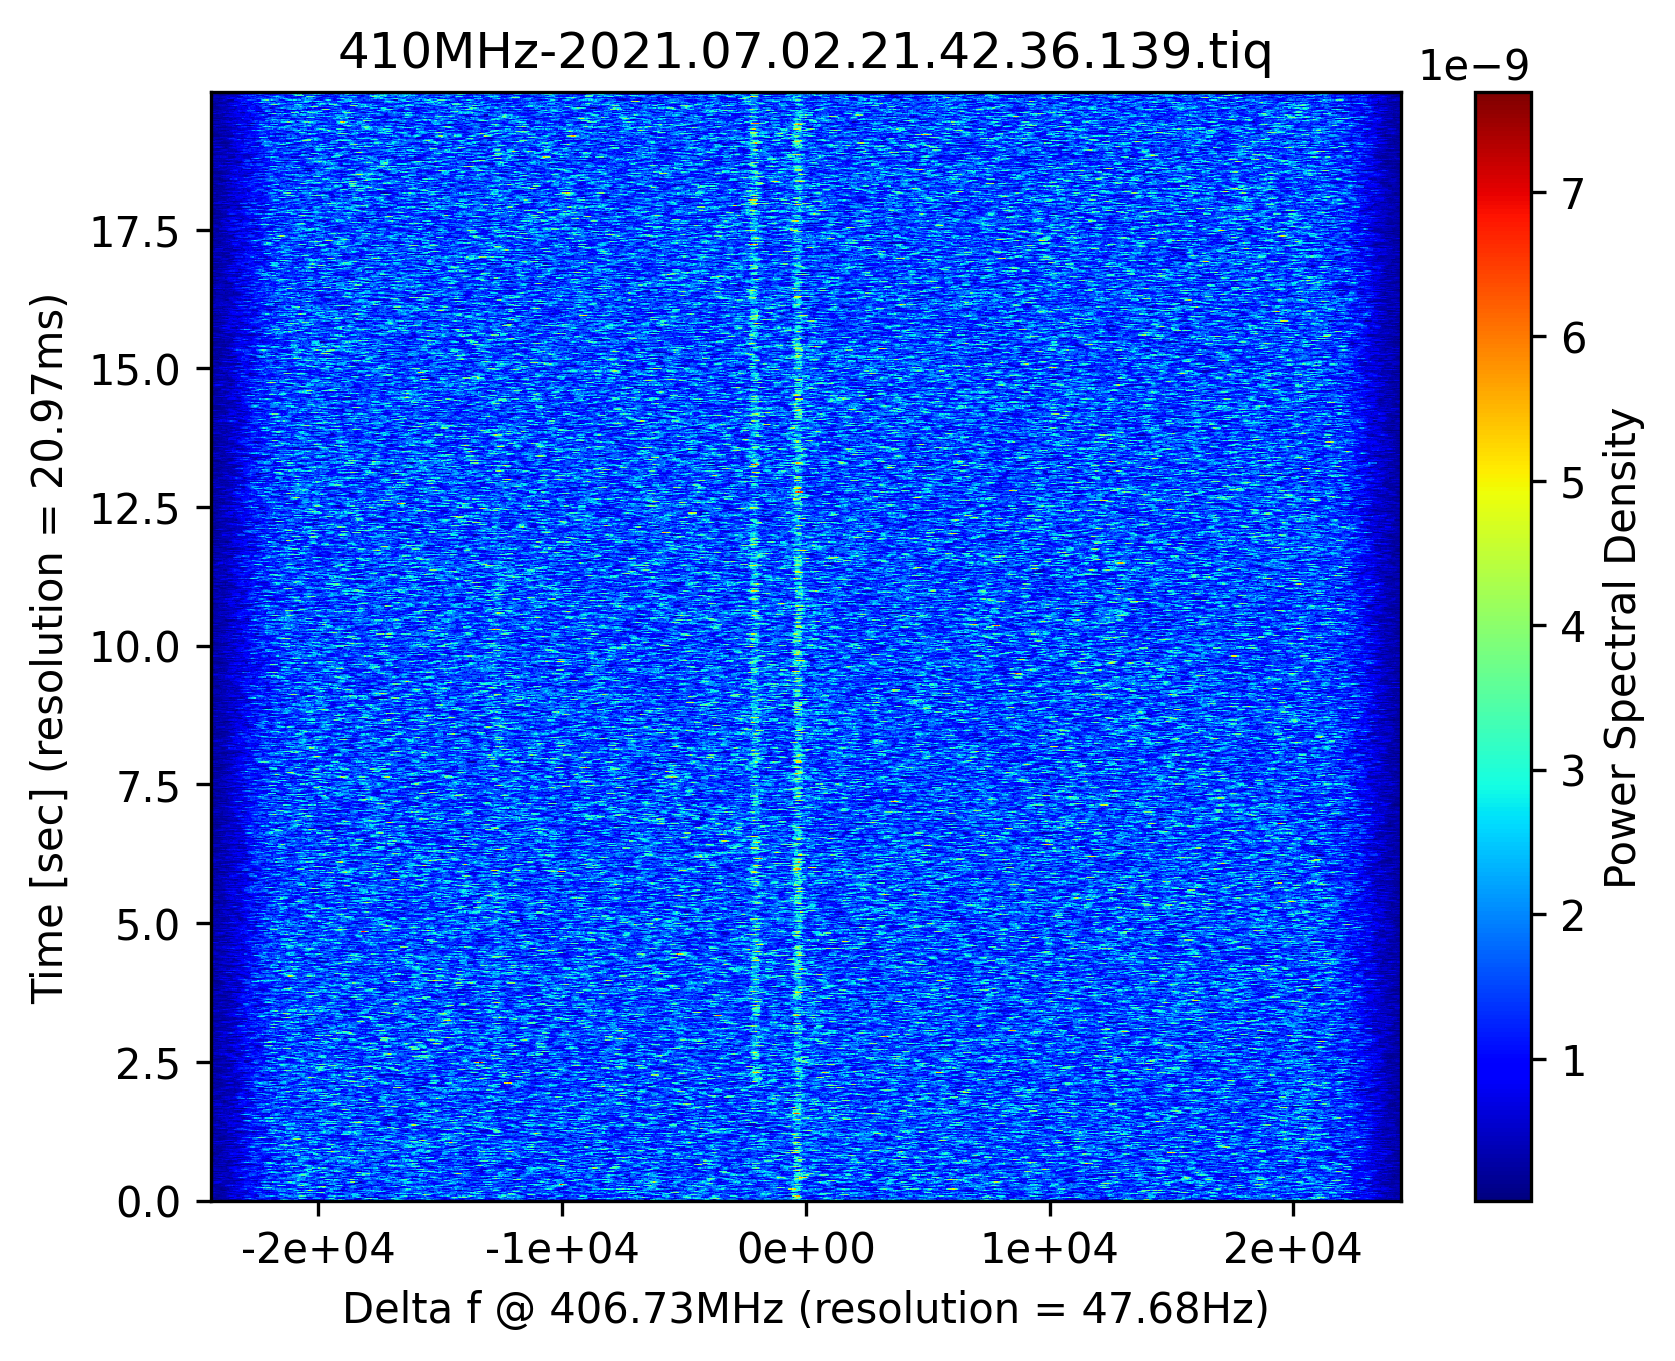
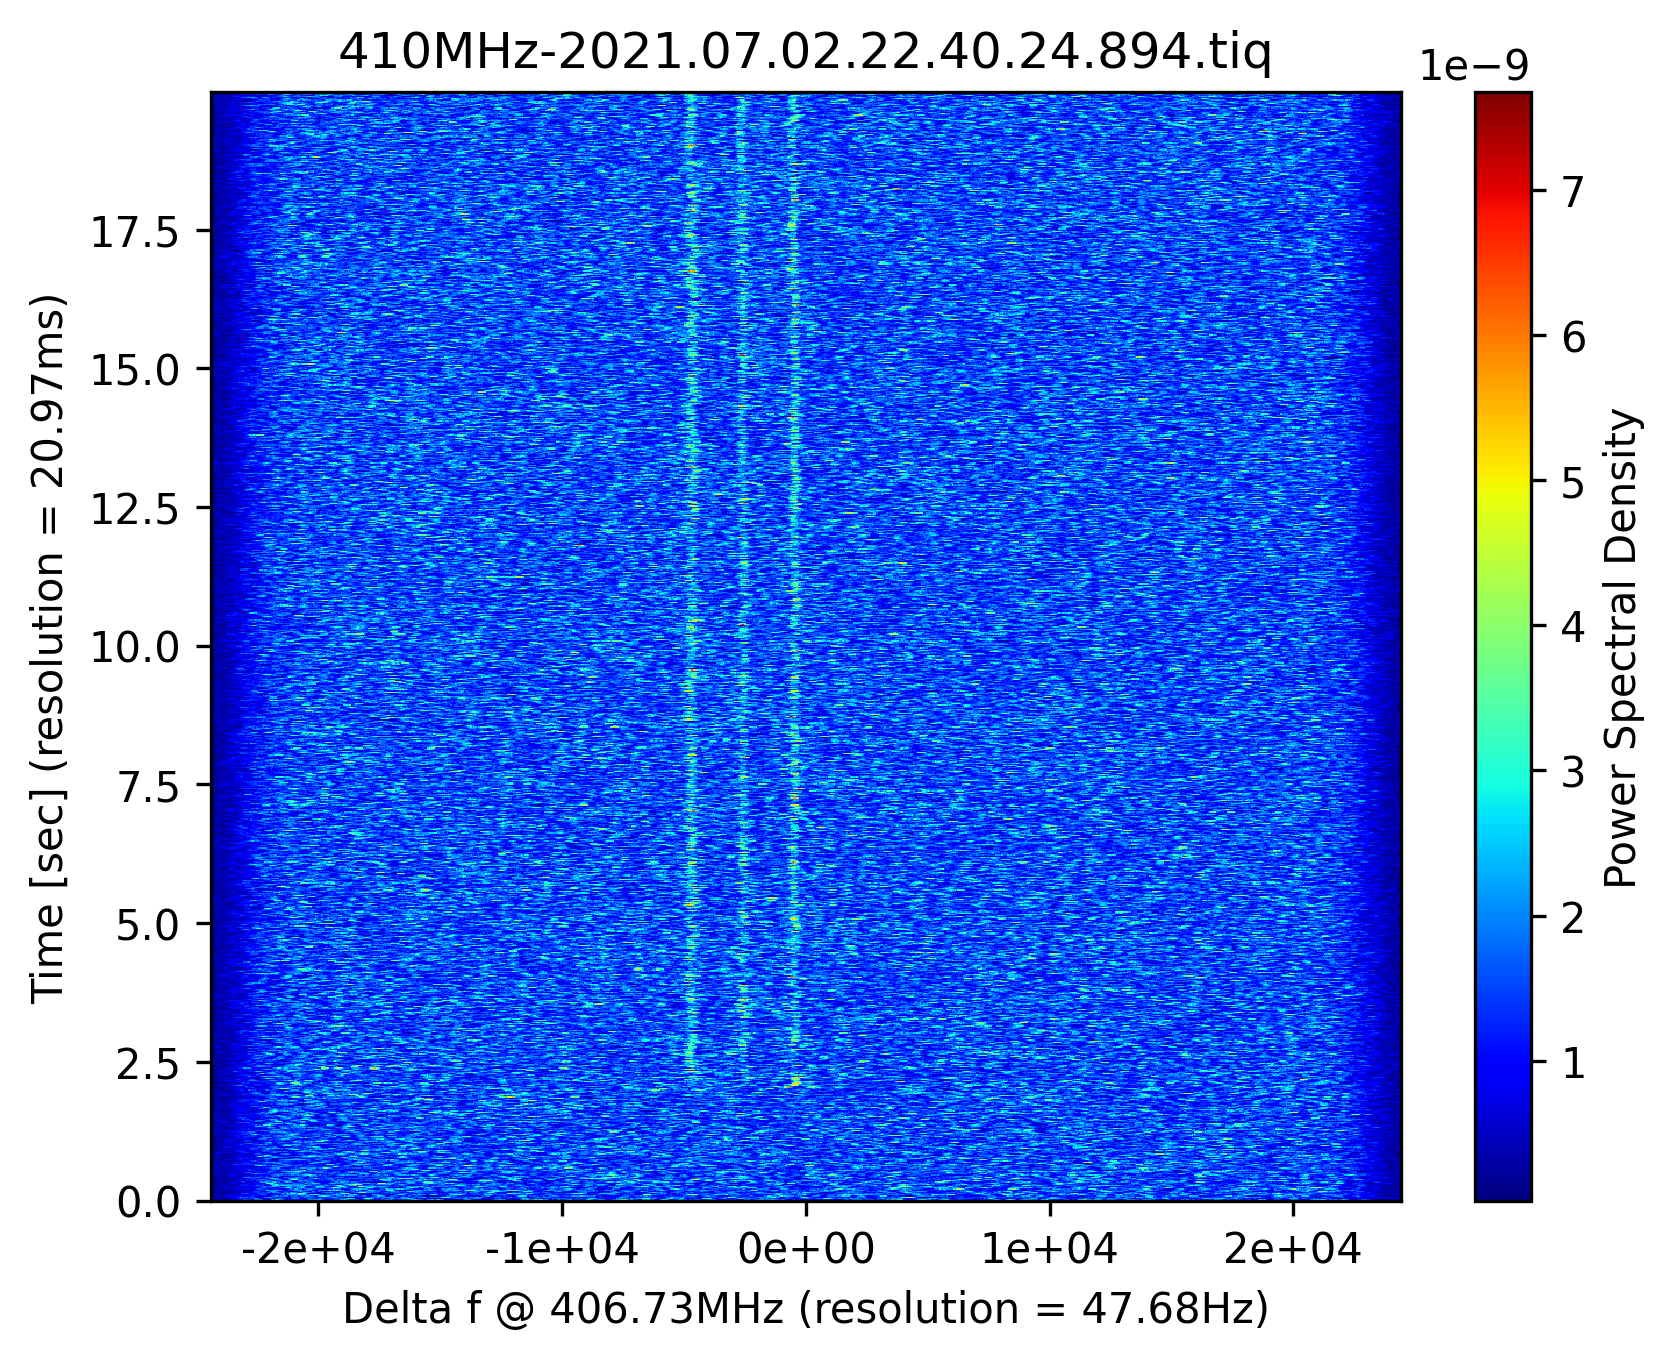
Here's a list of the spectra to look at for the potential isomer, taken btw 21:00 on July 2nd and 6:30 on July 3rd. Two examples attached.

Name	Comment
410MHz-2021.07.02.21.18.54.456.tiq
410MHz-2021.07.02.21.27.19.948.tiq	slightly different freq
410MHz-2021.07.02.21.33.07.438.tiq
410MHz-2021.07.02.21.42.36.139.tiq	slightly different freq
410MHz-2021.07.02.21.52.04.801.tiq
410MHz-2021.07.02.22.03.37.550.tiq	appears at ~3.5s
410MHz-2021.07.02.22.12.31.601.tiq	slightly different freq
410MHz-2021.07.02.22.30.24.641.tiq	slightly different freq
410MHz-2021.07.02.22.40.24.894.tiq	triplet
410MHz-2021.07.02.23.04.38.838.tiq
410MHz-2021.07.03.01.00.29.856.tiq	slightly different freq
410MHz-2021.07.03.01.29.59.709.tiq	slightly different freq
410MHz-2021.07.03.01.45.47.532.tiq
410MHz-2021.07.03.01.47.22.303.tiq	a bit more shifted to the left
410MHz-2021.07.03.01.54.44.606.tiq
410MHz-2021.07.03.02.14.45.610.tiq	a bit more shifted to the left
410MHz-2021.07.03.02.28.58.637.tiq	slightly different freq
410MHz-2021.07.03.02.55.49.838.tiq	a bit more shifted to the left
410MHz-2021.07.03.03.15.50.713.tiq	a bit more shifted to the left
410MHz-2021.07.03.03.55.52.357.tiq	slightly different freq
410MHz-2021.07.03.03.56.55.568.tiq	a bit more shifted to the left

410MHz-2021.07.03.01.11.33.702.tiq
410MHz-2021.07.03.01.20.31.004.tiq
410MHz-2021.07.03.00.07.18.136.tiq
410MHz-2021.07.03.00.42.04.236.tiq
410MHz-2021.07.03.00.45.45.337.tiq
410MHz-2021.07.03.04.22.44.303.tiq
410MHz-2021.07.03.04.26.25.486.tiq
410MHz-2021.07.03.04.45.54.495.tiq
410MHz-2021.07.03.04.49.35.705.tiq

410MHz-2021.07.03.05.25.24.517.tiq
410MHz-2021.07.03.05.58.03.370.tiq

410MHz-2021.07.03.06.19.07.475.tiq

----------------------------------------------

> After looking through >800 shots from Jul 2nd 21h to Jul 3rd 05h, we couldn't find a single example of a "smoking gun" isomer decay. I.e. I'm talking about the examples Liliana posted earlier. We did find many examples (roughly 10%) where the ion track spontaneously
> disappeared, but this shouldn't be the isomer as there was no frequency shift.
>
> We did, as Iris mentioned, observe some line "in-between" the broad peak unique to the 410MHz, and listed them here (https://triumfoffice365-my.sharepoint.com/:x:/g/personal/dillmann_triumf_ca/EdKsMfSC3AlHopA36PdLBlsBE2MCSY0hh5qIsuau5HFBmg?rtime=Z2os4J492Ug).
> I then proceeded to sum these files to see if they lined up. The result it attached, with the previous total sum from 21-00h Jul 2nd at the bottom for comparison. It seems the 70Se line has shifted, this is observed in the other shots too. However, despite the low
> statistics, these other shots don't line up with the broad peak identified before, although they don't line up well with each other individually either.
> In either case, we think these files might be worth offline analysis as they're the only possible hint of the 70Se isomer so far. |
| Attachment 1: 410MHz-2021.07.02.21.42.36.139.tiq.png
|
|
| Attachment 2: 410MHz-2021.07.02.22.40.24.894.tiq.png
|
|
|
10
|
Thu May 6 14:28:32 2021 |
Helmut Weick | Calibration | Be target thickness calibration -> 1839 mg/cm^2 |
Injection was optimized before with Cu-40 mg/cm^2 stripper.
This reduces energy of 78Kr from 370 MeV/u -> 386.52 MeV/u.
To keep the same ESR injetion the SIS energy was raised with Be 10mm tatget.
For exactly 1850 mg/cm^2 a SIS-energy of 445.46 MeV/u would be needed. A scan of SIS energy resulted in 445.0 MeV/u as optimal.
This means target thickness is close to 1850 mg/cm^2, we can call it 1839 mg/cm^2. |
|
40
|
Fri May 7 09:56:43 2021 |
Yuri | Calibration | Identification Verification |
With closed scrapers there are only a few weak lines.
Open temporarily all scrapers in the ESR to write down the frequencies. |
|
73
|
Sat May 8 10:51:41 2021 |
Akash, Nic, Jelena, Zsolt | Calibration | ESR settings seem different |
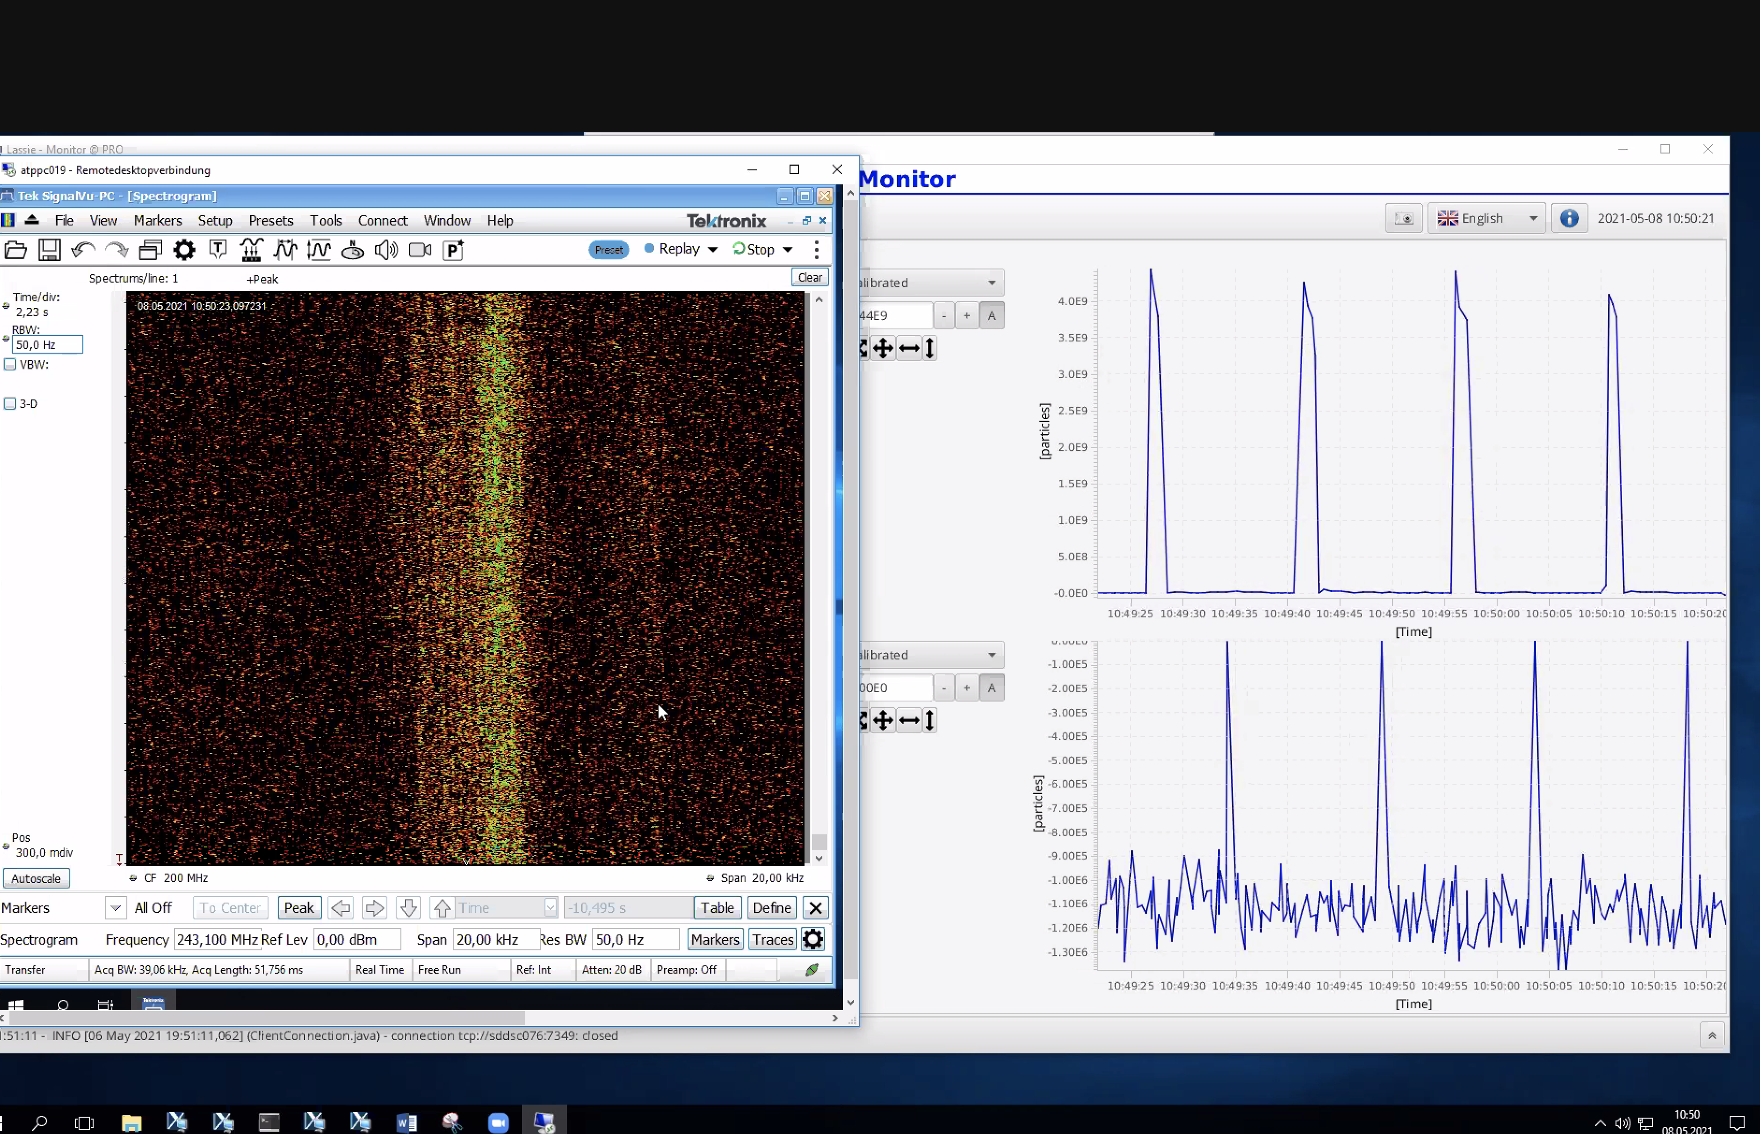
Settings don't look the same...so we are not yet writing files unless sure. |
| Attachment 1: Screenshot_2021-05-08_at_10.50.23.png
|
|
|
105
|
Sun May 9 13:53:07 2021 |
Yuri, Wolfram, Andrew, Liliana | Calibration | Change of energy: Back as before |
After looking at the spectrum it was concluded that the same isotopes, and no more, could be identified.
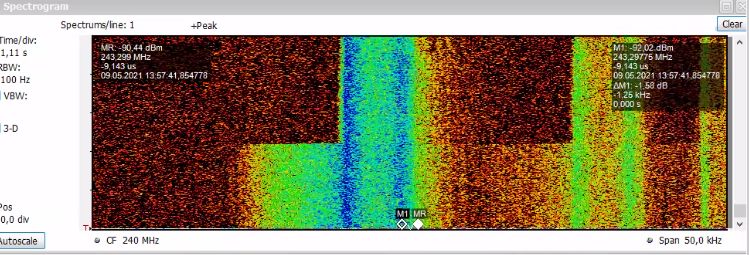
Now we change the energy back to 441.7 MeV/u and will open the scrappers to see if Mn comes in.

The picture shows the effect of going back to the previous energy and then the effect of opening the scrappers |
| Attachment 1: Screenshot_2021-05-09_13-59-36.png
|
|
|
1
|
Fri Apr 23 13:47:55 2021 |
Jan Glorius | Collaboration | experiment proposal |
|
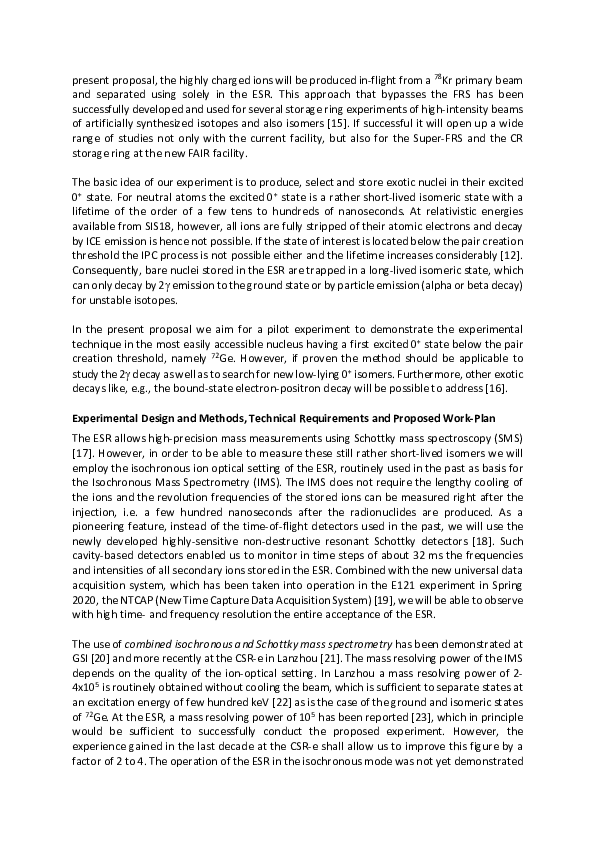
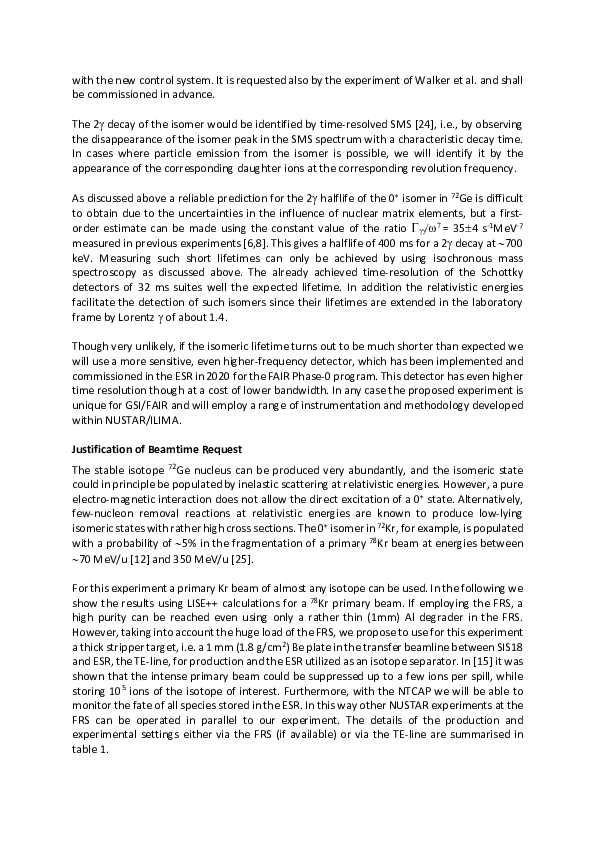
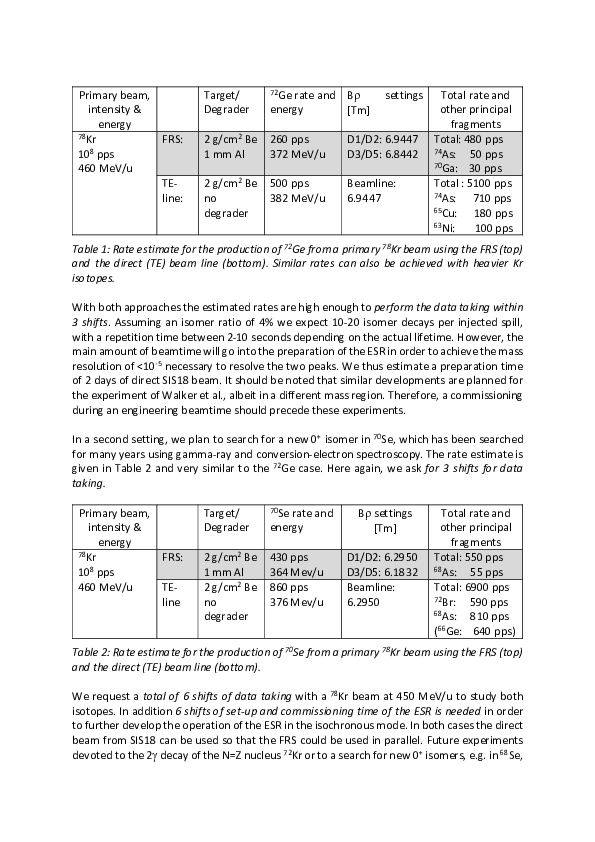
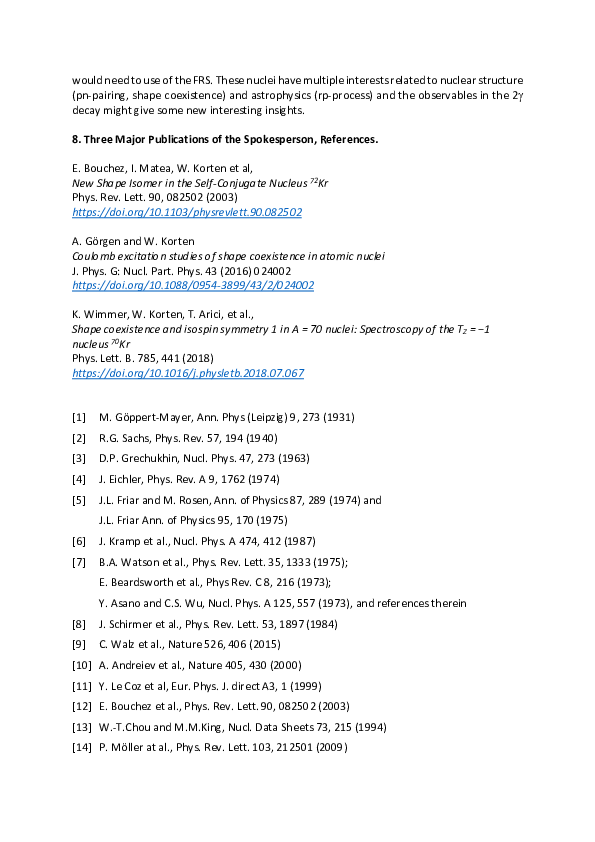
| Attachment 1: ESR_Two-Photon_proposal_final.pdf
|
|
|
12
|
Thu May 6 16:45:42 2021 |
Ragan, Rui-Jiu | DAQ | Data taking with NTCAP |
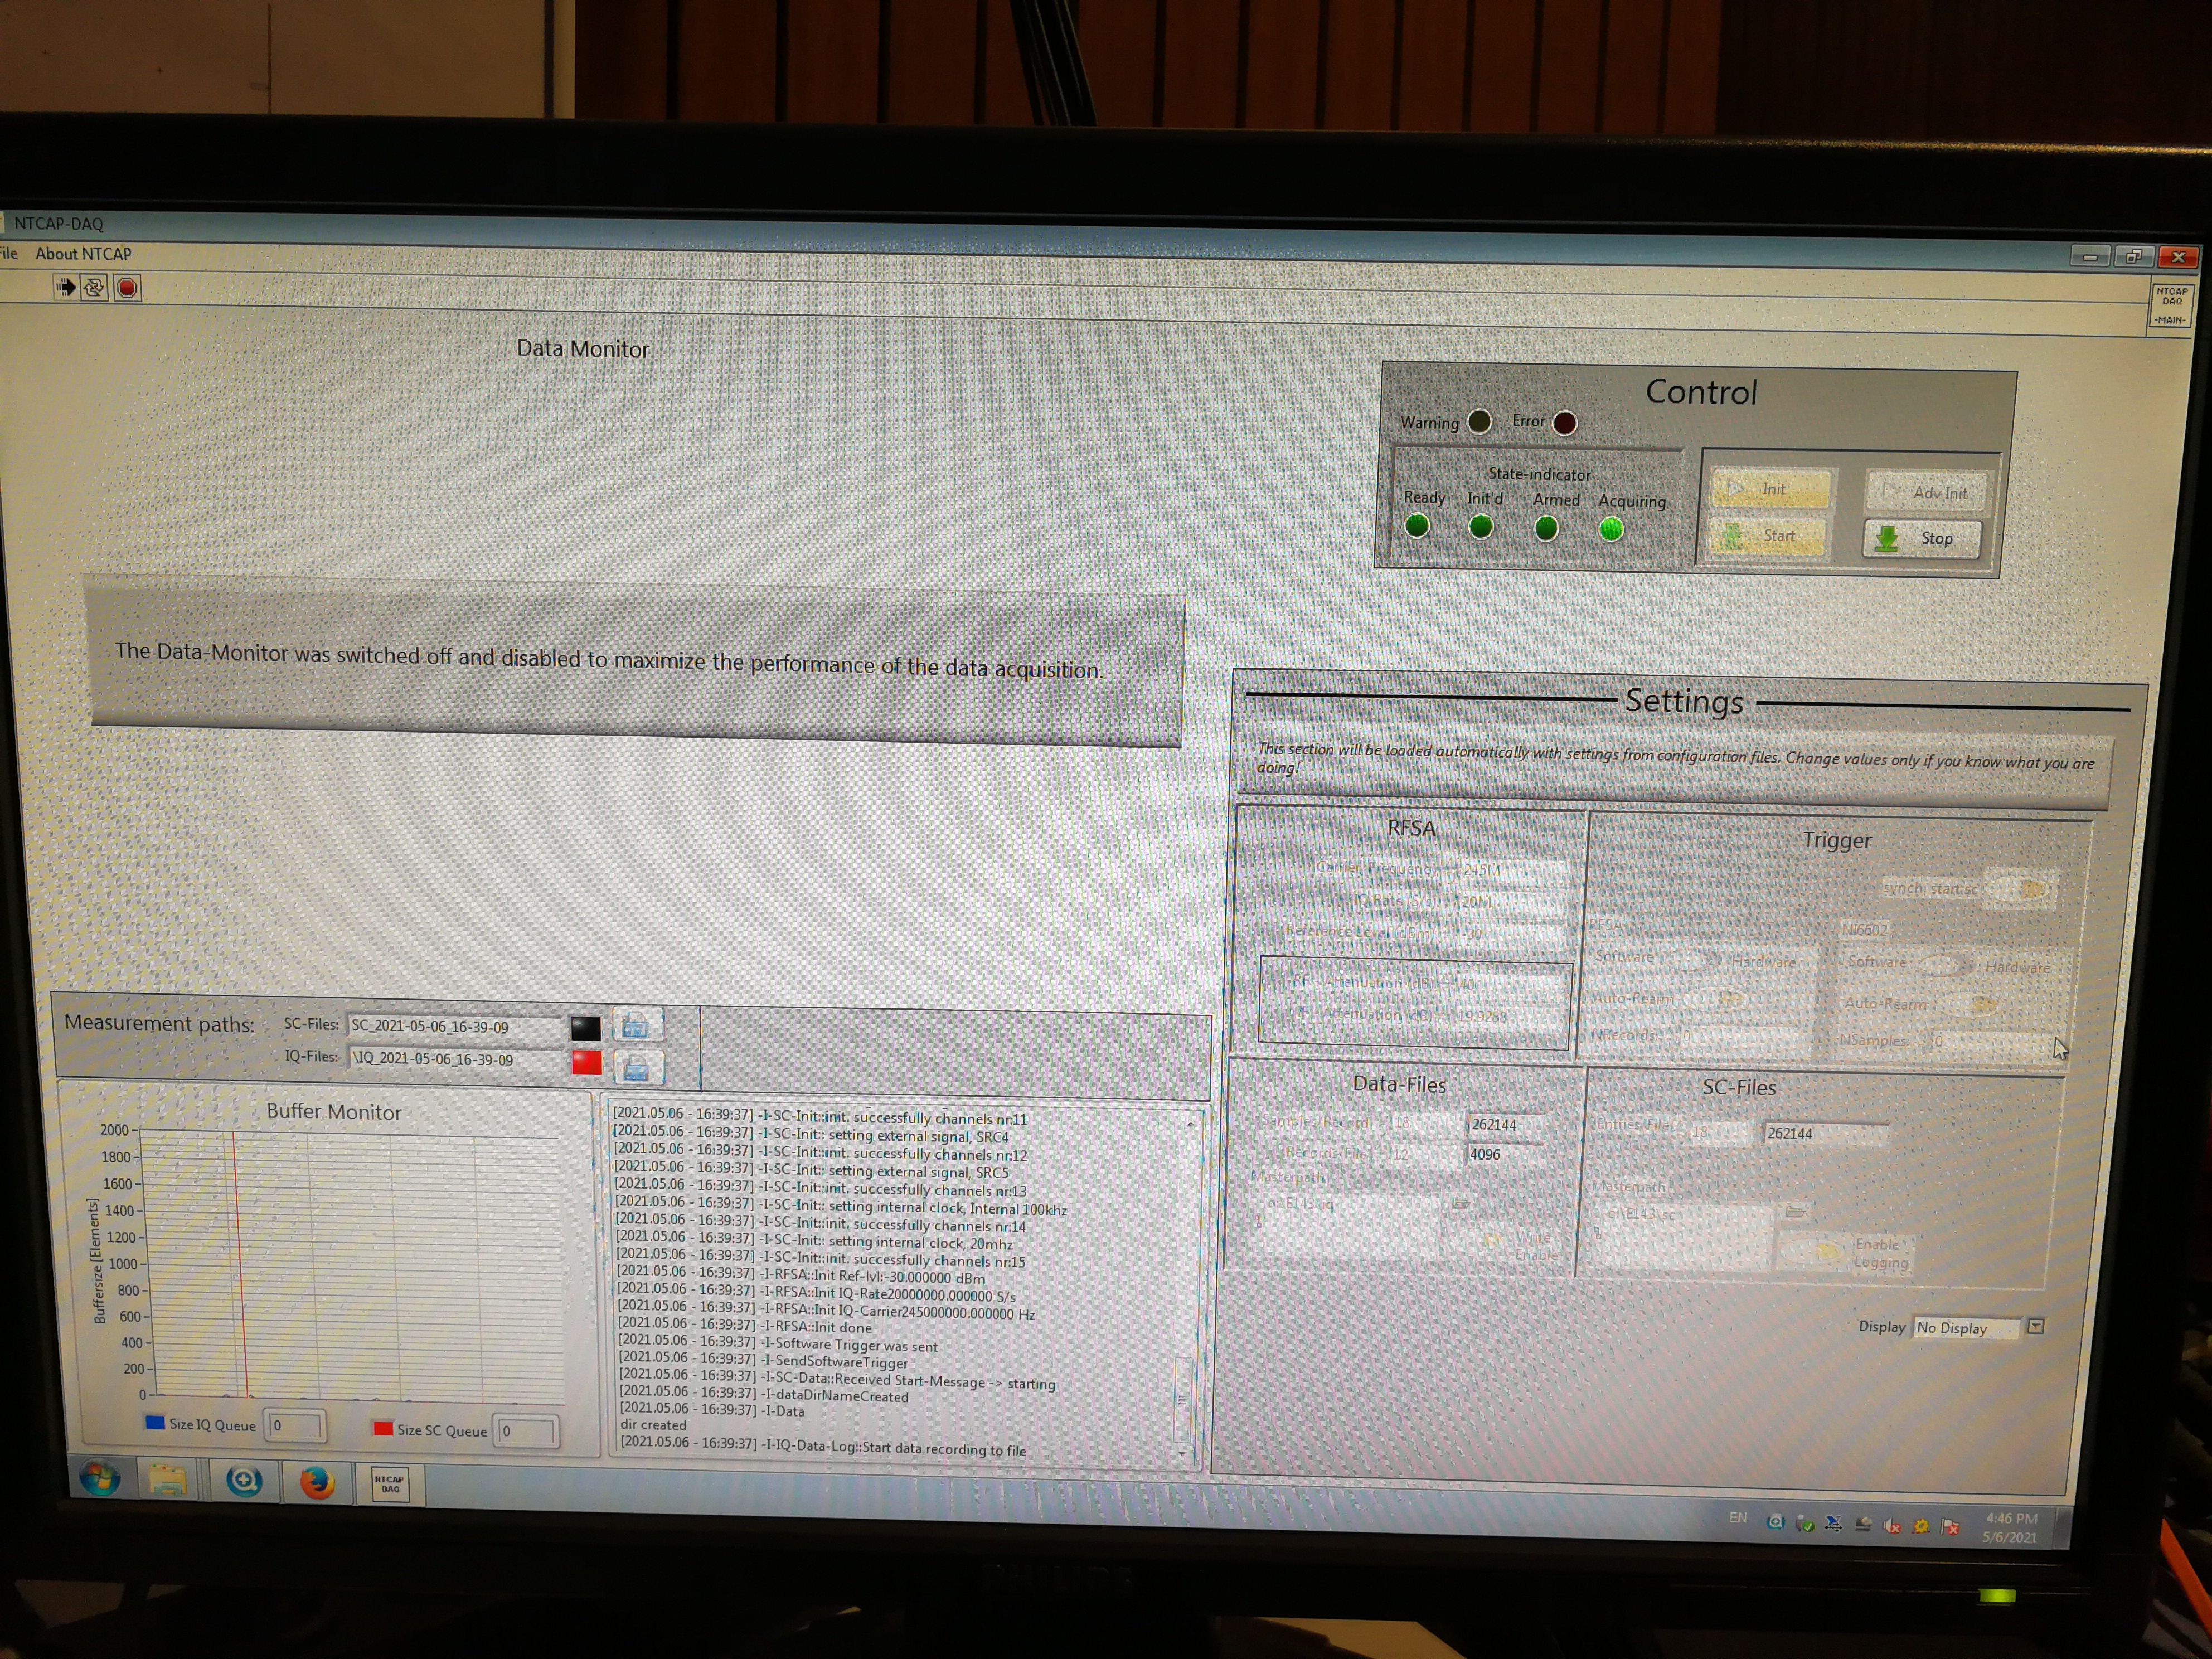
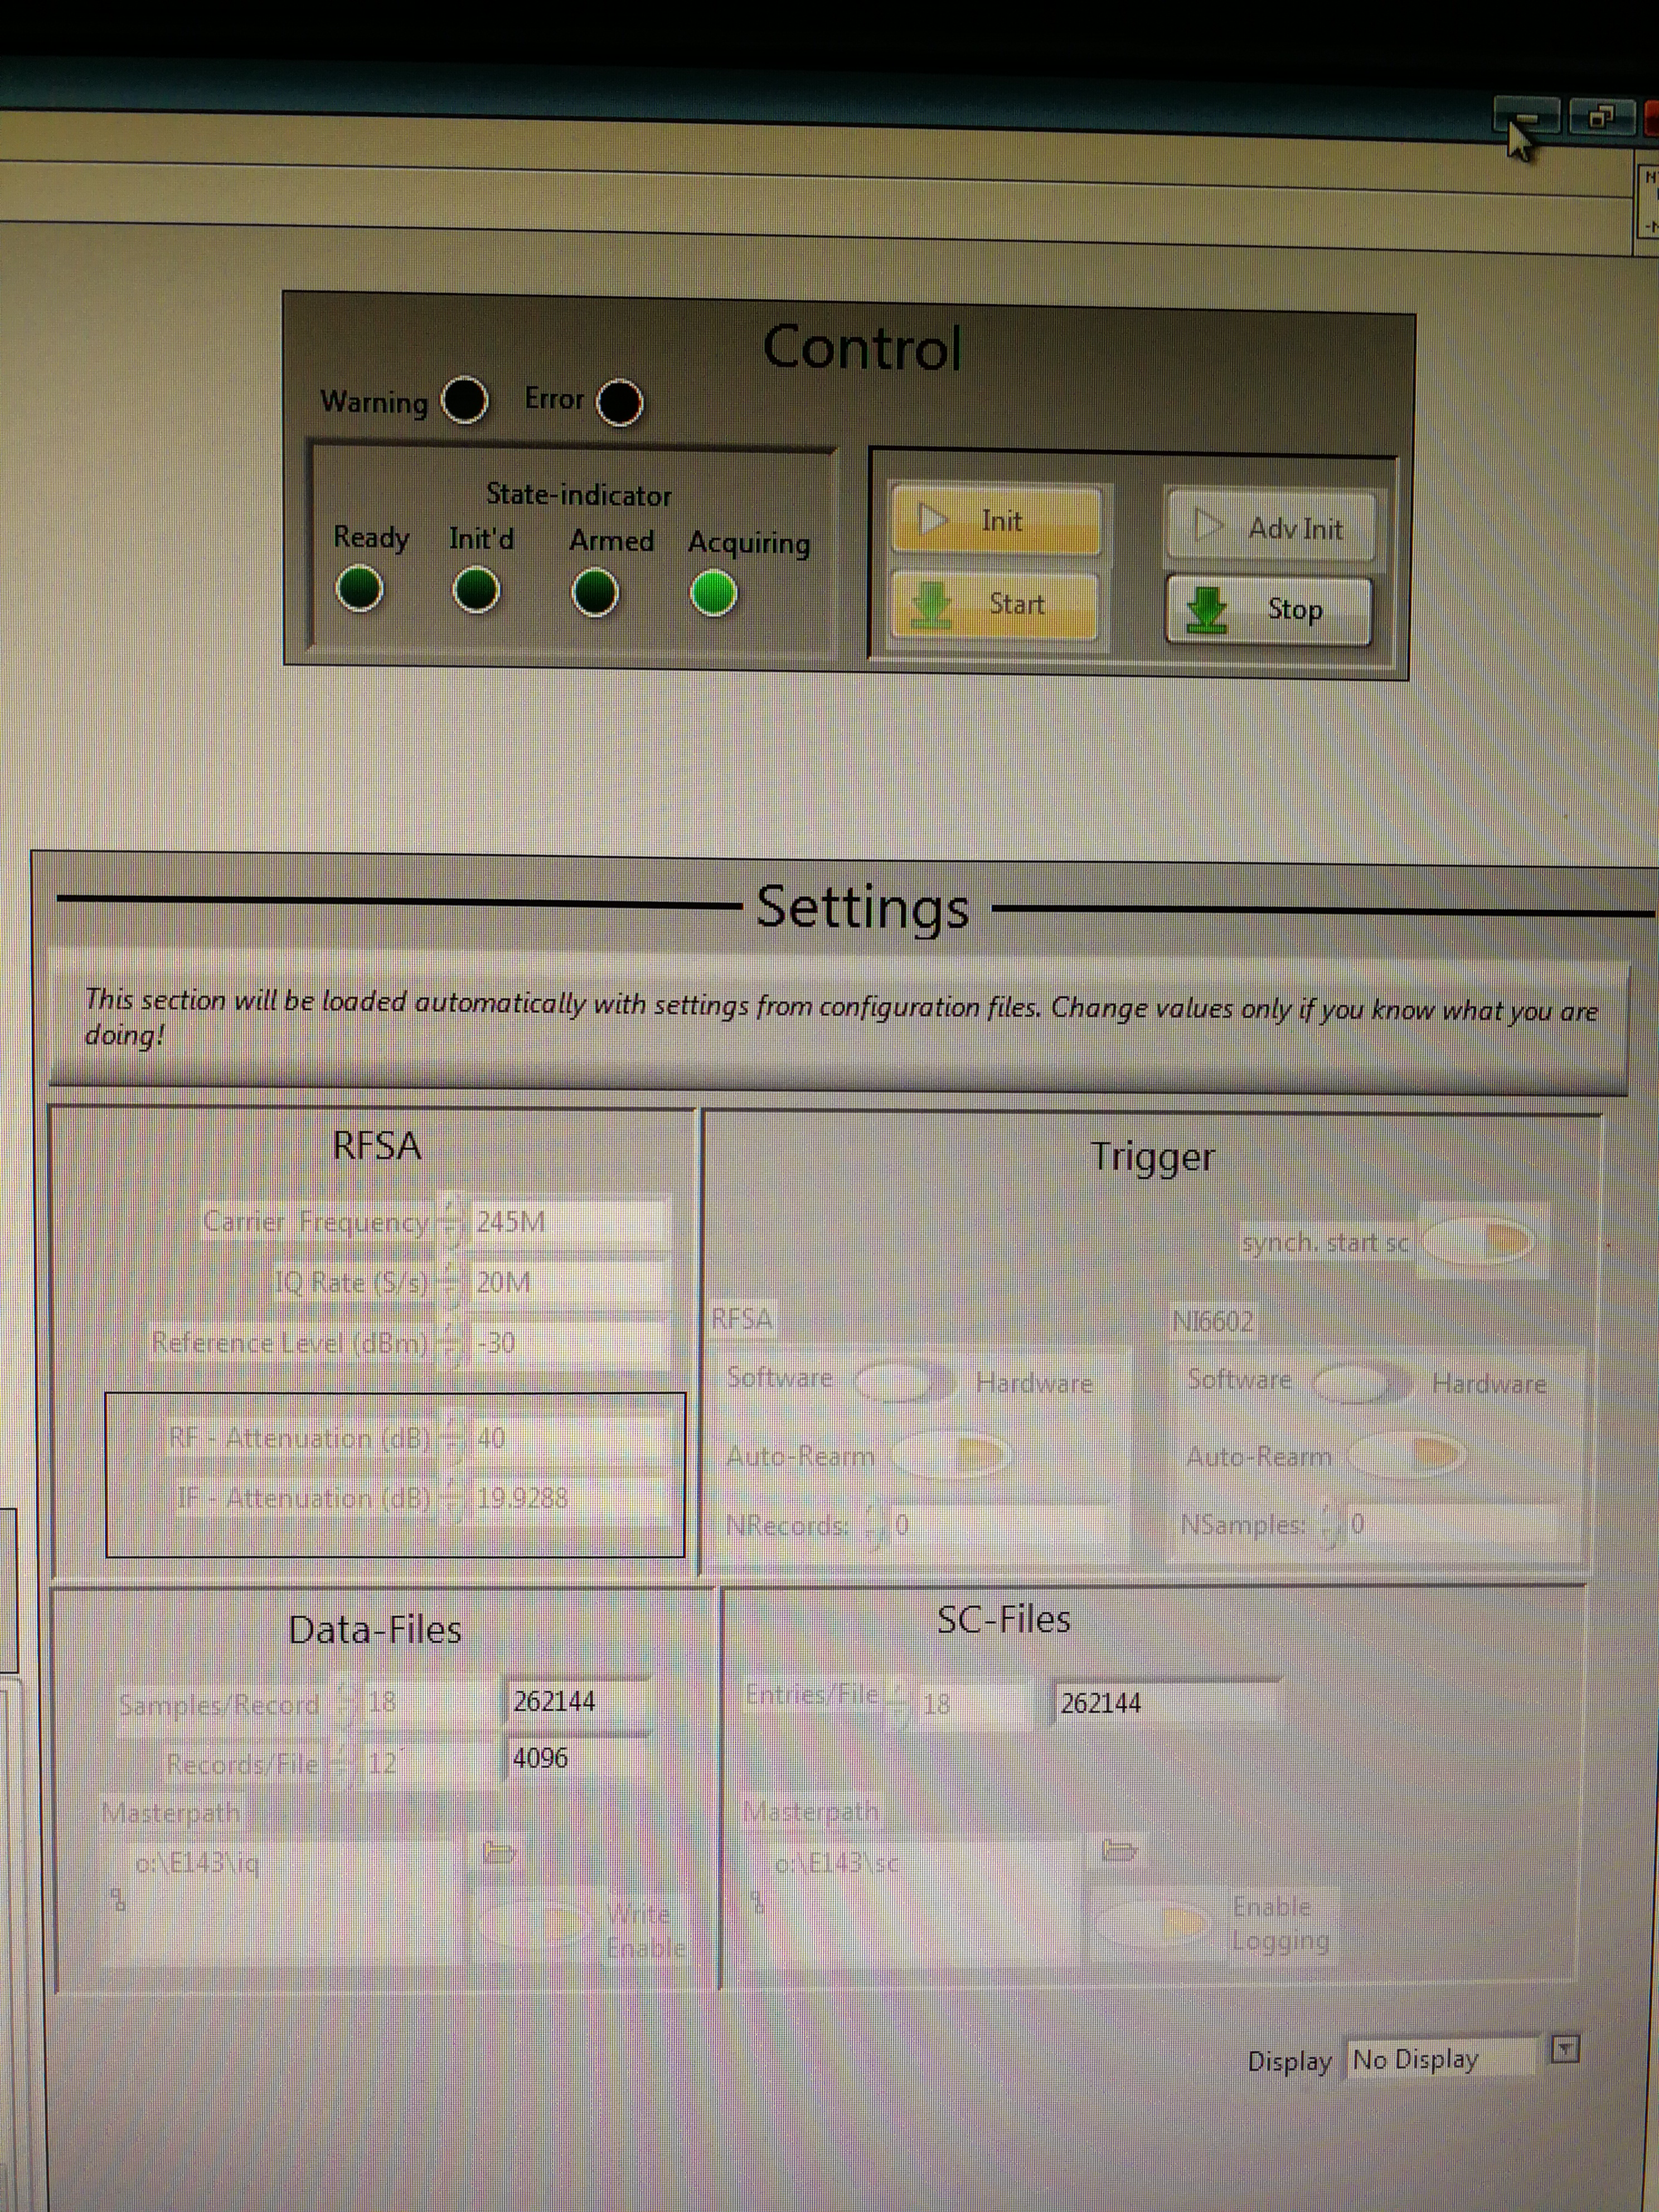
NTCAP is on and data taking has started.
On time: 16:39

SC_2021-05-06_16-39-09
\IQ_2021-05-06_16-39-09

IQ Rate: 20 MS/s
Carrier frequency: 245 MHz
Reference level(dBm):-30
RF attenuation(dB):40
IF attenuation(dB):19.9288

Data file
Samples/records:2^18=262144
Records/File:2^12=4096

SC file:
Entries/file:2^18=262144

Master path:
o:\E143\iq
o:\E143\sc |
| Attachment 1: 1.jpg
|
|
| Attachment 2: 2.jpg
|
|
|
13
|
Thu May 6 17:02:49 2021 |
Ragan, Rui-Jiu | DAQ | Scaler signals and parameters of NTCAP |
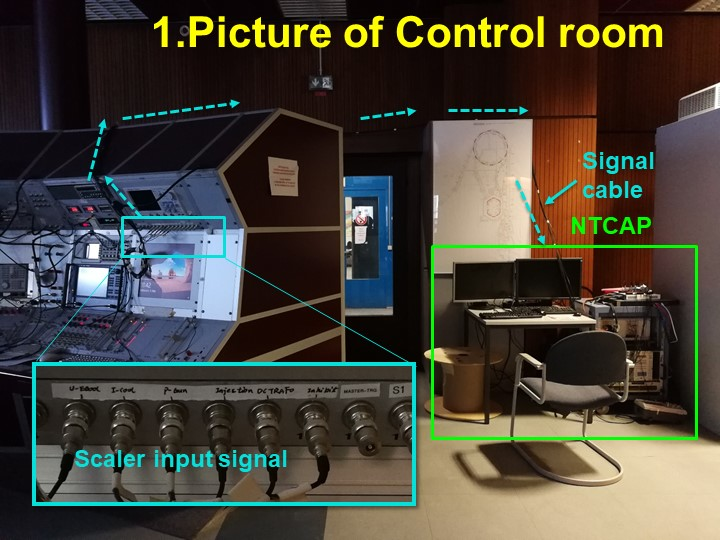
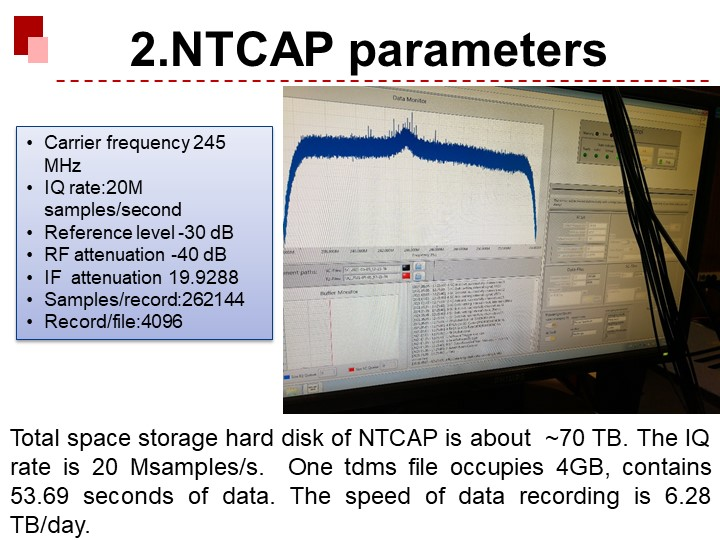
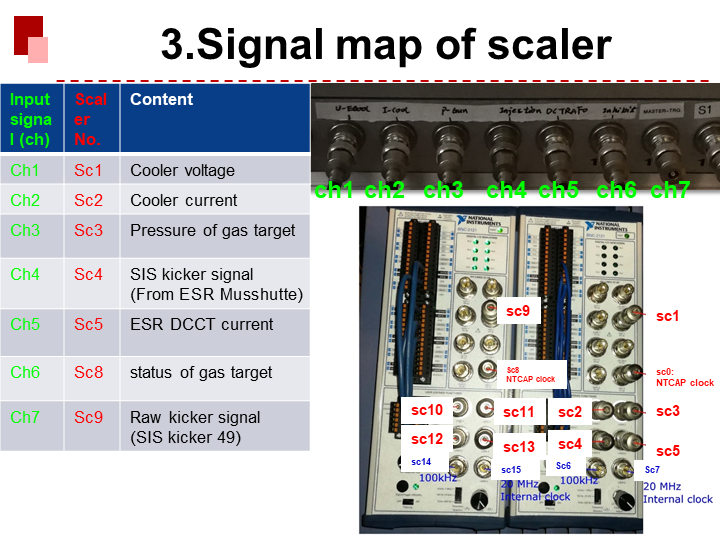
At the moment, we record 7 signals in scaler channels and one Schottky signal (245 MHz resonance cavity) in the NTCAP with the attached information. |
| Attachment 1: p1.JPG
|
|
| Attachment 2: p2.JPG
|
|
| Attachment 3: p4.png
|
|
|
15
|
Thu May 6 18:21:42 2021 |
Ragan, Rui-Jiu | DAQ | NTCAP started again |
NTCAP was stopped at 17:34 for the optimisation purpose.
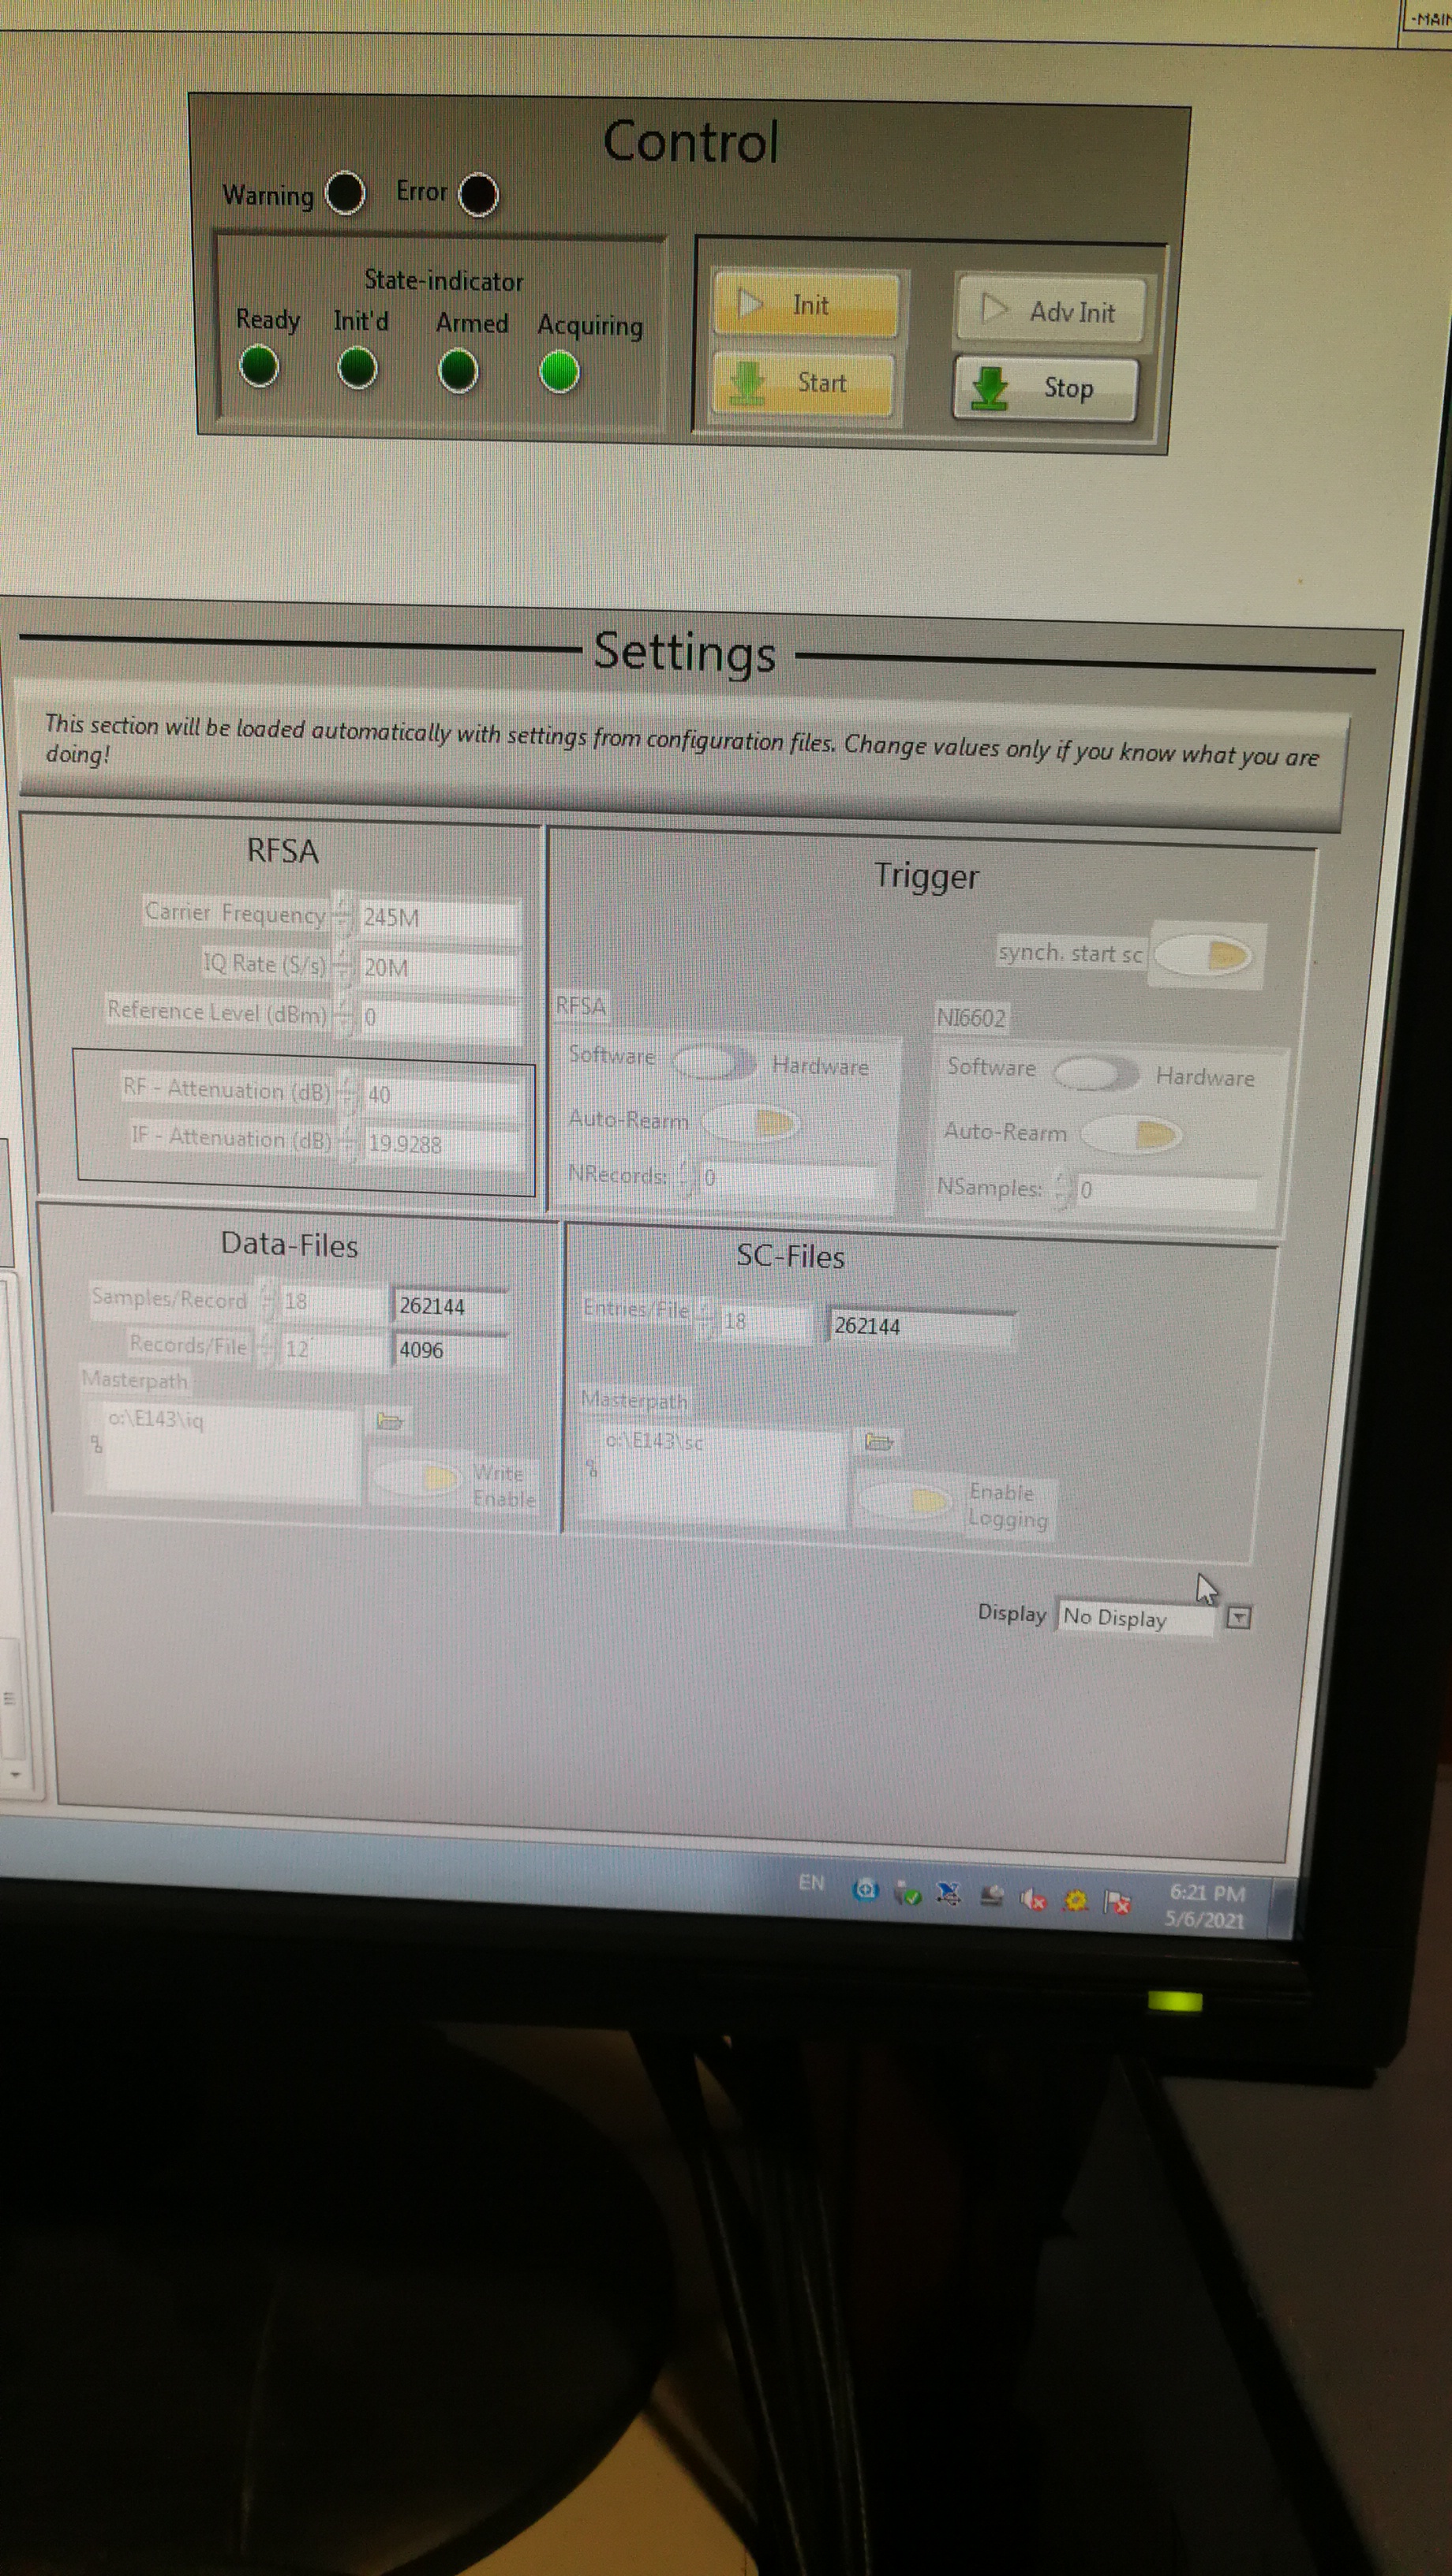
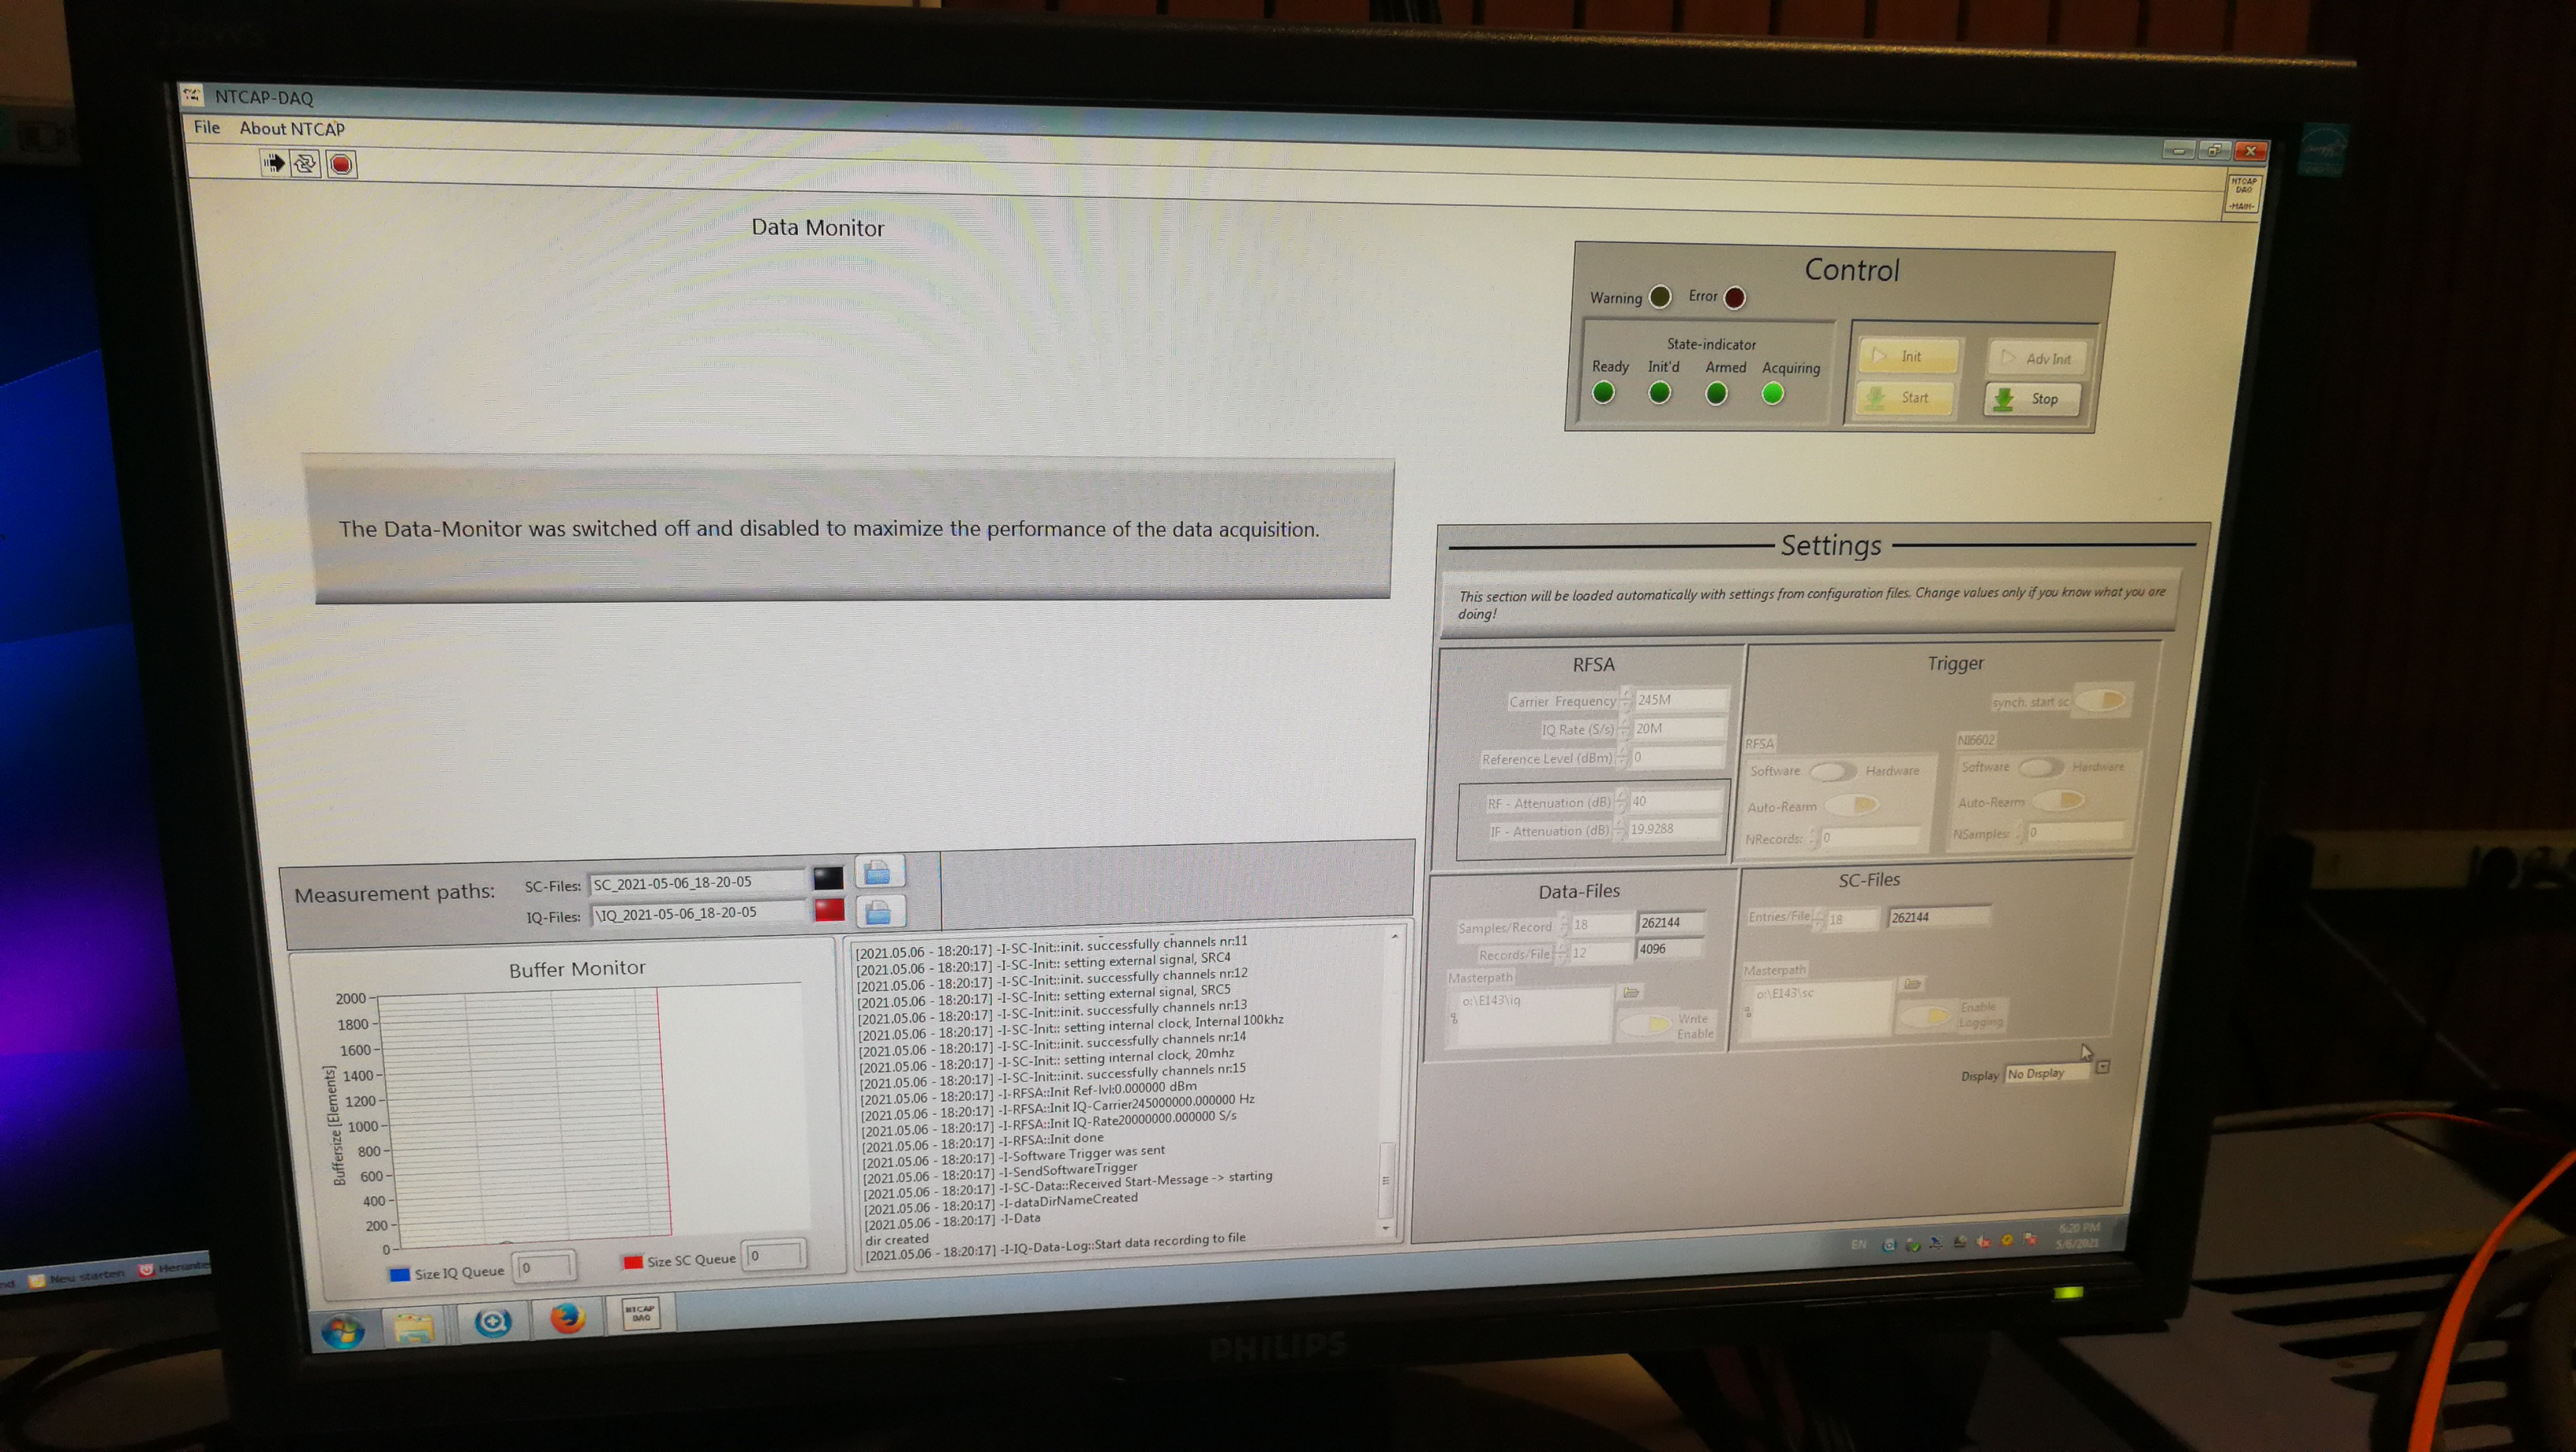
NTCAP started again at 18:20 with the change in Reference Level (dBm): 0

SC_2021-05-06_18-20-05
\IQ_2021-05-06_18-20-05 |
| Attachment 1: IMG_20210506_182118.jpg
|
|
| Attachment 2: IMG_20210506_182017.jpg
|
|
|
20
|
Thu May 6 23:06:18 2021 |
Rui-Jiu Chen | DAQ | Change reference level to -50dBm |
Beam is secondary beam now. The intensity is lower. Change reference level to -50dBm.
Carrier frequency:245MHz
IQ rate(S/s): 20M.
Reference Level: -50 dBm.

Start taking data.
SC_2021-05-06_23_02_46
IQ_2021-05-06_23_02_33 |
|
22
|
Fri May 7 01:44:24 2021 |
Rui-Jiu Chen | DAQ | Change reference level to -40dBm |
Reference Level: -40 dBm.

Start taking data.
SC_2021-05-07_00-06-57
IQ_2021-05-07_00-06-57 |
|
23
|
Fri May 7 01:47:36 2021 |
Ragan, Rui-Jiu | DAQ | Change reference level to -30dBm |
Reference Level: -30 dBm.

Start taking data.
SC_2021-05-07_00-11-24
IQ_2021-05-07_00-11-24 |
|
24
|
Fri May 7 01:49:03 2021 |
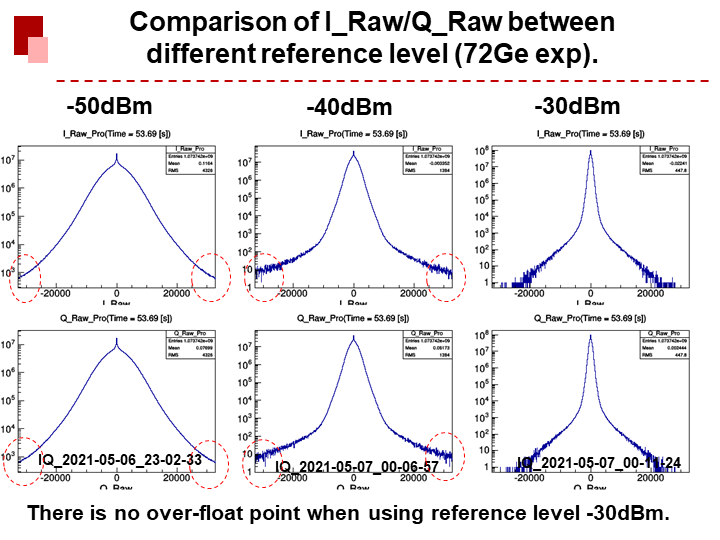
Rui-Jiu Chen | DAQ | Comparison of I_Raw/Q_Raw between different reference level |
This is a comparison of I_Raw/Q_Raw between different reference level. The range of NTCAP ADC is only 2^15 bit. So signals (I_Raw and Q_Raw) should
not be outside ADC range. It is clear that there is not point outside the ADC range when using reference level -30dBm. |
| Attachment 1: 20210501_NTCAPPreparation.png
|
|
|
66
|
Sat May 8 03:05:42 2021 |
Rui-Jiu Chen | DAQ | Change reference level to -60dBm |
Start a new run. The data of new run is in :
SC_2021-05-07_17-33-29
IQ_2021-05-07_17-33-29 |
|
67
|
Sat May 8 03:08:57 2021 |
Rui-Jiu Chen | DAQ | Change reference level to -50dBm |
Start a new run. The data of new run is in :
SC_2021-05-07_17-39-16
IQ_2021-05-07_17-39-16 |
|
78
|
Sat May 8 18:35:25 2021 |
Rui-Jiu Chen | DAQ | Change reference level to -10dBm |
The beam in ESR is 78Kr36+@476 MeV/u.
Start a new run:
SC_2021-05-08_18-25-52
IQ_2021-05-08_18-25-52 |