| ID |
Date |
Author |
Category |
Subject |
|
133
|
Mon May 10 08:49:01 2021 |
Kanika, Alex, RuiJiu | General | End of the measurement |
The beam was stopped at about 08:40. |
|
166
|
Thu Jul 1 07:28:55 2021 |
Jan, Akash | Accelerator | Beam intensity |
Intensity went up from 5e8 to 1e9 extracted particles from SIS. |
|
1
|
Fri Apr 23 13:47:55 2021 |
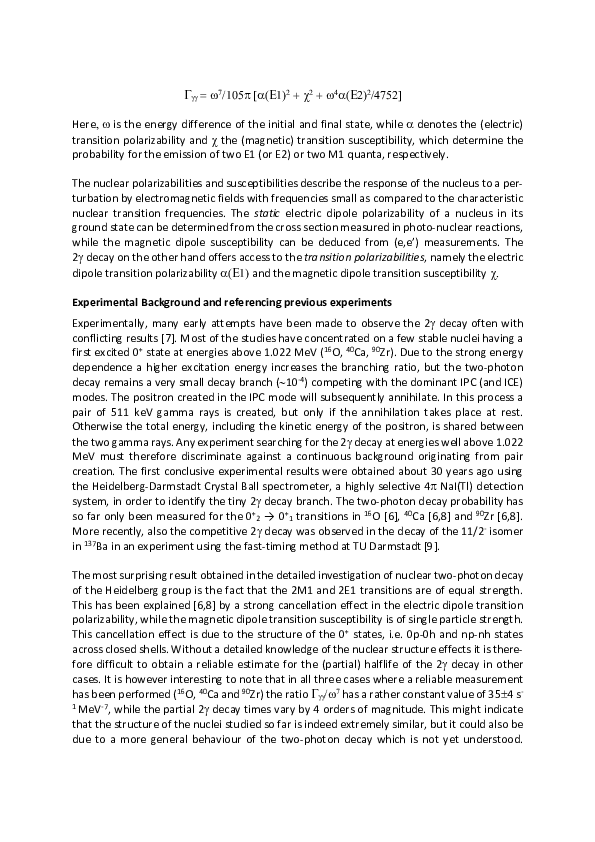
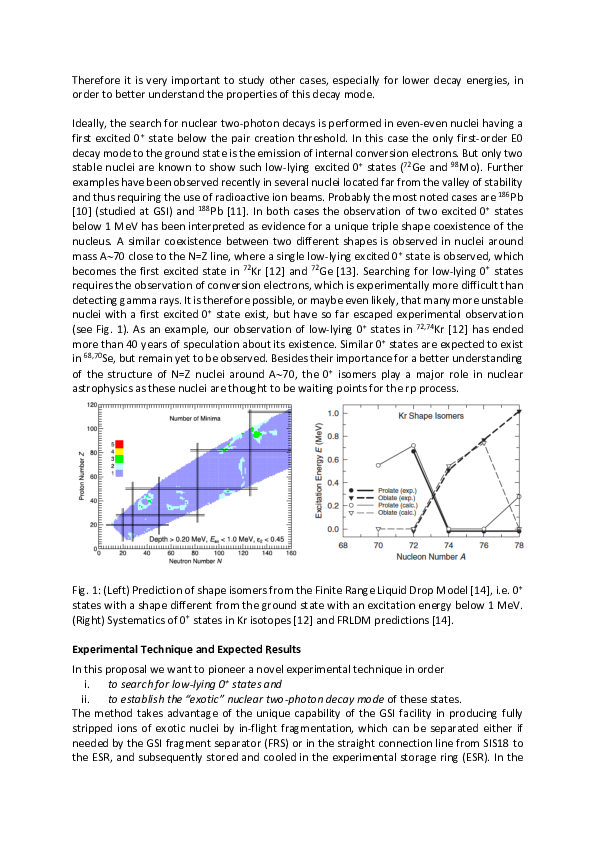
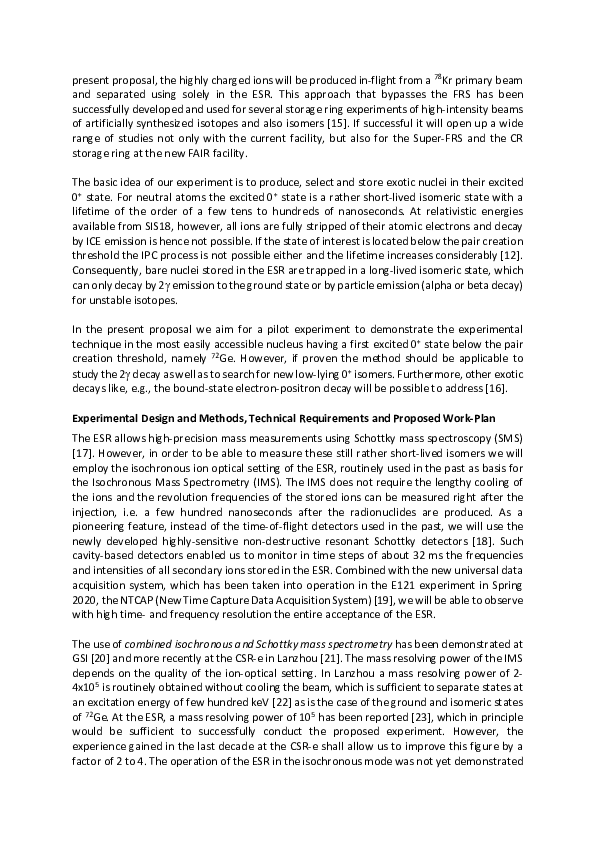
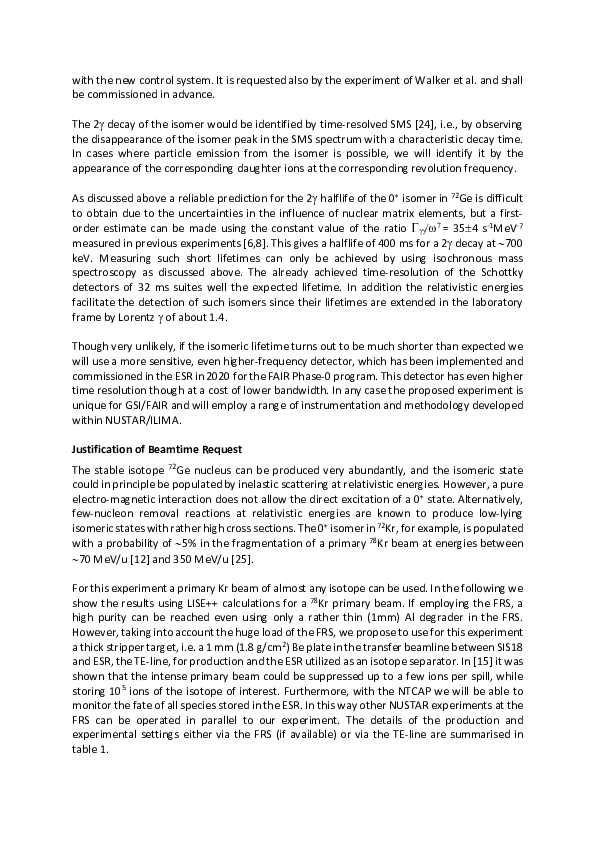
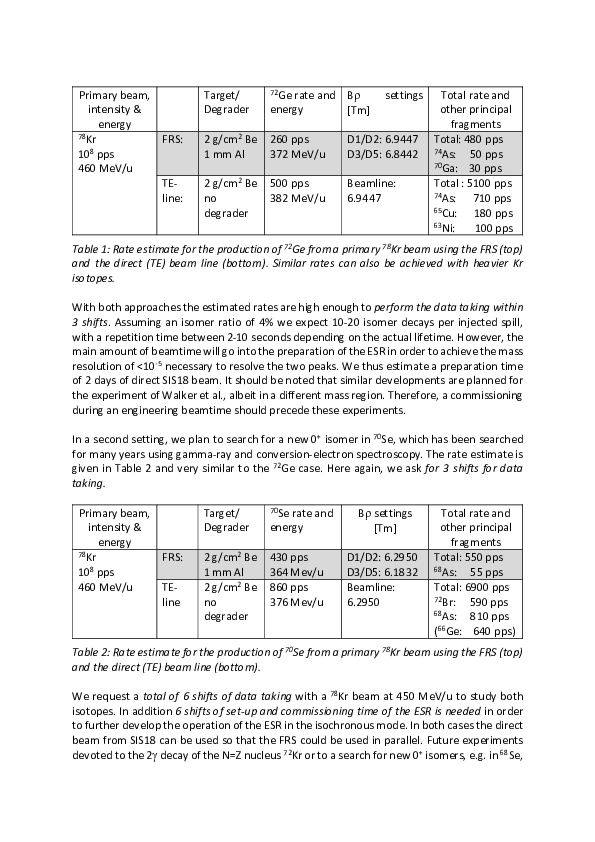
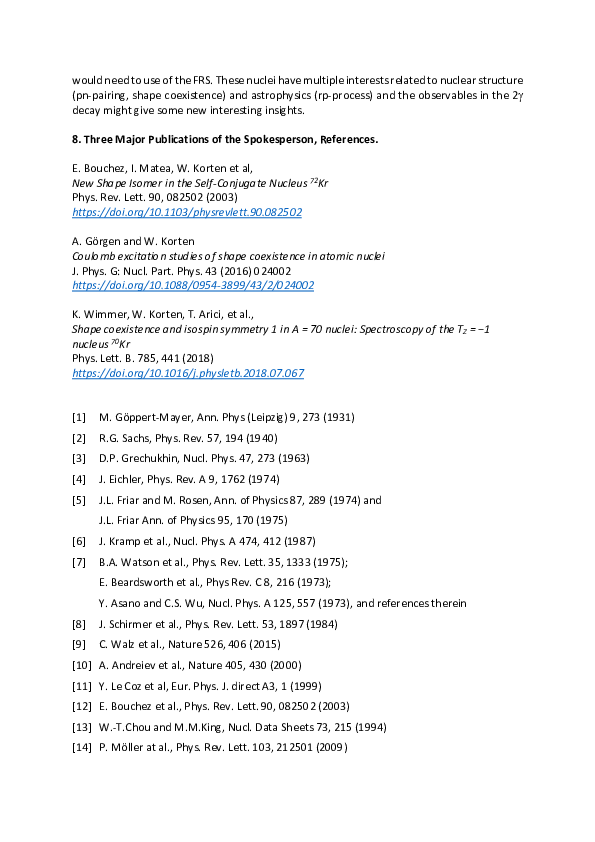
Jan Glorius | Collaboration | experiment proposal |
|
| Attachment 1: ESR_Two-Photon_proposal_final.pdf
|
|
|
87
|
Sun May 9 02:19:04 2021 |
Jacobus, Shahab | Runs | First 52Mn run |
Run E143-245 MHz-2021.05.09.01.17.42.265.tiq is the first run of the experiment on 52Mn. |
|
88
|
Sun May 9 02:32:58 2021 |
Jacobus, Shahab | Runs | possible 52-Mn isomer |
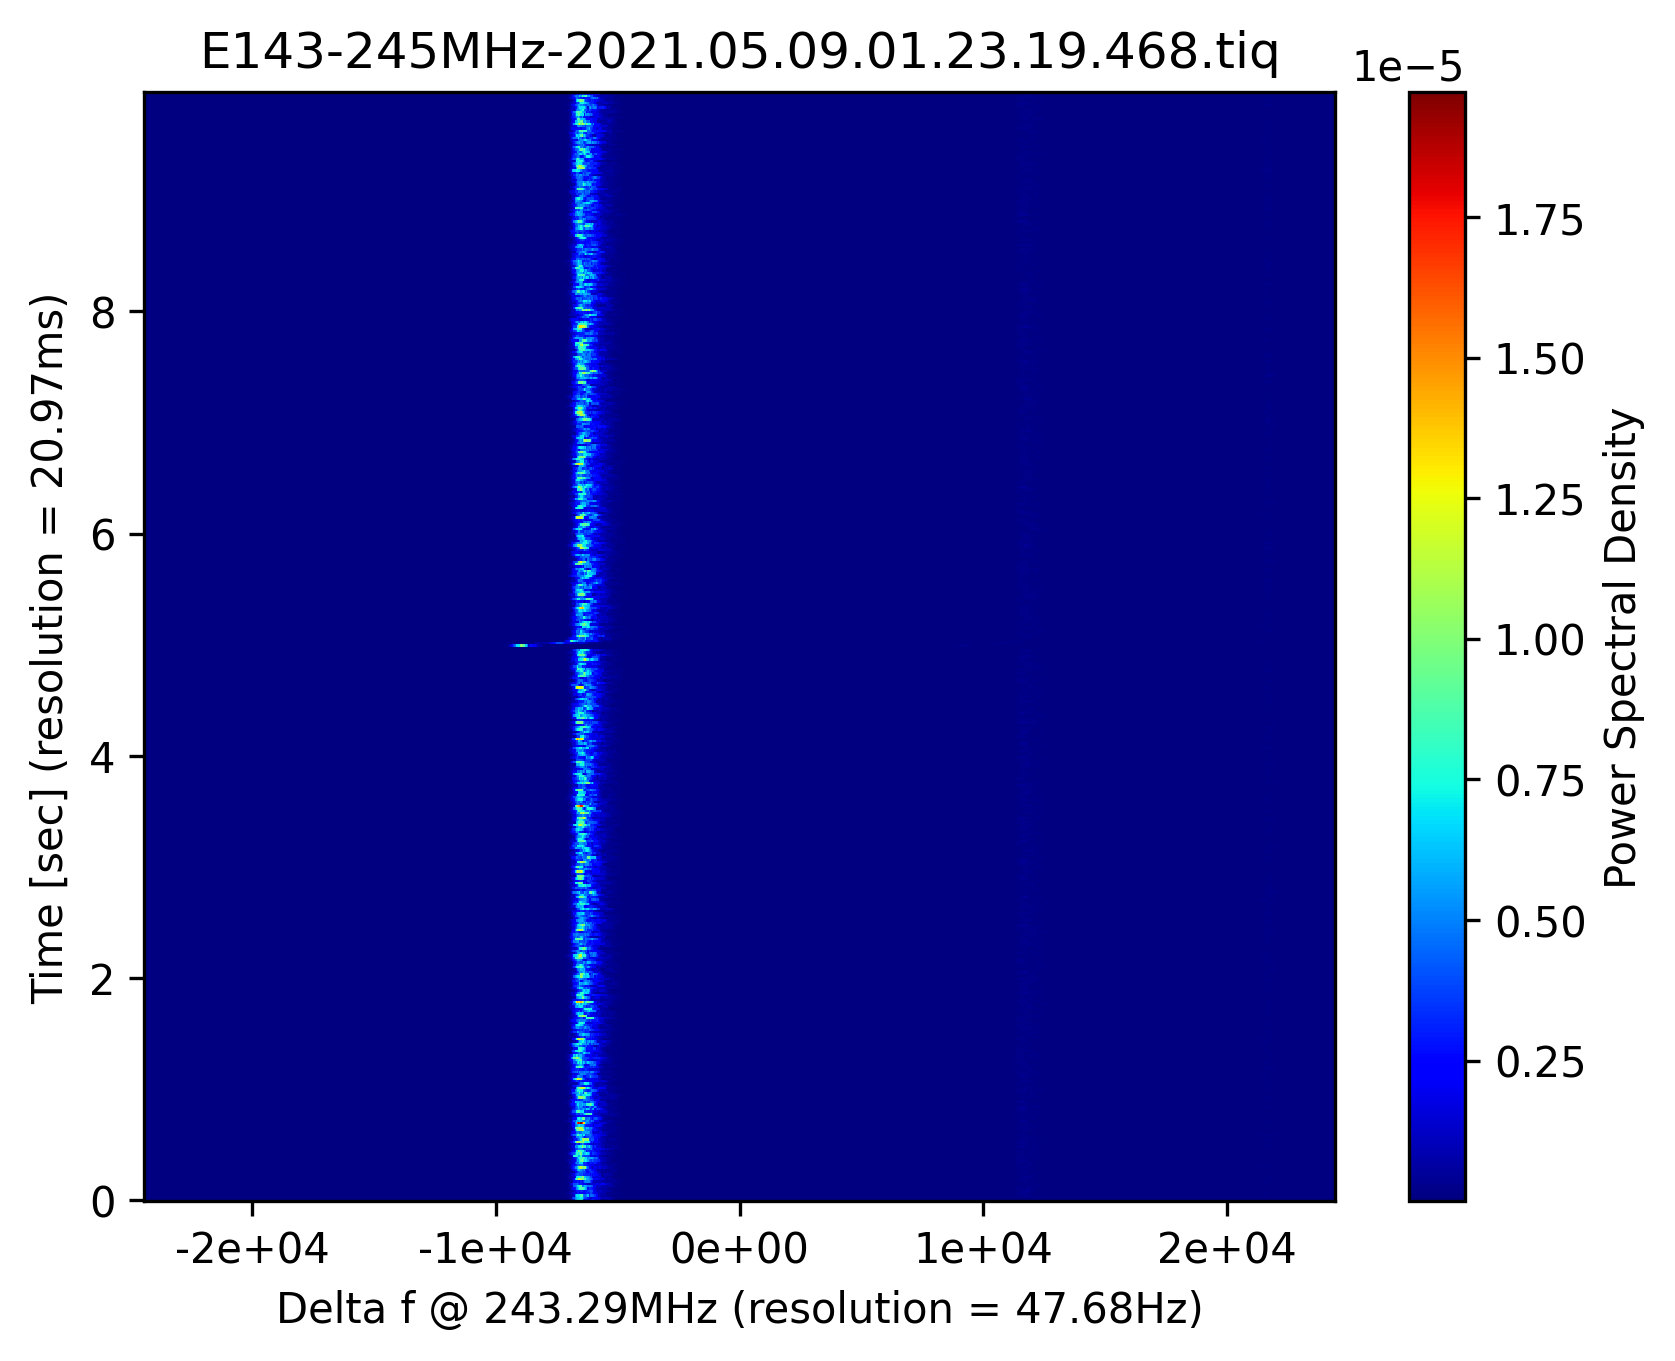
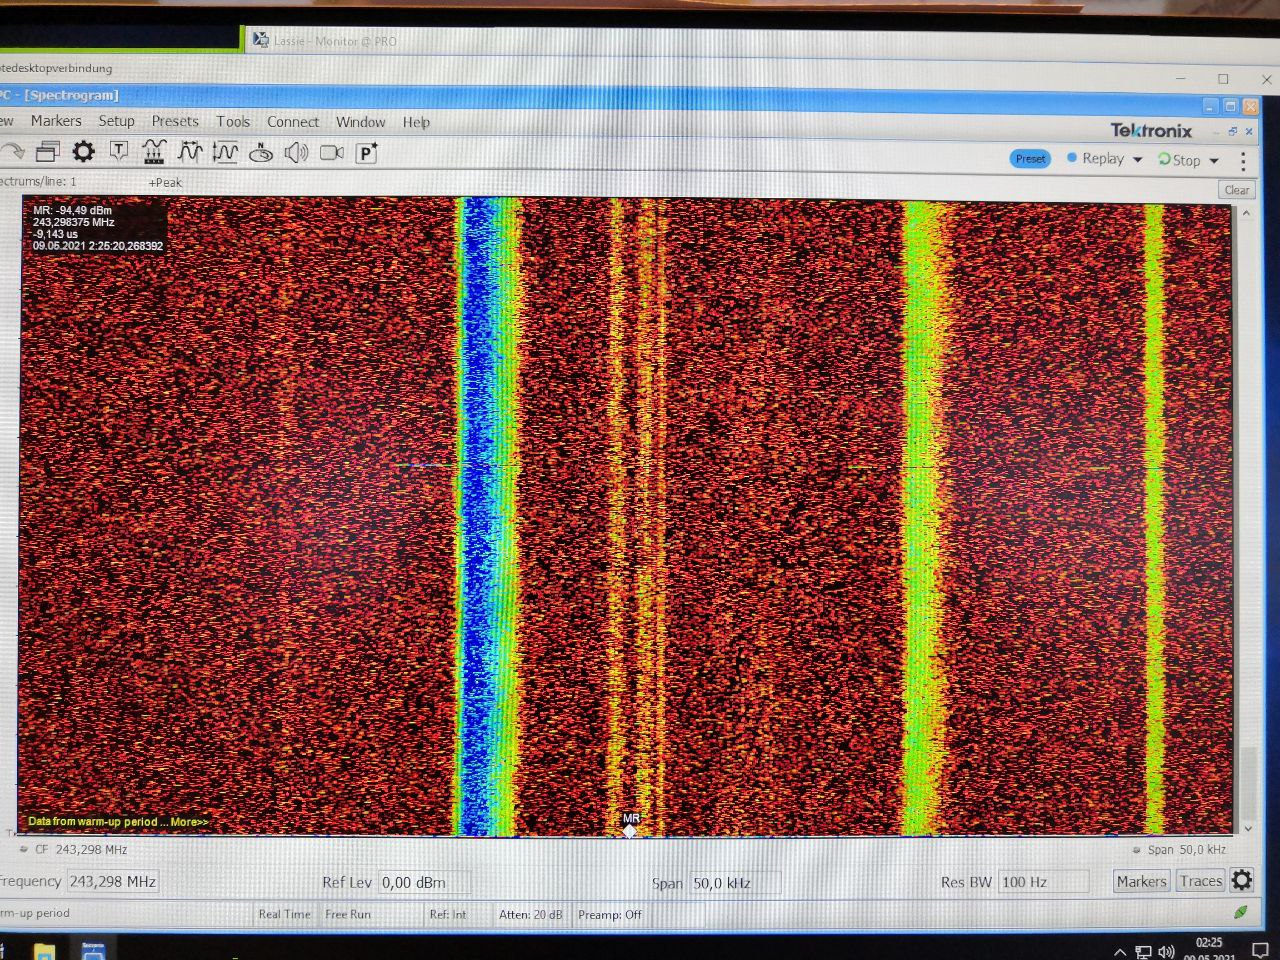
the intensity of the line on the left side is so high, it is difficult to see the isomers in the middle as can be seen in the auto generated picture |
| Attachment 1: E143-245MHz-2021.05.09.01.23.19.468.tiq.png
|
|
| Attachment 2: asd.jpg
|
|
|
89
|
Sun May 9 02:45:50 2021 |
Jacobus, Michele, Shahab | Runs | Example of possible 52.Mn isomer |
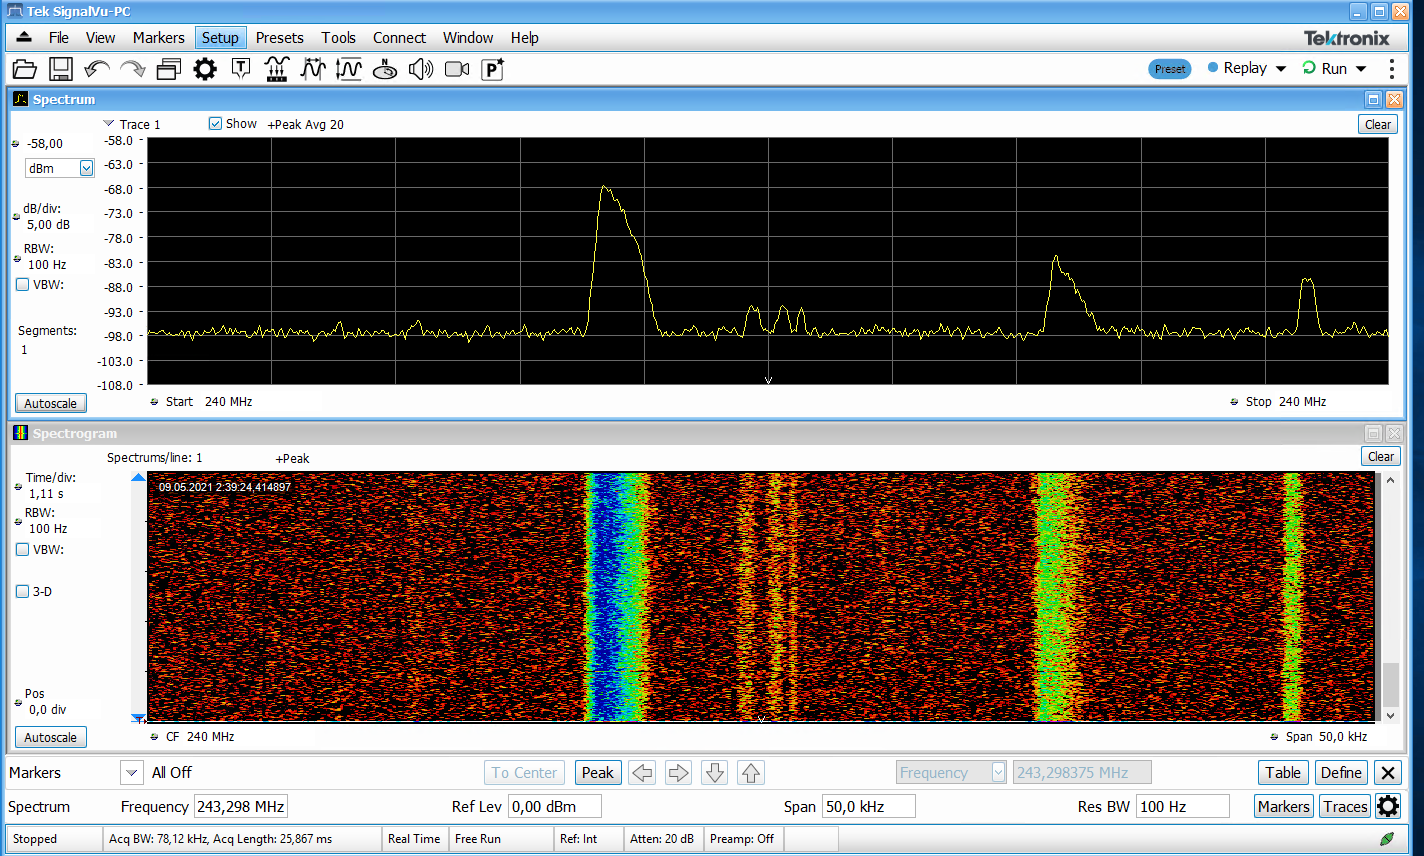
this is how it should look like |
| Attachment 1: 52Mn_002.PNG
|
|
|
171
|
Thu Jul 1 17:01:43 2021 |
Jacobus | Runs | Frequency shift |
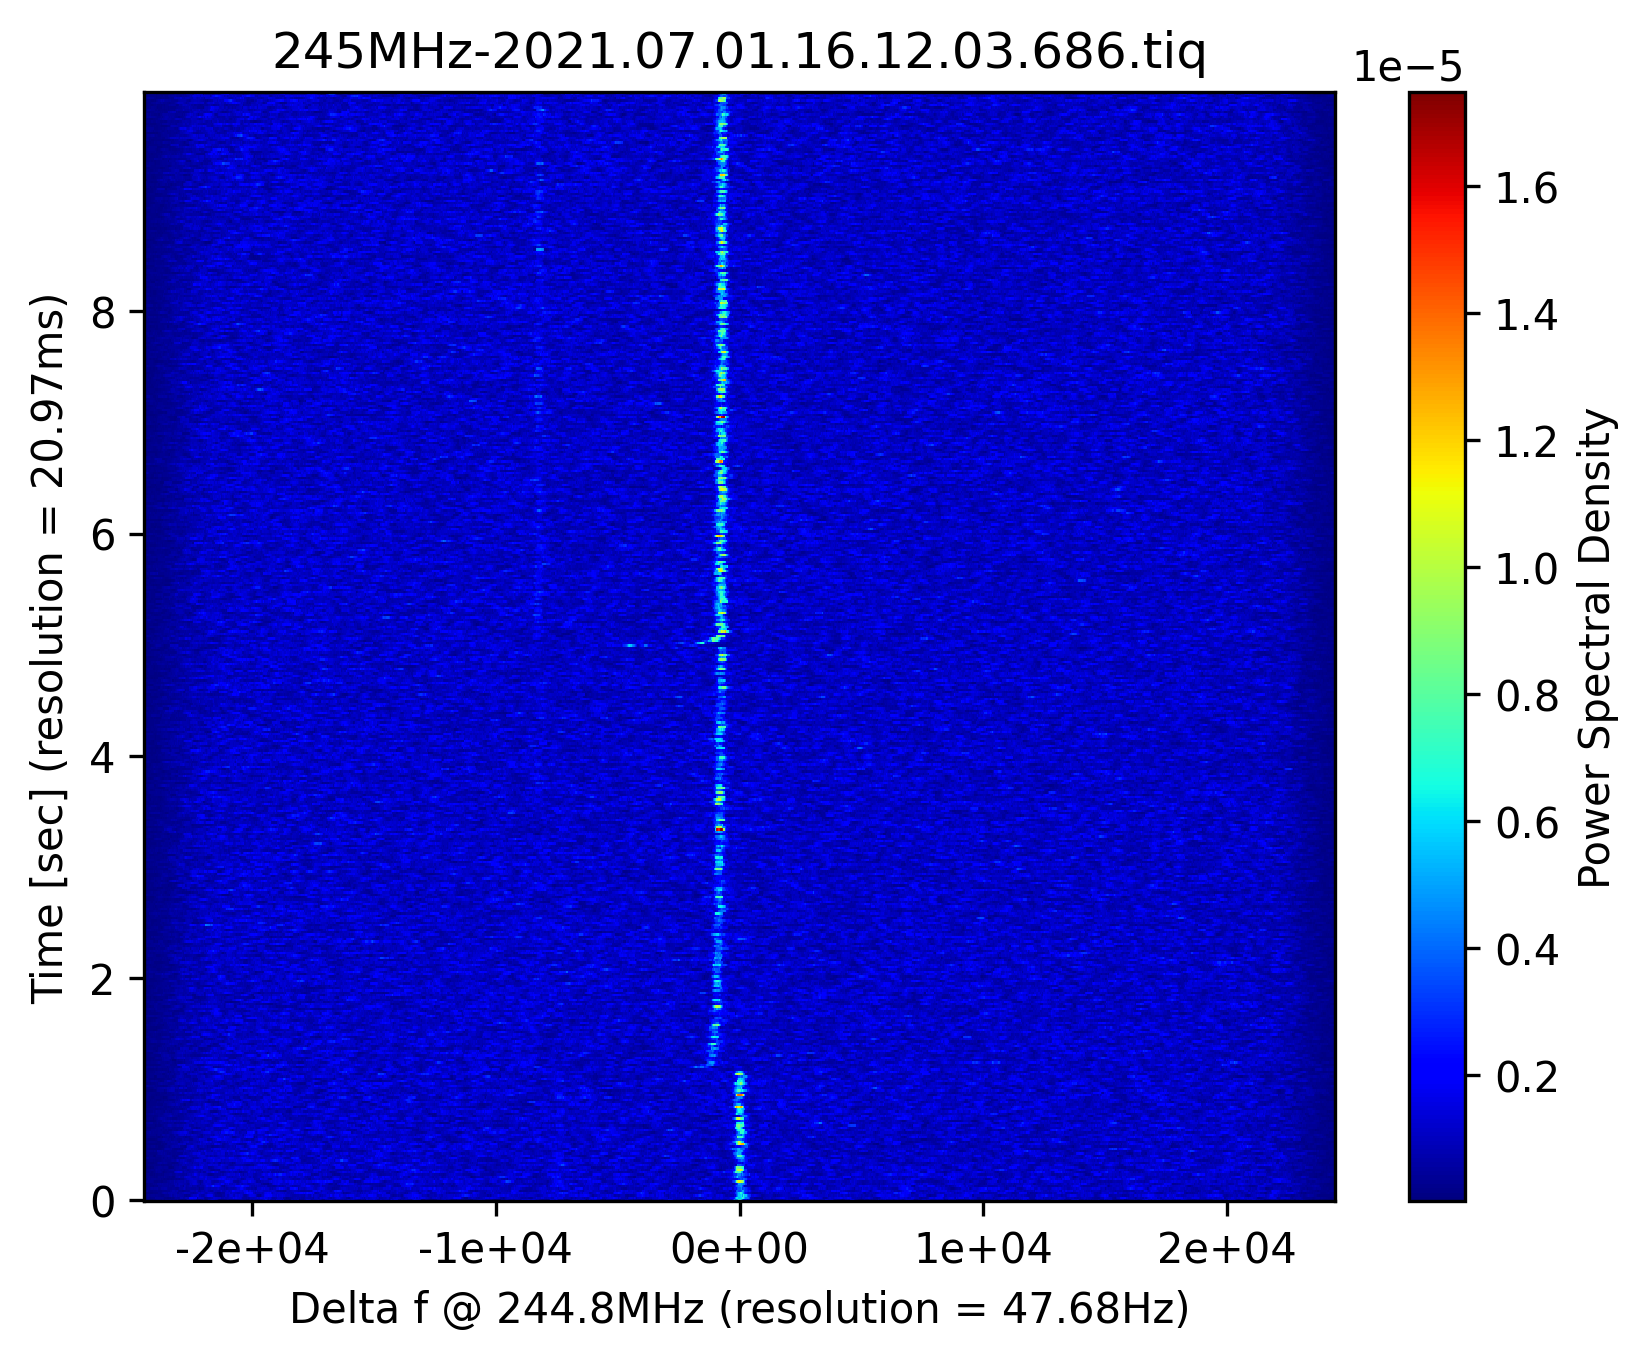
> The freqency suddenly shifted at time 16:11:47 and remained shifted until now
>
> The ESR status in the monitor stayed blue. No obvious sign that a magnet was down. The operators are checking
>
> Sergey telephoned, he is also not sure but suggests stopping starting the ESR. We will wait for Yuri

In attachment, the moment when the shift occurred. |
| Attachment 1: 245MHz-2021.07.01.16.12.03.686.tiq.png
|
|
|
96
|
Sun May 9 05:56:29 2021 |
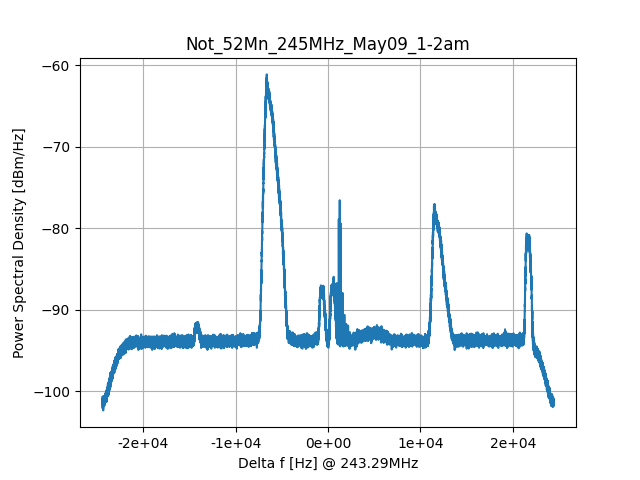
Iris, Chris G., Jacobus, Michele | Analysis | Not_52Mn spectra added up |
Attached is a summed spectra of all files taken between 1:17am and 1:59am (on the 245 MHz detector).

python3 e143_analyzer.py -s 5.1 -t 0.5 /home/dillmann/E143/e143-scripts/sparc-daq-02.gsi.de/E143-245MHz/E143-245MHz-2021.05.09.01.* -o Not_52Mn_245MHz_May09_1-2am
(Might need to adapt the skip time and read-in time, thou... used the same as for the 72Ge runs...) |
| Attachment 1: Not_52Mn_245MHz_May09_1-2am.png
|
|
| Attachment 2: Not_52Mn_245MHz_May09_1-2am.root
|
|
98
|
Sun May 9 06:15:09 2021 |
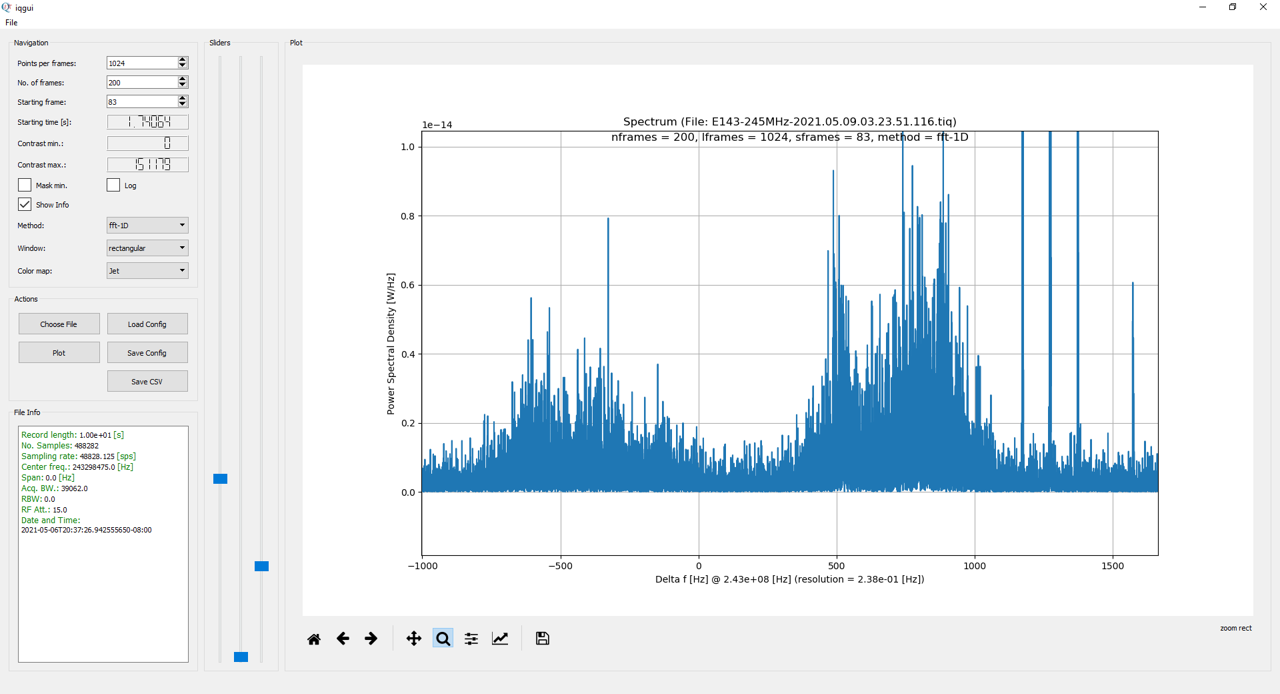
Iris, Chris G., Jacobus, Michele | Runs | Triplet: zoom in |
Zoom into the triplet: the satellite peaks on the right are clearly visible.
This is just one file but one *might* see some substructure. Yuri mentioned a 318 ms isomer in 45Sc at 12 keV but that cannot be resolved.

Maybe someone can look at the added-up ROOT files if that looks better or is just statistics?

> Short update from Yuri: these are not our isomers. These are 45Sc (left, 12 keV isomer not resolvable) and 75Br (center), and the right-most peak of the triplet is a satellite (has a different line shape, much narrower).
> |
| Attachment 1: 116-triplet.png
|
|
|
99
|
Sun May 9 06:34:37 2021 |
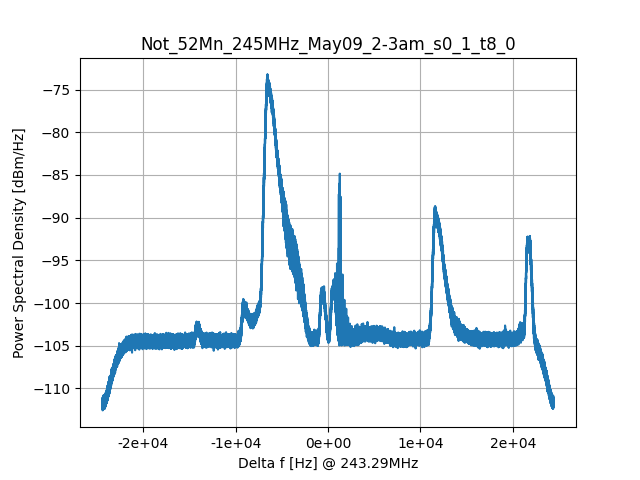
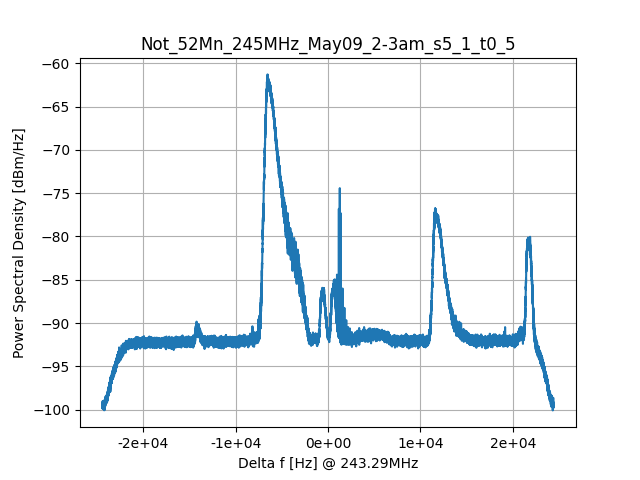
Iris, Chris G., Jacobus, Michele | Analysis | Runs 2-3am Not_Mn52 |
Summed up runs on the 245 MHz detector between 2-3am (computer time).
One has -s 0.1 -t 8.0
the other -s 5.1 -t 0.5

Not sure if it is useful but here it is :-) |
| Attachment 1: Not_52Mn_245MHz_May09_2-3am_s0_1_t8_0.png
|
|
| Attachment 2: Not_52Mn_245MHz_May09_2-3am_s0_1_t8_0.root
|
| Attachment 3: Not_52Mn_245MHz_May09_2-3am_s5_1_t0_5.png
|
|
| Attachment 4: Not_52Mn_245MHz_May09_2-3am_s5_1_t0_5.root
|
|
100
|
Sun May 9 06:53:20 2021 |
Iris, Chris G., Jacobus, Michele | General | Summary night shift |
The tune last night was unfortunately not to 52Mn. The two "isomers" that were identified are instead 45Sc and 75Br. But separation looks okay. ESR morning shift should try to tune to 52Mn to identify the 21-min isomer at 378 keV.

Uploaded some pictures to prove that we were not asleep :-) but they are of limited use...at least my analyzer script and wget works now !! |
|
101
|
Sun May 9 07:16:47 2021 |
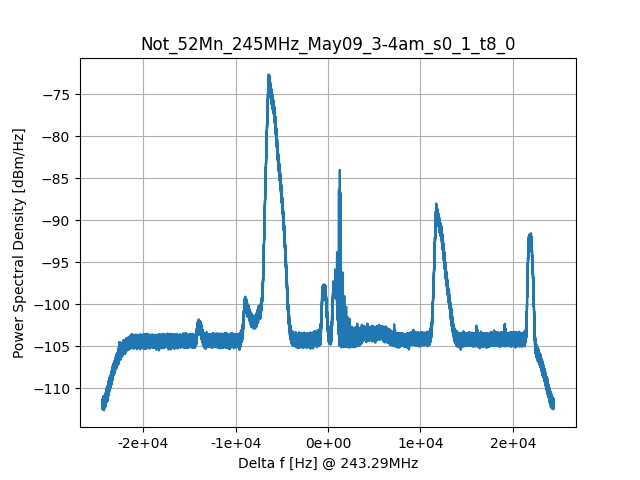
Iris, Chris G., Jacobus, Michele | Analysis | Runs 3-4am Not_Mn52 |
Summed up runs on the 245 MHz detector between 3-4am (computer time).
-s 0.1 -t 8.0 |
| Attachment 1: Not_52Mn_245MHz_May09_3-4am_s0_1_t8_0.root
|
| Attachment 2: Not_52Mn_245MHz_May09_3-4am_s0_1_t8_0.png
|
|
|
94
|
Sun May 9 05:38:29 2021 |
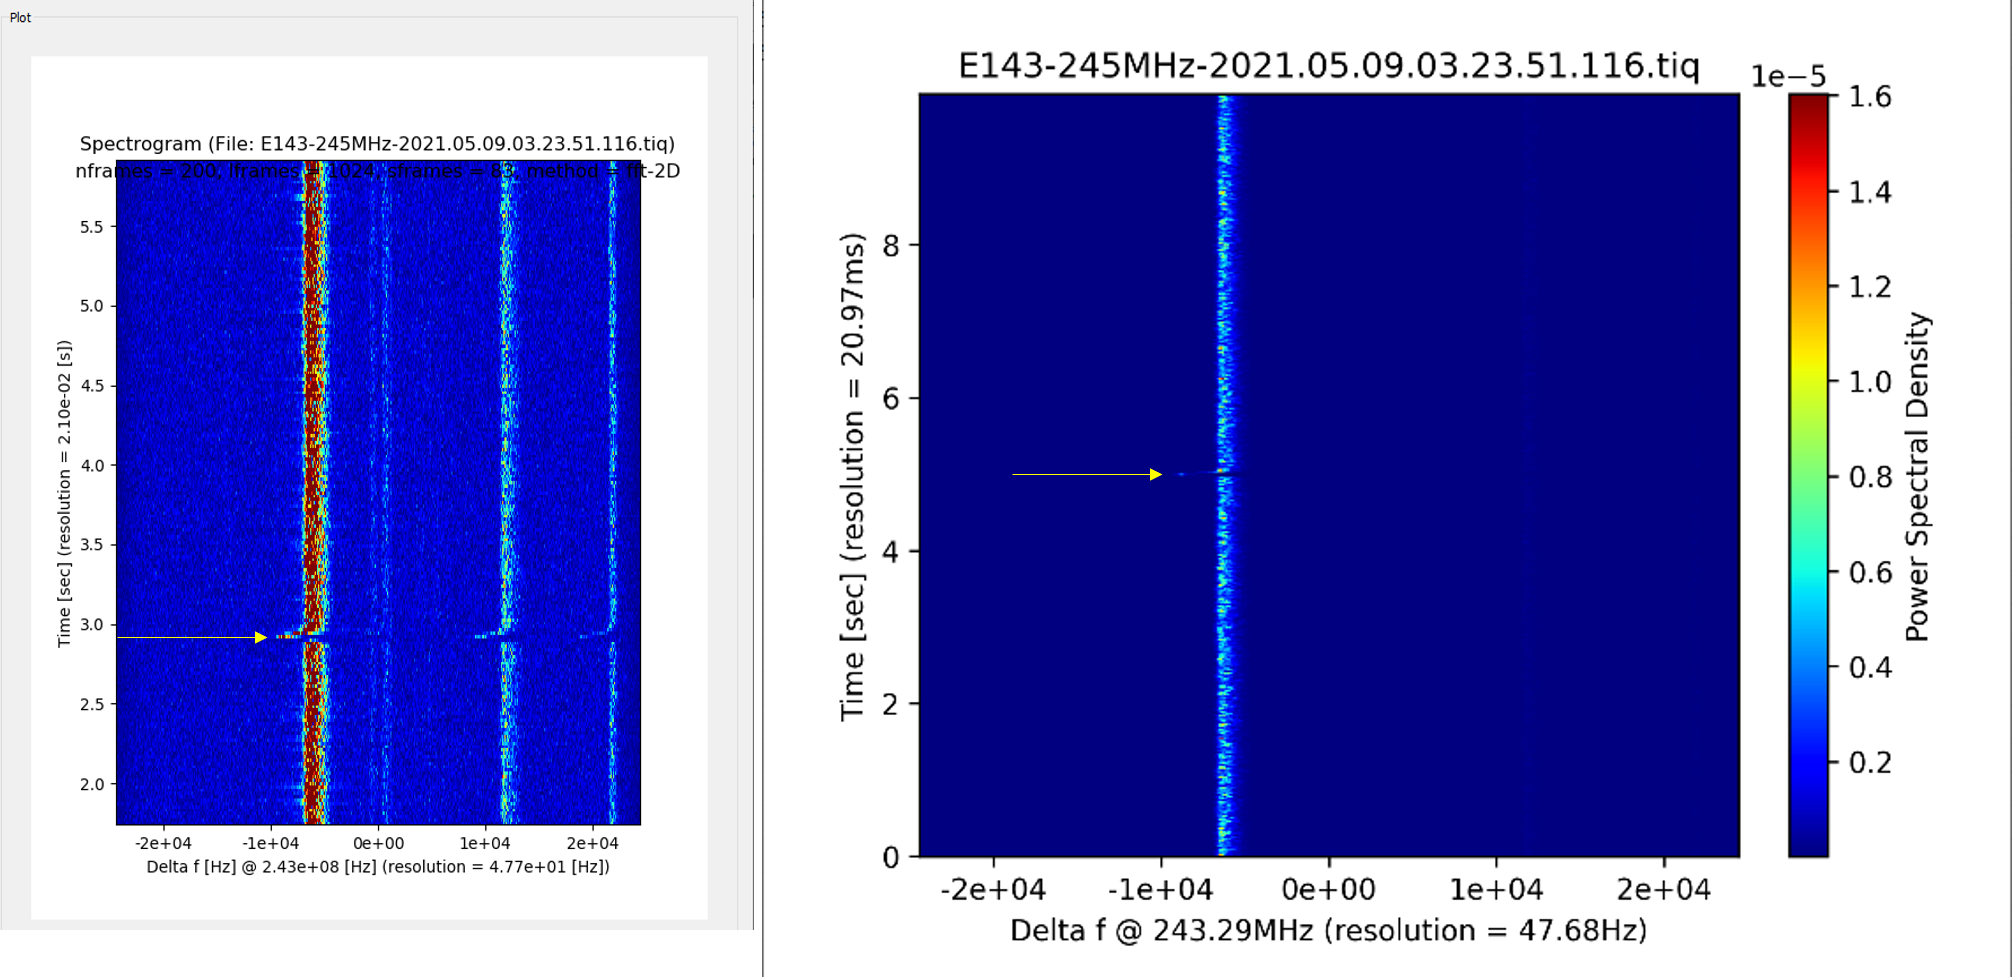
Iris, Chris G. | Analysis | offset btw png and tiq files from server? |
This might have been answered before but I looked at one png file and one tiq file from the same run that was stored on the server. There seems to be an offset of 2.2 s. The png file from the server (right) shows the injection at ~5s, whereas when I look at the tiq file in the GUI (left), the injection is at ~2.8 s???? Is the looper introducing this offset? |
| Attachment 1: comp-116.png
|
|
|
91
|
Sun May 9 03:24:12 2021 |
Iris (Shahab, Jacobus, Chris G., Michele) | Runs | Example of possible 52.Mn isomer |
Short update from Yuri: these are not our isomers. These are 45Sc (left, 12 keV isomer not resolvable) and 75Br (center), and the right-most peak of the triplet is a satellite (has a different line shape, much narrower).


> So the "isomers" pop up at ~-600 Hz and +580 Hz... is the -600 Hz on the left the 378 keV isomer (21 min) and the +580 Hz on the right the g.s.? |
|
93
|
Sun May 9 05:11:55 2021 |
Iris (Chris G., Jacobus, Michele) | Runs | First 52Mn run (no 52Mn unfortunately) |
> Run E143-245 MHz-2021.05.09.01.17.42.265.tiq is the first run of the experiment on 52Mn.


And Run E143-410MHz-2021.05.09.03.27.37.368.tiq	from 2021-05-09 03:27 is the first run on the 410 MHz detector. Started a bit later than the 245 MHz detector.
|
|
127
|
Mon May 10 04:08:13 2021 |
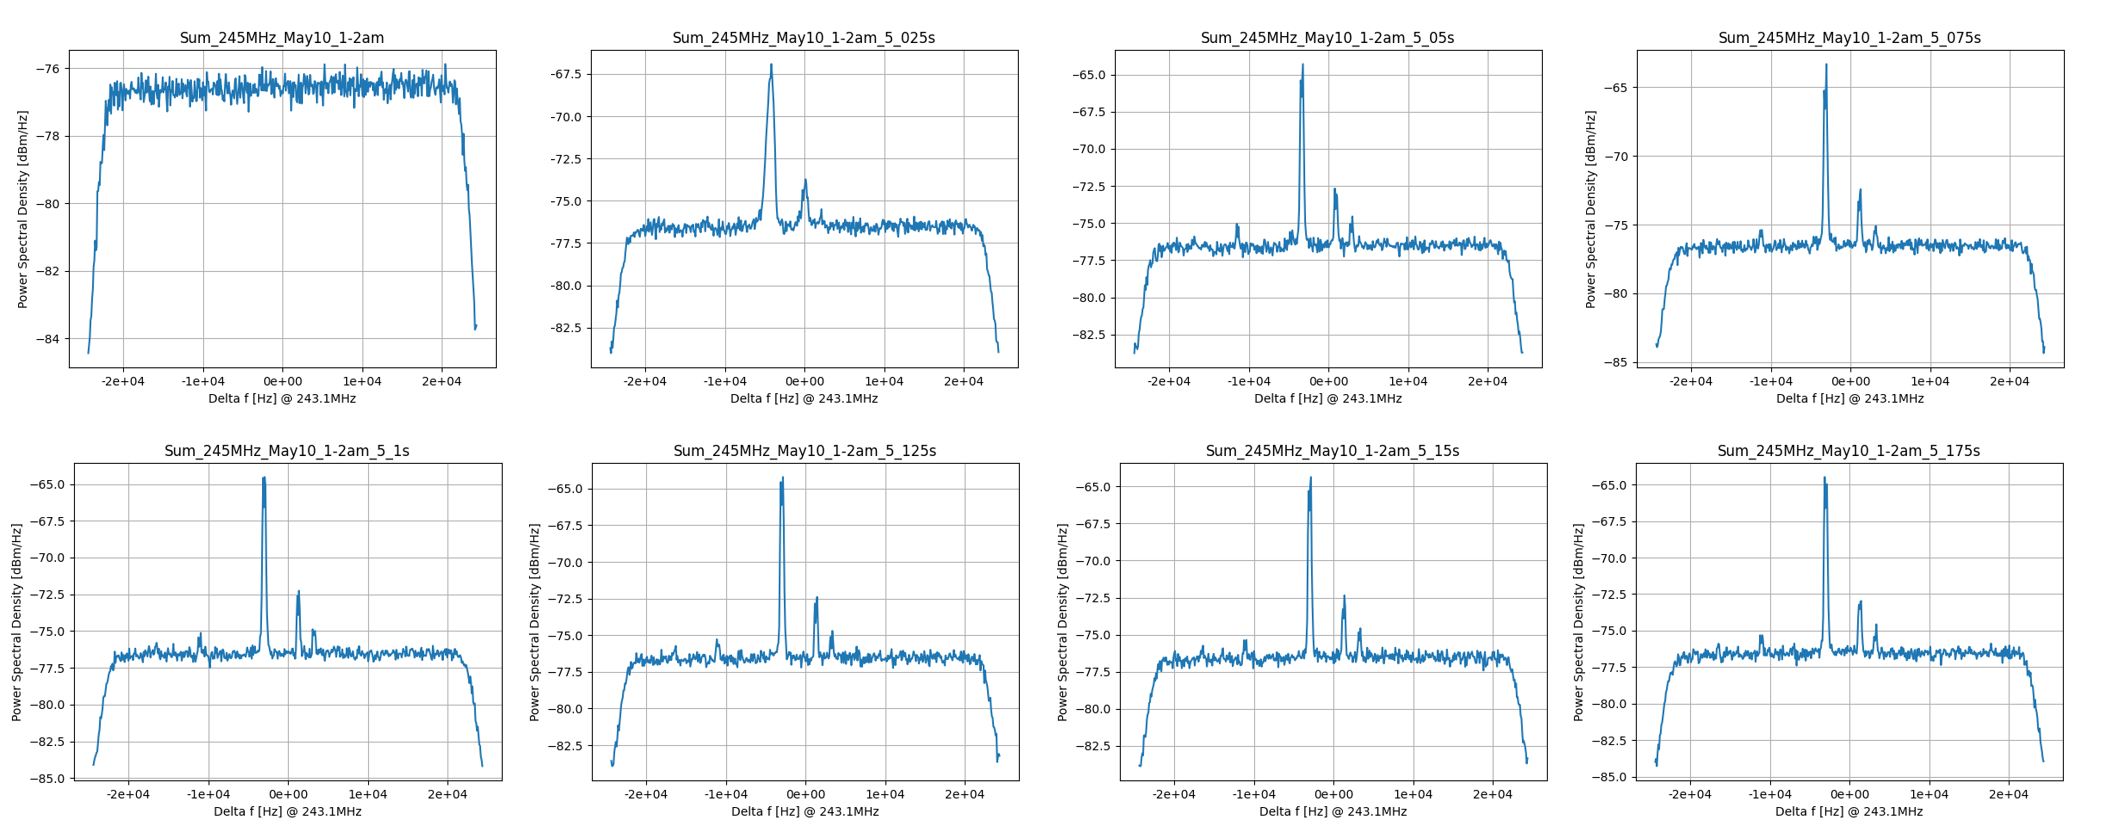
Iris (Chris C., Jeff C.) | Analysis | Comparison between 72Ge: 10th 1-2am on 245 MHz |
> Following Xiangcheng Chen's analysis, I analysed 11 ms time slices separated by 25 ms to see the evolution of the potential isomer across the injection.
>
> Attachment 1: Data from May 7th 19h-20h. -t 11ms progression from -s=5 to -s=5.175
> Attachment 2: Data from May 8th 21h-22h. -t 11ms progression from -s=5 to -s=5.175
>
> The extra resolution gained on the 8th (and potentially other settings too) make the isomer visible where it wasn't present on the 7th.

Hi, attached is the sum of all spectra from 1-2am on May 10th, on the 245 MHz detector. Takes me forever to download everything...
I used the same parameters as Guy and Xiancheng: LFRAMES = 512 (in analyzer); -t 0.011 (= 11 ms) -s 5 ... 5.175 s.

Resolution looks good... :-) |
| Attachment 1: Sum_245MHz_May10-1-2am_5_0-5_175s.png
|
|
|
128
|
Mon May 10 05:25:29 2021 |
Iris (Chris C., Jeff C.) | Analysis | Comparison between 72Ge: 10th 1-2am on 410 MHz |
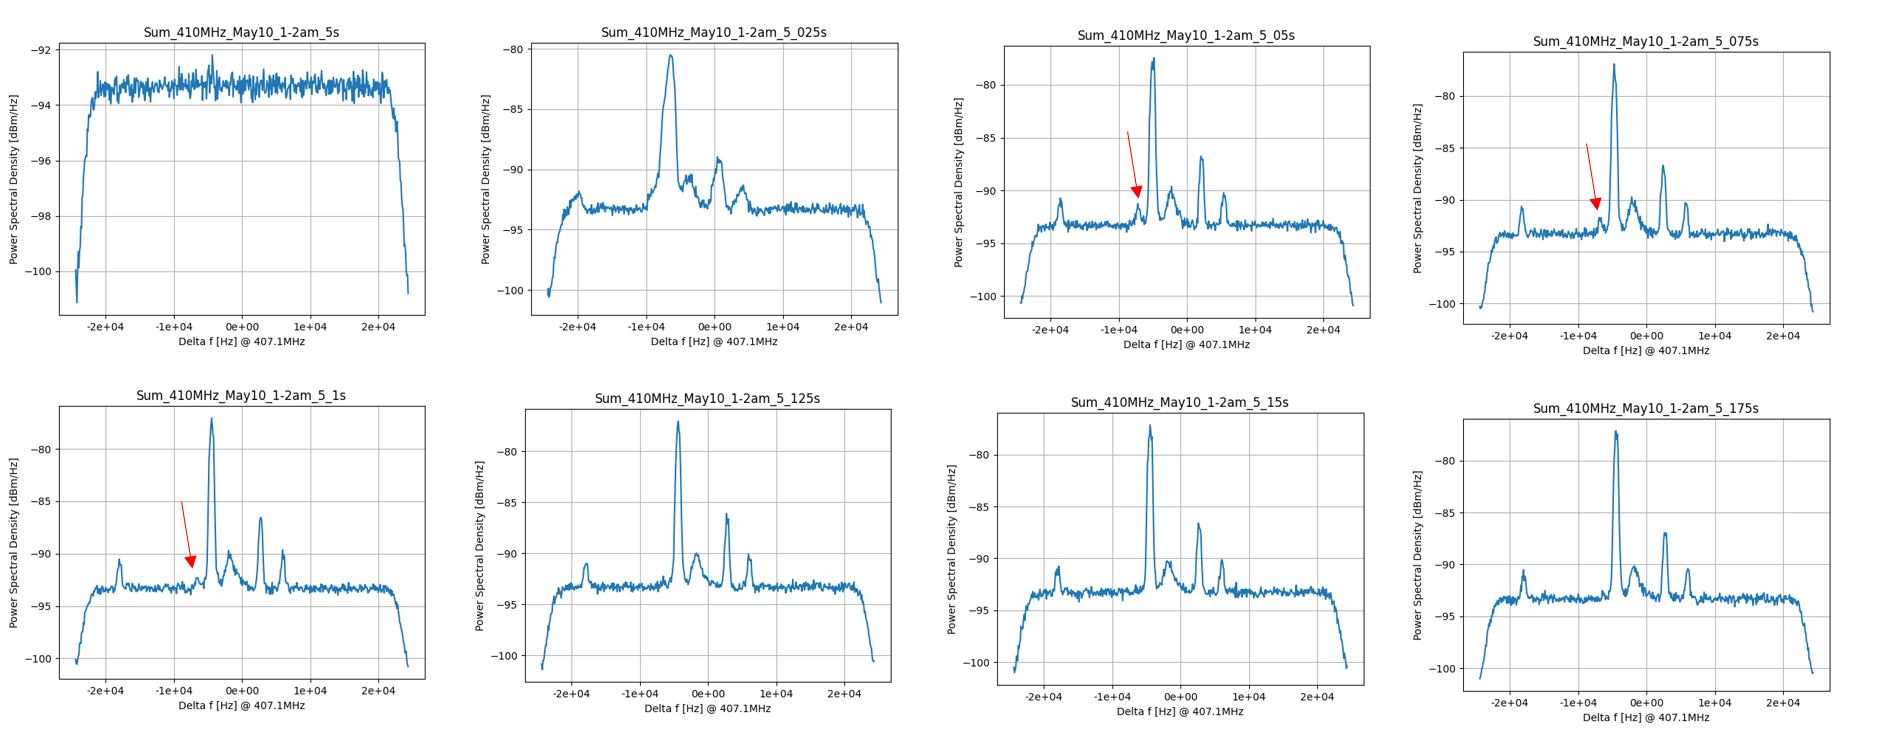
Same as before, but for 410 MHz detectors.
Peaks visible in the 3rd-5th slice.


> > Following Xiangcheng Chen's analysis, I analysed 11 ms time slices separated by 25 ms to see the evolution of the potential isomer across the injection.
> >
> > Attachment 1: Data from May 7th 19h-20h. -t 11ms progression from -s=5 to -s=5.175
> > Attachment 2: Data from May 8th 21h-22h. -t 11ms progression from -s=5 to -s=5.175
> >
> > The extra resolution gained on the 8th (and potentially other settings too) make the isomer visible where it wasn't present on the 7th.
>
> Hi, attached is the sum of all spectra from 1-2am on May 10th, on the 245 MHz detector. Takes me forever to download everything...
> I used the same parameters as Guy and Xiancheng: LFRAMES = 512 (in analyzer); -t 0.011 (= 11 ms) -s 5 ... 5.175 s.
>
> Resolution looks good... :-) |
| Attachment 1: Sum_410MHz_May10-1-2am_5_0-5_175s.png
|
|
| Attachment 2: Sum_410MHz_May10_1-2am_5_175s.root
|
| Attachment 3: Sum_410MHz_May10_1-2am_5_15s.root
|
| Attachment 4: Sum_410MHz_May10_1-2am_5_125s.root
|
| Attachment 5: Sum_410MHz_May10_1-2am_5_1s.root
|
| Attachment 6: Sum_410MHz_May10_1-2am_5_075s.root
|
| Attachment 7: Sum_410MHz_May10_1-2am_5_05s.root
|
| Attachment 8: Sum_410MHz_May10_1-2am_5_025s.root
|
|
130
|
Mon May 10 06:22:15 2021 |
Iris (Chris C., Jeff C.) | Analysis | Comparison between 72Ge: 10th 1-2am on 410 MHz |
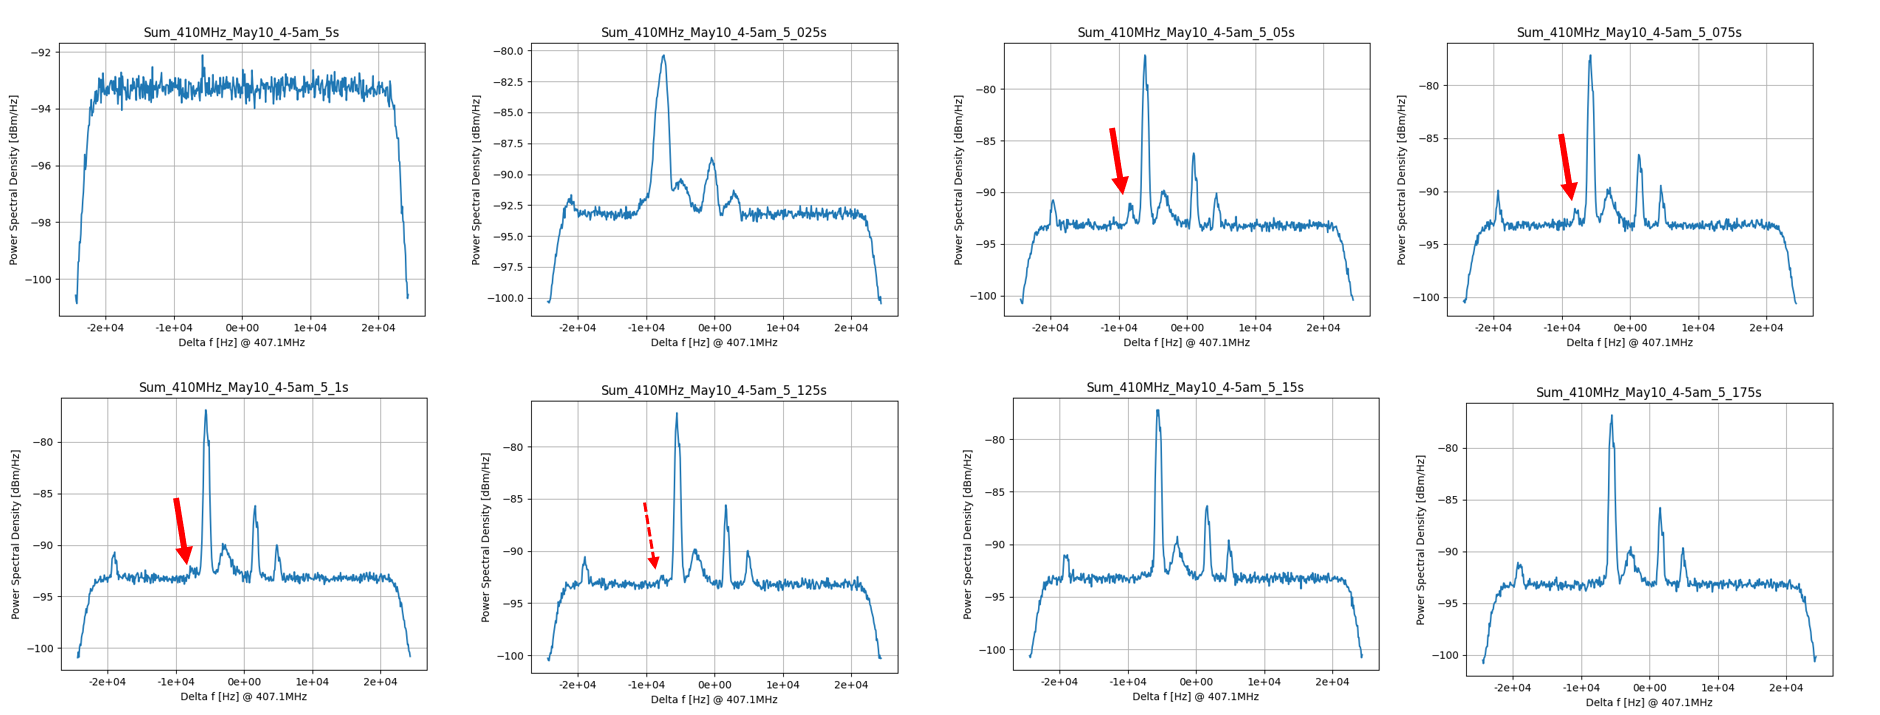
Same as before but for 4-5am on 410 MHz detector. Peak visible.


> Same as before, but for 410 MHz detectors.
> Peaks visible in the 3rd-5th slice.
>
>
> > > Following Xiangcheng Chen's analysis, I analysed 11 ms time slices separated by 25 ms to see the evolution of the potential isomer across the injection.
> > >
> > > Attachment 1: Data from May 7th 19h-20h. -t 11ms progression from -s=5 to -s=5.175
> > > Attachment 2: Data from May 8th 21h-22h. -t 11ms progression from -s=5 to -s=5.175
> > >
> > > The extra resolution gained on the 8th (and potentially other settings too) make the isomer visible where it wasn't present on the 7th.
> >
> > Hi, attached is the sum of all spectra from 1-2am on May 10th, on the 245 MHz detector. Takes me forever to download everything...
> > I used the same parameters as Guy and Xiancheng: LFRAMES = 512 (in analyzer); -t 0.011 (= 11 ms) -s 5 ... 5.175 s.
> >
> > Resolution looks good... :-) |
| Attachment 1: Sum_410MHz_May10-4-5am_5_0-5_175s.png
|
|
| Attachment 2: Sum_410MHz_May10_4-5am_5_1s.root
|
| Attachment 3: Sum_410MHz_May10_4-5am_5_05s.root
|
| Attachment 4: Sum_410MHz_May10_4-5am_5_15s.root
|
| Attachment 5: Sum_410MHz_May10_4-5am_5_025s.root
|
| Attachment 6: Sum_410MHz_May10_4-5am_5_075s.root
|
| Attachment 7: Sum_410MHz_May10_4-5am_5_125s.root
|
| Attachment 8: Sum_410MHz_May10_4-5am_5_175s.root
|
| Attachment 9: Sum_410MHz_May10_4-5am_5s.root
|
|
132
|
Mon May 10 07:13:20 2021 |
Iris (Chris C., Jeff C.) | Analysis | Comparison between 72Ge: 10th 5-6am on 410 MHz |
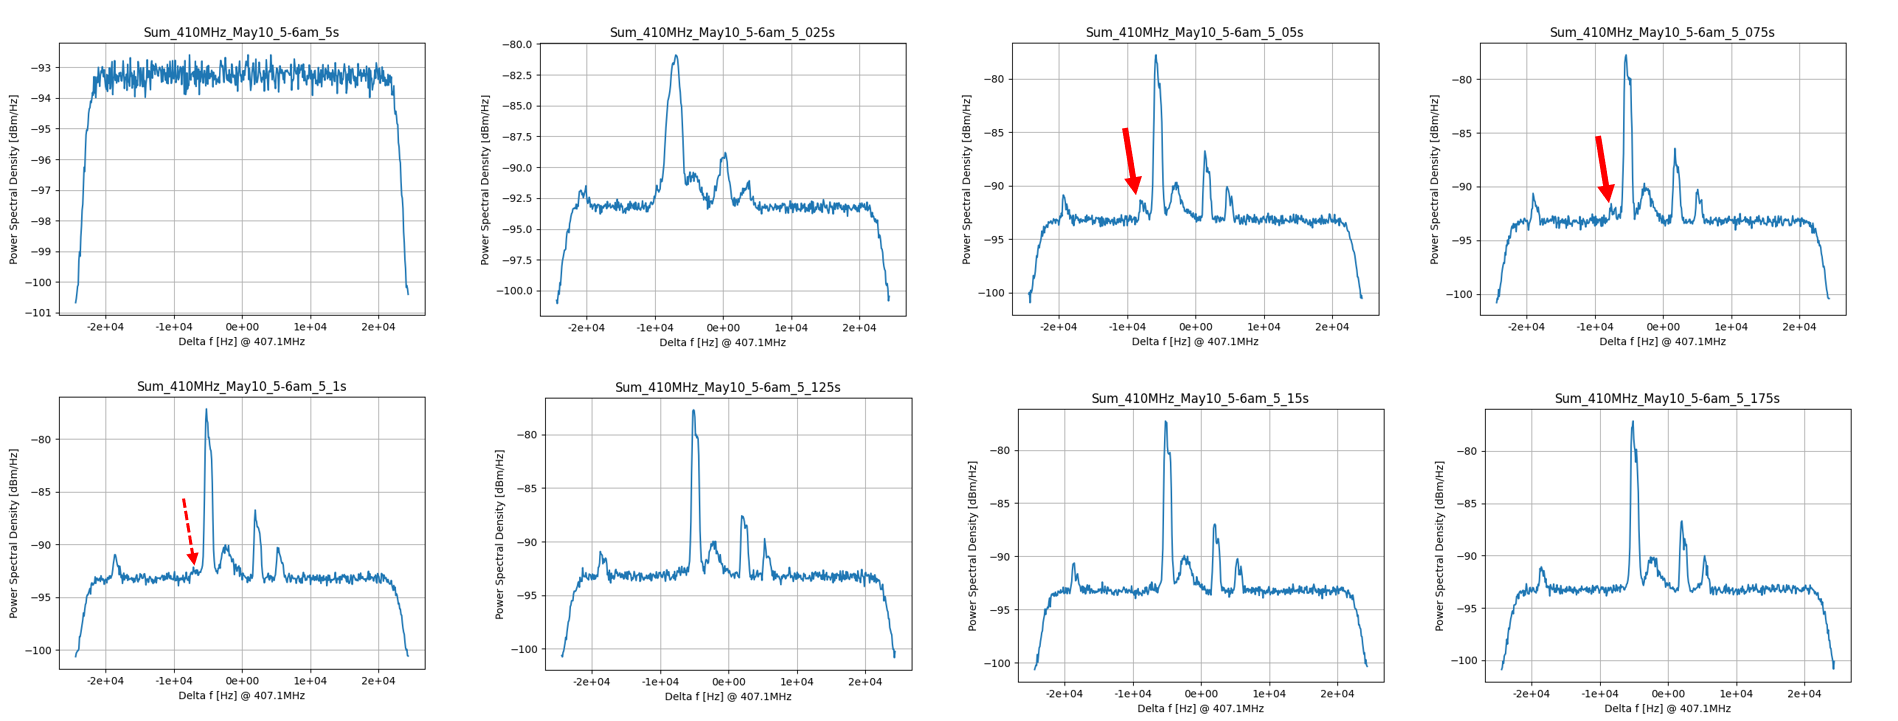
Same as before for 5-6 am.
Peak still there, maybe a bit less than before.


> Same as before but for 4-5am on 410 MHz detector. Peak visible.
>
>
> > Same as before, but for 410 MHz detectors.
> > Peaks visible in the 3rd-5th slice.
> >
> >
> > > > Following Xiangcheng Chen's analysis, I analysed 11 ms time slices separated by 25 ms to see the evolution of the potential isomer across the injection.
> > > >
> > > > Attachment 1: Data from May 7th 19h-20h. -t 11ms progression from -s=5 to -s=5.175
> > > > Attachment 2: Data from May 8th 21h-22h. -t 11ms progression from -s=5 to -s=5.175
> > > >
> > > > The extra resolution gained on the 8th (and potentially other settings too) make the isomer visible where it wasn't present on the 7th.
> > >
> > > Hi, attached is the sum of all spectra from 1-2am on May 10th, on the 245 MHz detector. Takes me forever to download everything...
> > > I used the same parameters as Guy and Xiancheng: LFRAMES = 512 (in analyzer); -t 0.011 (= 11 ms) -s 5 ... 5.175 s.
> > >
> > > Resolution looks good... :-) |
| Attachment 1: Sum_410MHz_May10-5-6am_5_0-5_175s.png
|
|
| Attachment 2: Sum_410MHz_May10_5-6am_5s.root
|
| Attachment 3: Sum_410MHz_May10_5-6am_5_025s.root
|
| Attachment 4: Sum_410MHz_May10_5-6am_5_05s.root
|
| Attachment 5: Sum_410MHz_May10_5-6am_5_075s.root
|
| Attachment 6: Sum_410MHz_May10_5-6am_5_1s.root
|
| Attachment 7: Sum_410MHz_May10_5-6am_5_125s.root
|
| Attachment 8: Sum_410MHz_May10_5-6am_5_15s.root
|
| Attachment 9: Sum_410MHz_May10_5-6am_5_175s.root
|
|
90
|
Sun May 9 02:51:44 2021 |
Iris | Runs | Example of possible 52.Mn isomer |
So the "isomers" pop up at ~-600 Hz and +580 Hz... is the -600 Hz on the left the 378 keV isomer (21 min) and the +580 Hz on the right the g.s.? |