| ID |
Date |
Author |
Category |
Subject |
|
171
|
Fri Apr 8 22:26:44 2022 |
Patrick | DAQ | Spike in all detectors |
In the previous shift, there was a spike in all detectors in the same scan step. Apparently, this was NOT a resonance since in the next step it appeared again but at a different wavelength.
The current hypothesis is, that this is a disruption signal from one of the machines. |
|
172
|
Fri Apr 8 23:56:07 2022 |
Patrick | DAQ | DAQ improvement |
As requested in ID:146 and ID:147, the laserscan tab was improved:
- The laserscan tab shows each observable plotted against the predefined wavelength setpoints now.
- The Kobra set wavelength shows the actual setpoints now and not measured wavelengths.
Note: The bins of the laserscan histograms are defined in TLdaAnlProc.cxx, lines 140-142.
At the moment, the histograms are set up for scans in the range 320 - 325 nm and step sizes of 0.01 nm.
If the step size changes or scans that exceed this range are required, these parameters should be adjusted.
Remember to add or subtract half of the step size to your min. and max. wavelength to prevent binning artifacts.
Then of course, also only scan wavelengths which are multiples of your step size. |
|
174
|
Sat Apr 9 03:27:47 2022 |
Patrick | DAQ | Laser scanning |
DAQ1: lxg1927:/data.local2/BeamTimeTh22/
DAQ2: lxg0155:/data.local2/E142/
LMD file name DAQ1:229Thor
LMD file name DAQ2:229Th
Shottky marker pos: 243.973MHz
|
Time | SIS-intensity | cooler-HV | LMD-DAQ1 | LMD-DAQ2 | scan range(nm) | step width(nm) | dwell time(s) | comments
| |
xx:xx | x.xe9 | 209xxx | 00xx | 78xx | 32x.x - 32x.x | 0.01 | x | sketch for filling the table
| |
04:13 | 1.4e9 | 209614 | 0093 | 7831 | 323.2 - 321.2 | 0.01 | 4 | First laser scan this night shift
| |
04:46 | 1.3e9 | 209616 | 0094 | 7832 | 323.2 - 321.2 | 0.01 | 4 |
| |
05:17 | 1.0e9 | 209617 | 0095 | 7833 | 323.2 - 321.2 | 0.01 | 4 | The laser left the screen between the two loops
| |
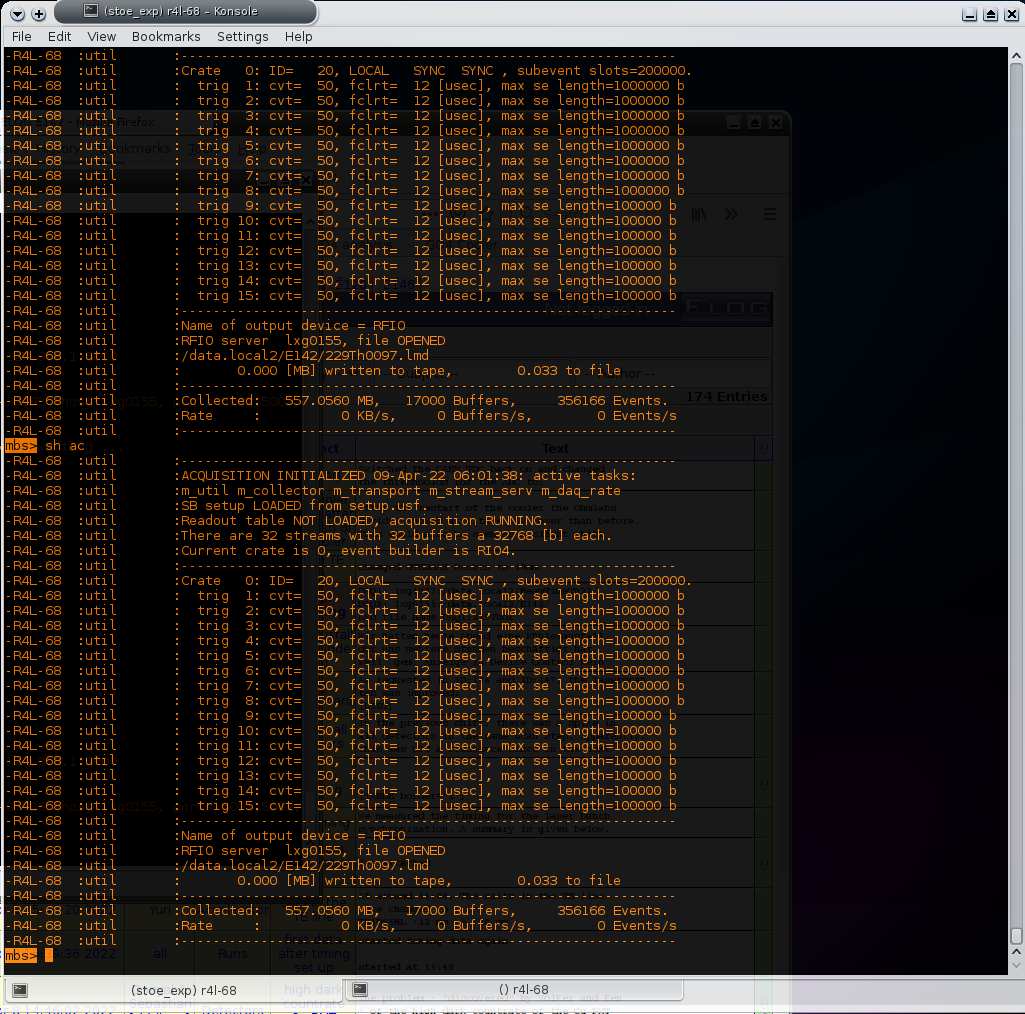
05:54 | 1.5e9 | 209619 | 0097 | 7835 | 323.2 - 321.2 | 0.01 | 4 | go4 on DAQ2 does not show any events. mbs does not write to file although it is OPEN and the acq is RUNNING
|
|
| Attachment 1: does_not_write_data_to_file.png
|
|
|
178
|
Sat Apr 9 04:40:01 2022 |
Patrick | DAQ | Bugged Trending plots? |
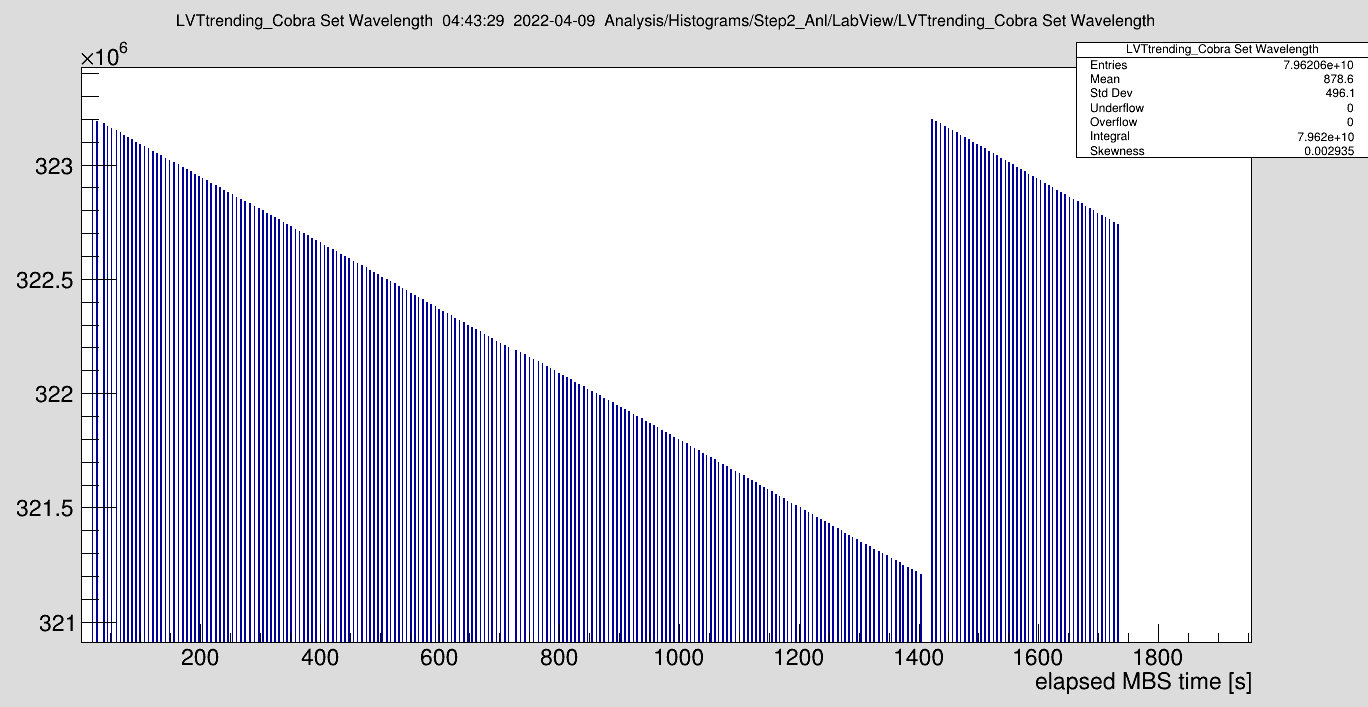
| The problem from yesterday (ID:147) still persists. All the plots (not only the labview stuff) comes in too late in go4. However, the time axis is correct, see picture. |
| Attachment 1: 2022-04-09_Cobra_set_wavelength2.png
|
|
|
184
|
Sat Apr 9 14:15:44 2022 |
Kristian, Max, Konstantin | DAQ | Change in LV code |
We changed the LV code so that the Cobra Set Wavelength is permanently sent. Before it was only sent once at the beginning of each laser step. This, however, lead to too much data for the LV->MBS server.
This was fixed by inserting a 250 ms wait in LV (in Krypton data VI). Basically, all LV values are now updated every 250 ms, which works fine with MBS |
|
190
|
Sun Apr 10 02:20:17 2022 |
Patrick | DAQ | New mbs startup guide |
Connecting to the rfio server and opening a file is included in '@startup' now. Since mbs crashes reliably every 3 or 4 runs, it may be preferable to use the following procedure (which did not crash yet):
|
| DAQ1 | DAQ2
| |
1 | ssh atplaser@r4l-41 | ssh stoe_exp@r4l-68
| |
2 | ThE142_2022 | see ID:179
| |
3 | cd mbsrun/th22 | cd mbsrun/th22cd /esr/usr/stoe_exp/E142Brandau/SCA... (auto complete with tab)
| |
// loop start | |
| |
4 | resl | resl
| |
5 | mbs | mbs
| |
6 | @startup | @startup
| |
7 | // connect go4 | // connect go4
| |
8 | sta ac | sta ac
| |
9 | // measure | // measure
| |
10 | sto ac | sto ac
| |
11 | clo fi | clo fi
| |
12 | exit | exit
| |
13 | // disconnect go4 | // disconnect go4
| |
14 | // go to step 4 | // go to step 4
|
Note: At least in DAQ1, step 13 is necessary to be able to reconnect mbs to the rfio server. |
|
192
|
Sun Apr 10 04:07:53 2022 |
Patrick | DAQ | go4 shows wrong frequencies and wavelengths |
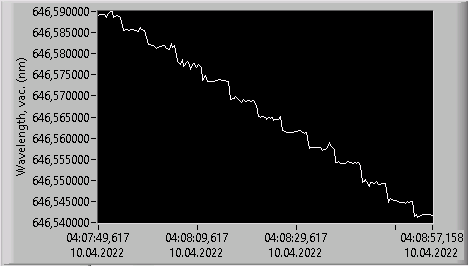
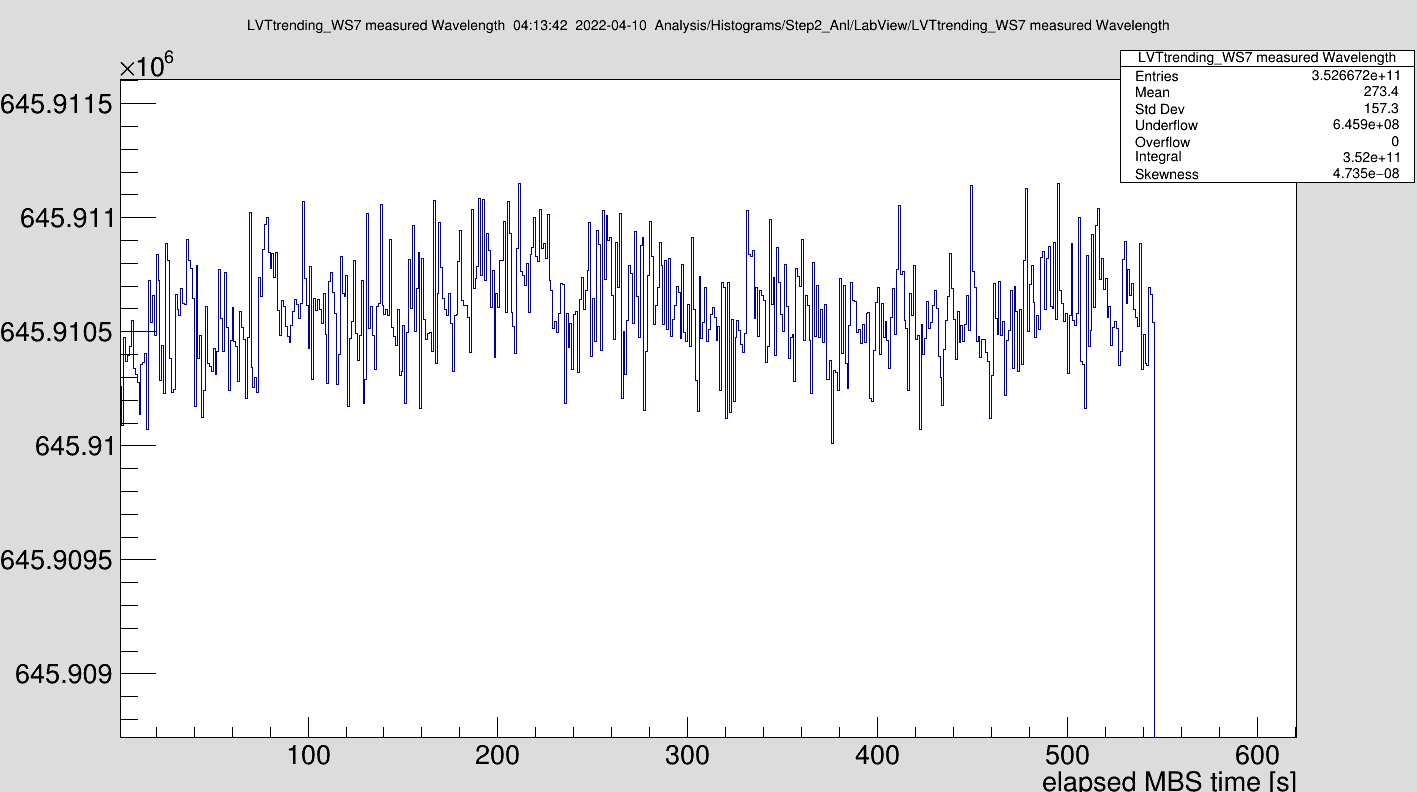
Update (ID:194): In labview "Stop All", close labview, stop python script (ID:197), close wavemeter. Then restart wavemeter, python script, labview an mbs.
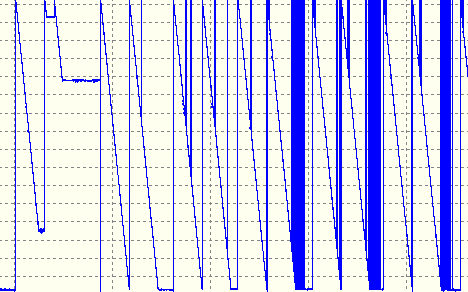
Both labview and the wavemeter software are displaying the scanned wavelength correctly (Fig. 1 & 2), but go4 shows something which looks just like a freely drifting wavelength (Fig. 3).
The Cobra set voltages are displayed correctly. |
| Attachment 1: 2022-04-10_measured_wavel.png
|
|
| Attachment 2: 2022-04-10_measured_wavel2.png
|
|
| Attachment 3: 2022-04-10_measured_wavel_go4.png
|
|
|
193
|
Sun Apr 10 04:37:29 2022 |
Patrick | DAQ | Next wavelength range |
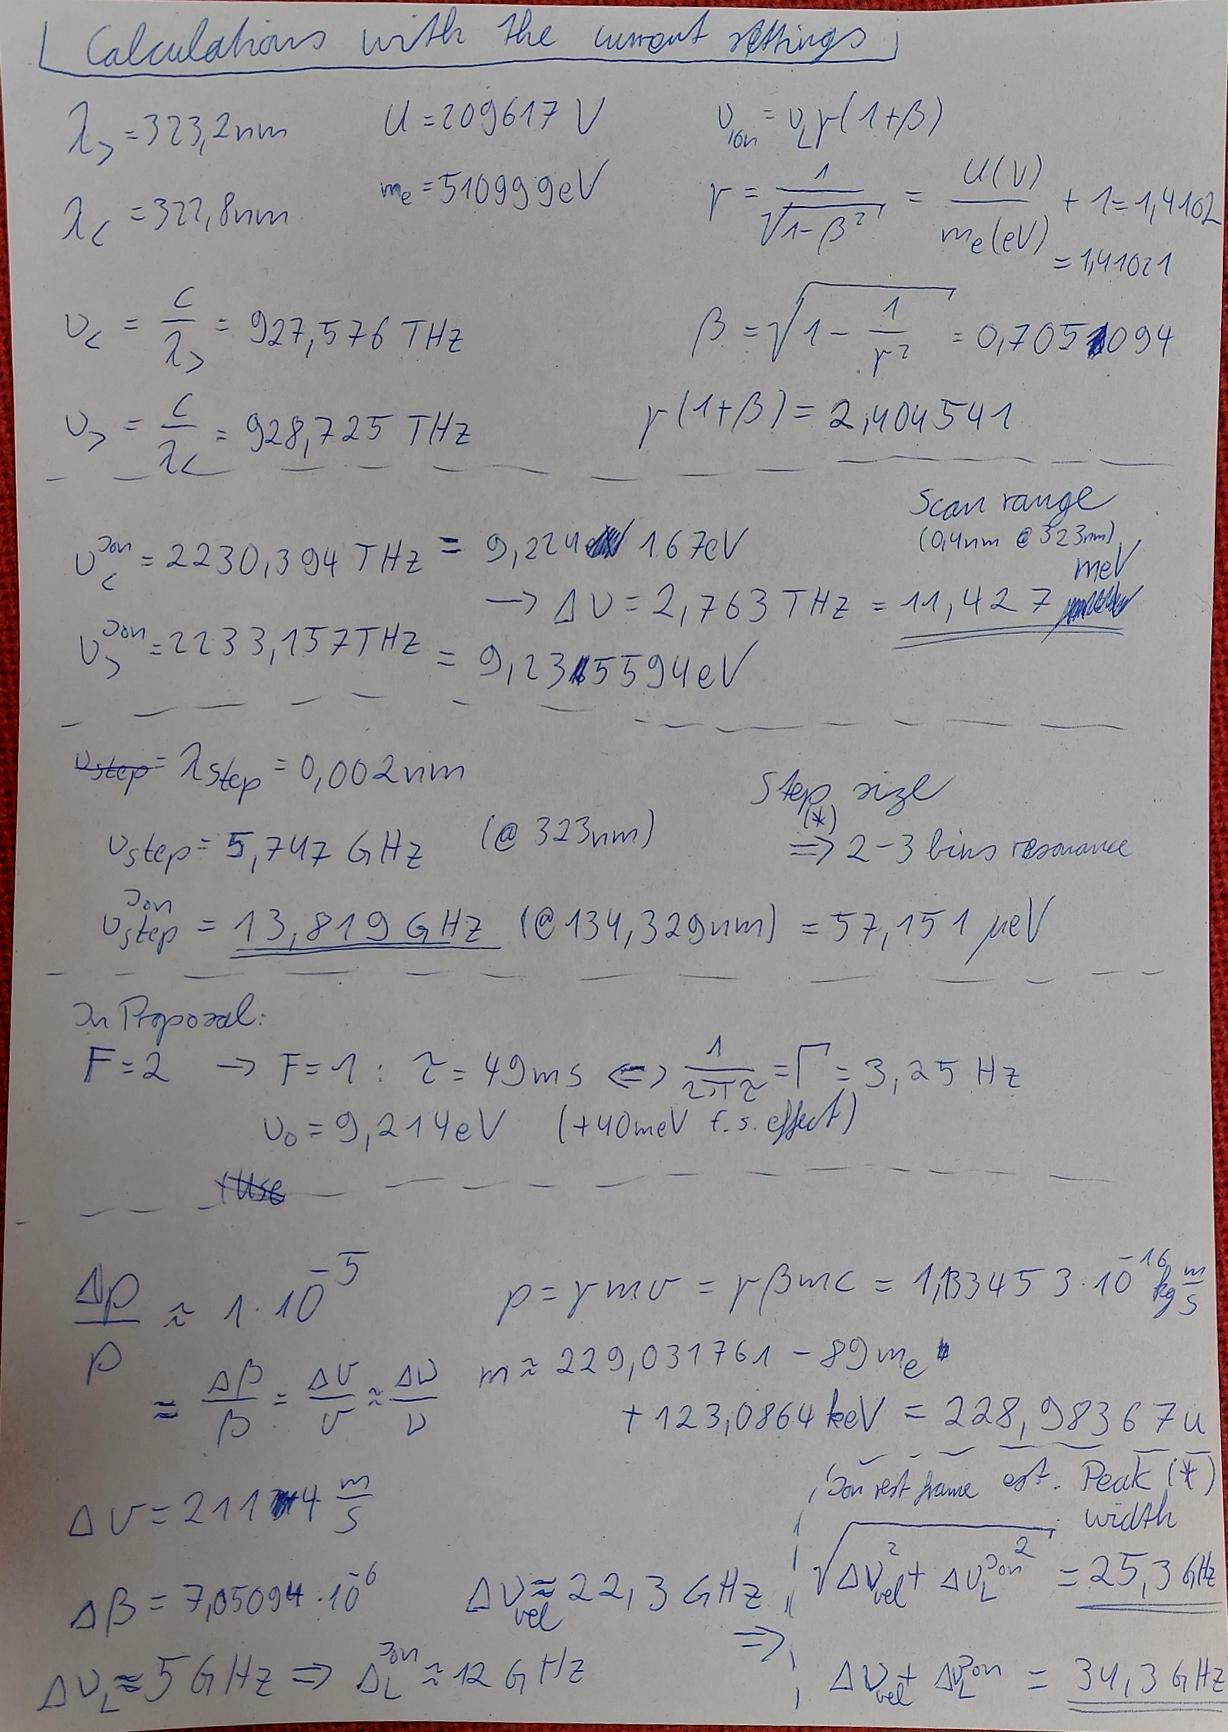
Measurements with the next wavelength scan range should be started roughly around 12:00 noon. The plan is to go to lower wavelengths / higher energies.
So the next wavelength scan range would be 322.81 - 322.4 nm, again with a step size of 0.002 nm and 5s dwell time.
In the picture below you find some calculations/estimates for the current scan range. |
| Attachment 1: 2022-04-10_calculations_323nm.jpg
|
|
|
194
|
Sun Apr 10 06:34:49 2022 |
Kristian, Max | DAQ | Wavemeter Readout |
Problem solved. Ignore this entry


If the wavemeter reading is not shown correctly in Go4 - Step2 - Labview:

Close Labview, close WM software (all windows)

Start WM software, start Labview, restart MBS |
|
198
|
Sun Apr 10 13:17:53 2022 |
Kristian, Max | DAQ | Wavemeter readout |
We changed the Labview code in order to reduce the amount of data that was overfilling the WM data queue. We removed the temperature and intensity values and added an additional 250ms wait.
We have the same wait in the Krypton VI and believed that it also slowed down the WM reading but this was obviously not the case.
Everything seems to work fine now!
Starting with the .lmd files 0151 / 7887 also the WM reading values are correct |
|
199
|
Sun Apr 10 15:08:42 2022 |
Carsten | DAQ | Backup of Data from 1rst Scanrange to extrenal RAID1 HDDs |
I just performed a backup of all data (+log-Files) that were collected until now to the two RAID HDDs.

For DAQ1: /media/sdc2 - last file 229Thor7889.lmd. Please note, that the naming sceme on DAQ1 is inconsistent - please look for the filenumnbering
For DAQ2: /media/sdd2 - last file 229Th0153.lmd |
|
204
|
Mon Apr 11 04:26:53 2022 |
Patrick | DAQ | Next wavelength range |
Measurements with the next wavelength scan range should be started roughly around 10:00 am.
The next wavelength scan range is planned to be 322.41 - 322.00 nm, again with a step size of 0.002 nm, 5s dwell time and 2 loops.
This range includes roughly a third of the first scan range. |
|
19
|
Thu Mar 17 17:56:33 2022 |
Kristian | Calibration | HV dividers |
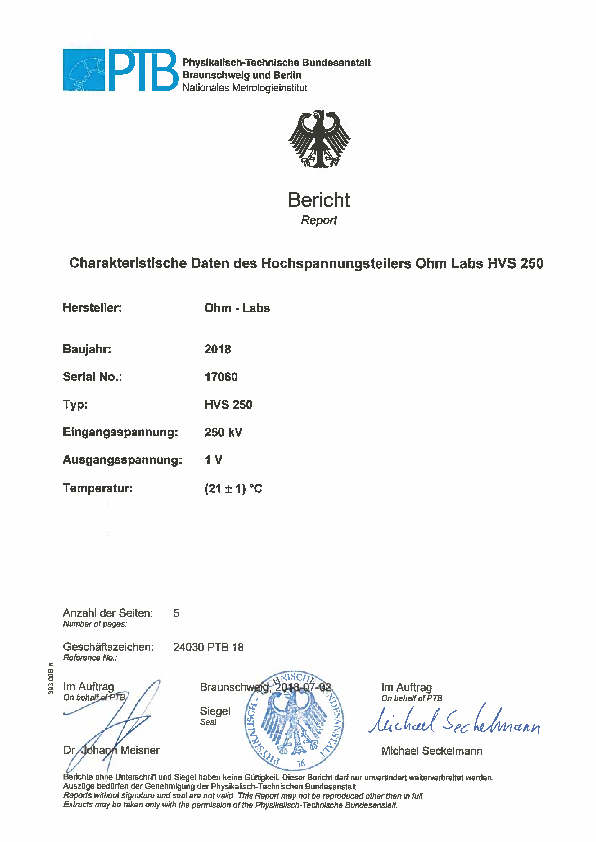
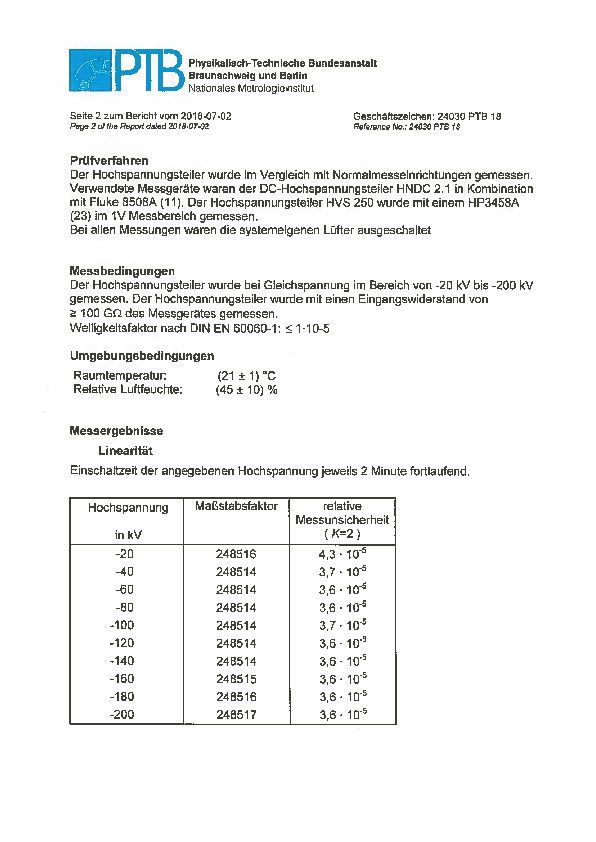
PTB HV dividers arrived. Divider ratios are:

PT120:          12003,341
PT200.1:        19859,033
Ohmlabs: 248517 |
| Attachment 1: Bericht_PTB_verbesserter_Teiler_2018.pdf
|
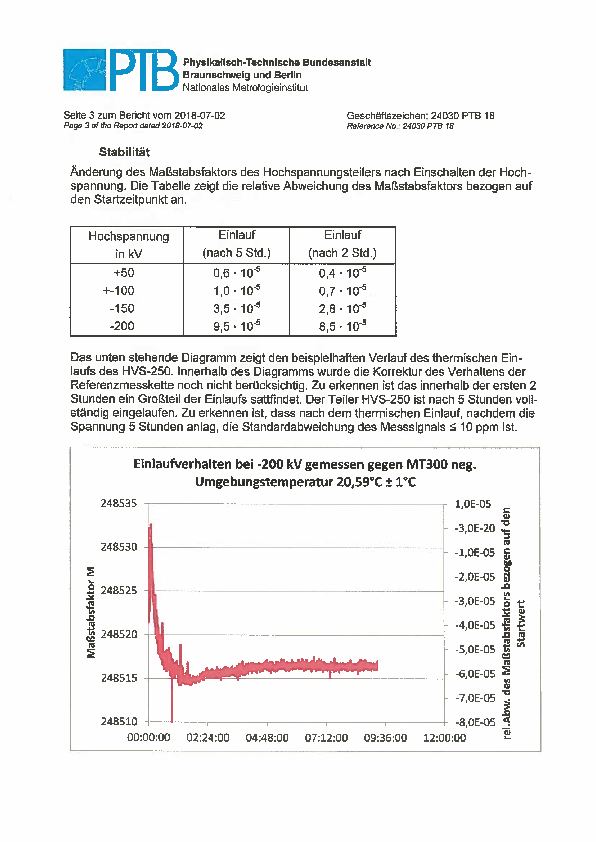
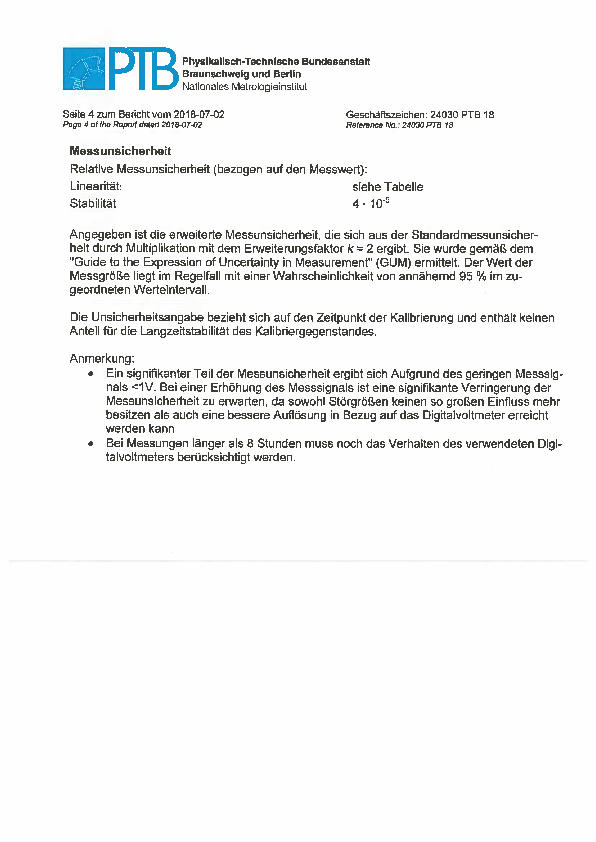
|
|
46
|
Thu Mar 31 22:41:35 2022 |
Kristian | Calibration | HV divider |
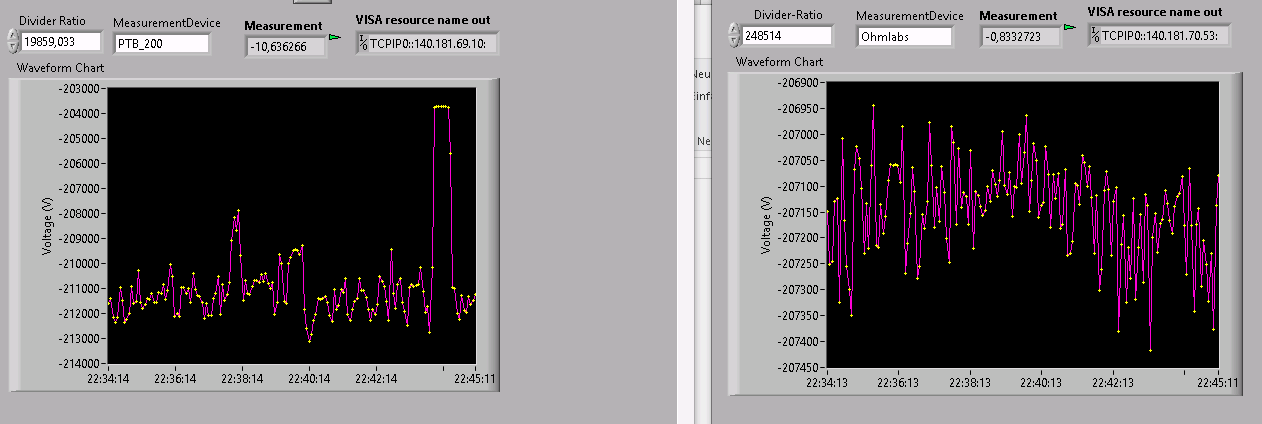
We noticed a difference in the electron cooler high voltage:

The set voltage is ~205 kV, the Ohmlabs divider measures 207 kV and the PTB200 shows a value of ~212 kV. The latter is doing some crazy jumps of up to 10 kV, see screenshot. The Ohmlabs divider is stable

Maybe some small discharges? |
| Attachment 1: HV-divider2.png
|
|
|
56
|
Fri Apr 1 18:19:58 2022 |
Kristian | Calibration | HV divider |
We checked the strange behavior of the HV dividers again. The Ohmlabs and the PTB divider are in good agreement at 120 kV and 150 kV. There, both dividers deviated by 0.35% from the value on the HKR multimeter. Ohmlabs divider yields higher voltage.

At higher voltages (180 kV, 195 kV and 205 kV) the PTB divider showed jumps. The deviation between Ohmlabs divider and set value increased at higher voltages up to 2 %.  Ohmlabs divider was fluctuating at 10 V scale but center was stable.

We removed the PTB divider.

Afterwards, the fluctuation of the Ohmlabs divider are at the 1 V level. Deviation between Ohmlabs divider and set value is now 0.35 % at 205 kV. Same as in the low voltage range with the well-working PTB divider. |
|
83
|
Sun Apr 3 18:52:30 2022 |
Konstantin | Calibration | Laser ion beam overlap |
We measured vertical and horizontal ion beam positions. Unfortunately, the horizontal scraper positions can not be manipulated
by the "Device Control" software. Robert Boywitt has supported us a lot to get the drives moving by using the expert software on
a local control PC, which can only be remotely accessed from beapc032 with the usual experiment account "atplaser". In the first
try we were only able to determine the vertical positions of a beam which was not the 229Th (positions were measured already on
Sunday, 03.04.)
|
Scraper | ion beam position (outer->inner) | |
GECEDS2VU | -1.3(2) mm | |
GECEDS1VU | -0.7(2) mm | |
|
Finally, we got 229Th (Wednesday, 06.04.) and were able to measure the ion beam positions. Those are
summarized in the following table. The first values are those were the scraping begins, hence representing the
edge of the ion beam. The second values represent the central positions of the ion beam.
|
Scraper | ion beam position (outer->inner) | ion beam position (inner->outer)
| |
GECEDS2VU | -1.6(2) mm / -1.3(2) mm | | |
GECEDS2HA | -13.8(2) mm / -13.4(2) mm | -4.0(2) mm / -4.6(2) mm | |
GECEDS1VU | -1(4) mm / -0.9(2) mm | | |
GECEDS1HA | -18.1(2) mm / -17.6(2) mm | -7.7(2) mm / -8.2(2) mm | |
|
Schreenshots taken at scraper positions are given in Entry 142 |
|
142
|
Thu Apr 7 16:50:22 2022 |
Konstantin | Calibration | Spacial laser-ion overlap |
Laser-ion-beam overlap was achieved after measuring the ion beam positions (compare Entry 83).
Screenshots are comprised in the following table.
|
|
143
|
Thu Apr 7 19:13:26 2022 |
Konstantin, Patrick | Calibration | How to find the correct laser position |
In order to achieve the correct laser ion beam superposition one needs to do the following steps:
- If the laser stabilization is still running, turn both stages off and block the main amplifier.
- Ensure that the laser spot is centered on the paper screen, which is located in top of the laser tower in the south (ATTENTION: please only use the preamplifier and not the main amplifier!!! If you're unsure what you are doing please contact Rodolfo or Konstantin).
- If this is not the case and the beam is completely off, have a look at the MRC Stabilization system. If it is running, close the software and turn the hardware off and on again. The spot will leave its position and come back after the stabilization is turned on again.
- If it is still not centered, use and only use the piezo mirror (the one with red screws) to bring back the spot.
- Remove the paper screen and then turn on the main amplifier.
- Restart the software and put in the values from the file 07-04-2022(...).png. Start the two stabilization stages in the software. The laser spot should move back to the correct position.

|
|
169
|
Fri Apr 8 17:44:25 2022 |
Konstantin | Calibration | Final Timing |
We measured the timing for the laser bunch synchronization. A summary is given below.
|
detector | time till common stop [bins] | time till common stop [ns]
| |
PD North | 28 | 93.33 | |
PD South | 63 | 210 | |
Particle Detector South | 14 | 46.67 | |
Particle Detector North | 94 | 313.33 | |
PMT middle | 119 | 396.67
|
Using all numbers, the difference between the center of the photodiodes and PMT middle is
given by 245ns, which corresponds to the half revolution period of 256 ns. Difference between the
center of both photodiodes and particle detector south is given by 105 ns.
The delay for the laser trigger is now set correctly. |
|
10
|
Fri Nov 19 15:50:44 2021 |
Rodolfo | Accelerator | Laser windows at E-Cooler side |
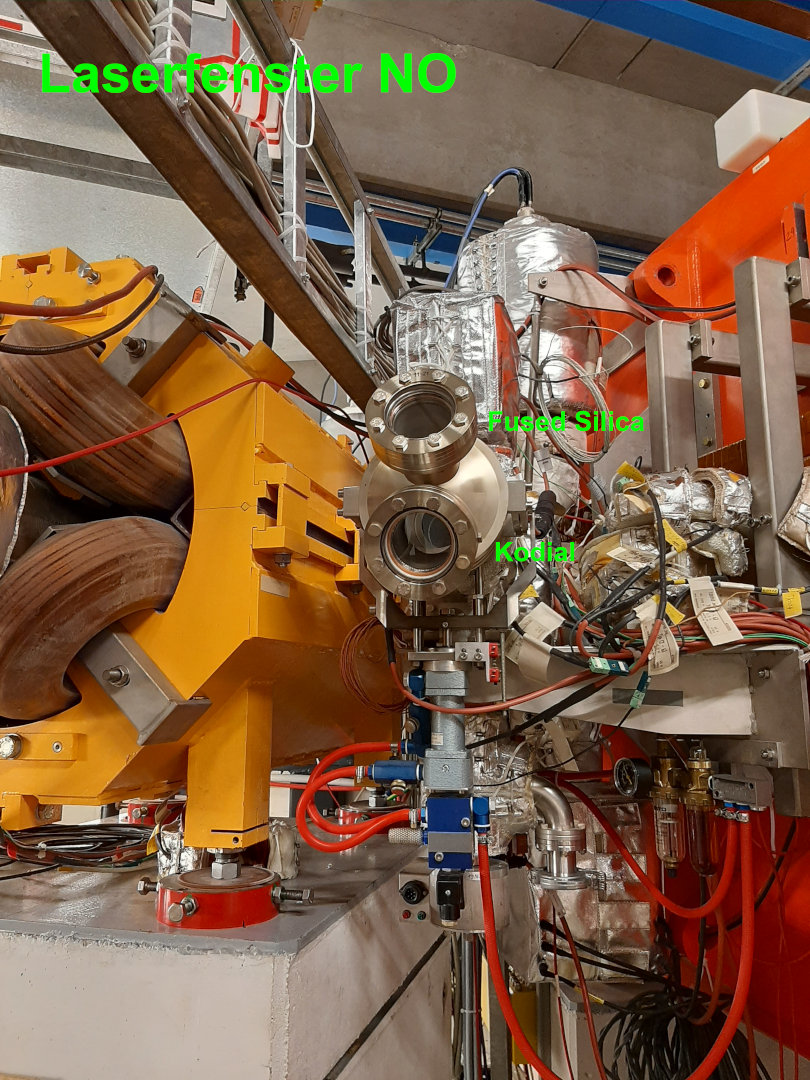
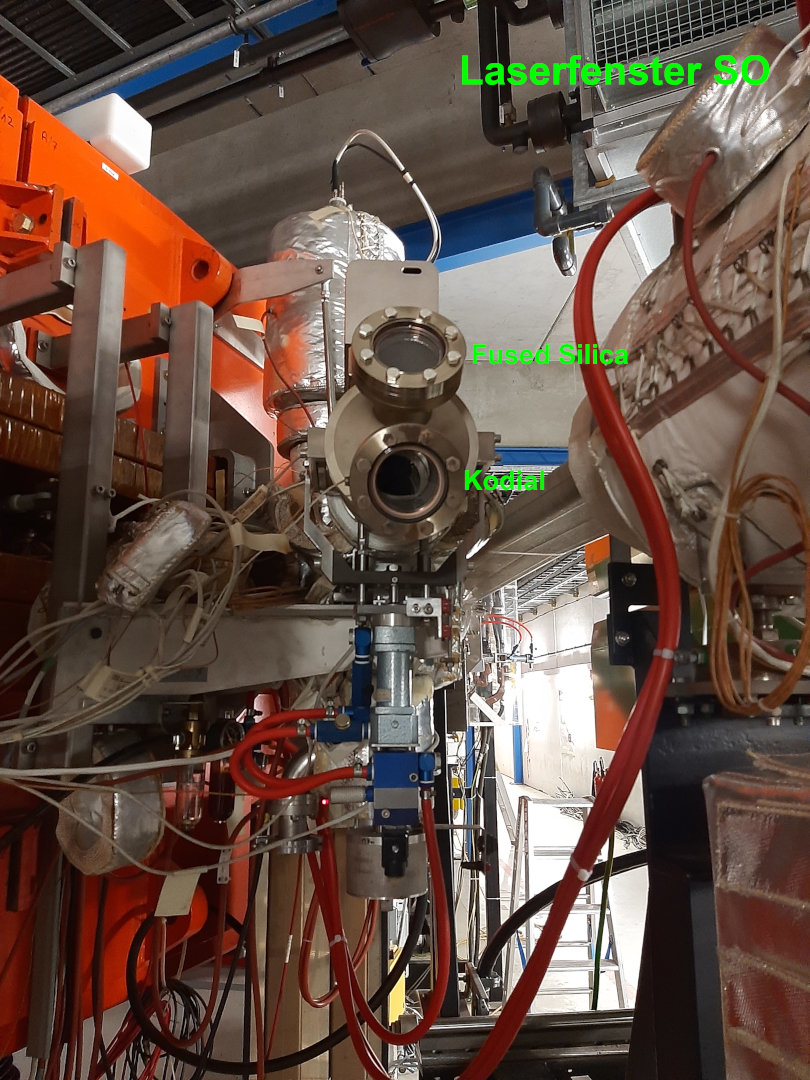
New laser viewports have been installed at the E-Cooler side of the ESR.
 |