| ID |
Date |
Author |
Category |
Subject |
|
21
|
Sat May 10 00:52:21 2025 |
Finn, Simon, Konstantin, Rodolfo | DAQ | Bunching - ammendment late shift |
Some 209Bi80+ beam was provided for tests measurement over the weekend. Currently the beam is bunched at the second harmonic, corresponding to a bunching frequency of 3.87421MHz and a revolution frequency of 1.937105MHz. The setting of the rate dividers were 2 and 99. Two is important since we are working with the second harmonic, and 99 provides approximately 20kHz, which is expected by the DAQ. The measurement of the frequency was performed in the Manipulation subchain SC8.
Rodolfo. In SetParameters.C was written another value (namely: 1.9370959 MHz). I changed this value to 1.937105 MHz. |
|
22
|
Sat May 10 03:32:18 2025 |
Finn, Simon | General | Beam not bunched (?) |
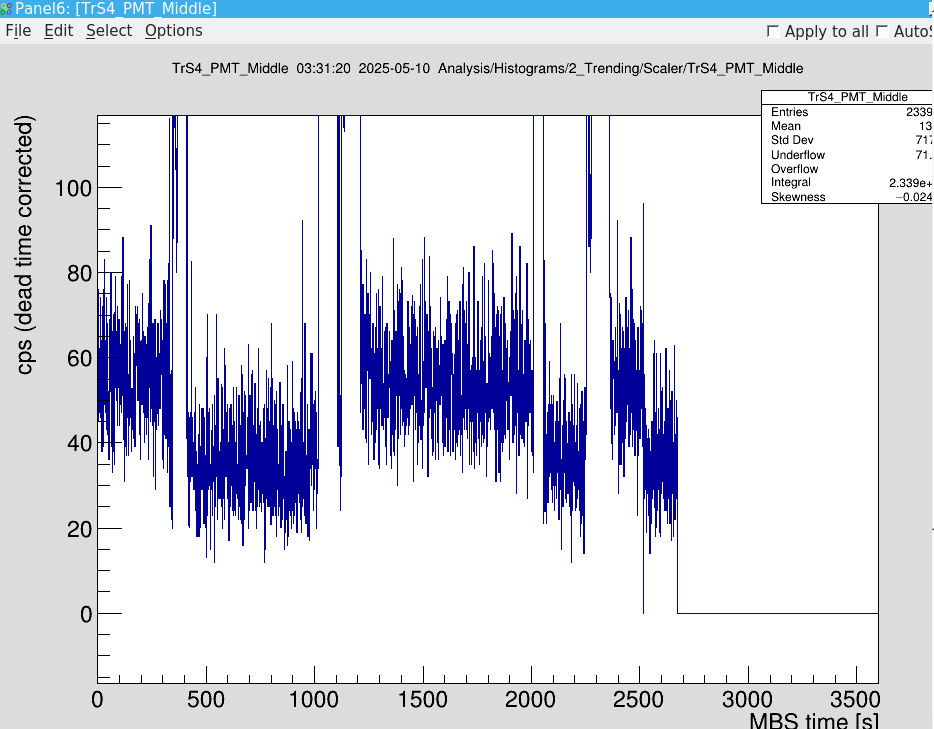
We think the beam in the ESR is not bunched. There is a clear difference in PMT signal if ions are in the ESR compared to no ions (see screenshot of scaler PMT mid, high level with ions, low level without) but we see no structure of an ion bunch (see screenshot of accumulated bins).
We also increased the accumulation to 10 injections, still no bunch visible.
We double checked the frequency value of the HF cavity mentioned in the last ELOG entrance. |
| Attachment 1: Bildschirmfoto_2025-05-10_03-31-28.png
|
|
| Attachment 2: Bildschirmfoto_2025-05-10_03-31-28.png
|

|
|
23
|
Sat May 10 03:46:57 2025 |
Finn, Simon | Detectors | PMT north |
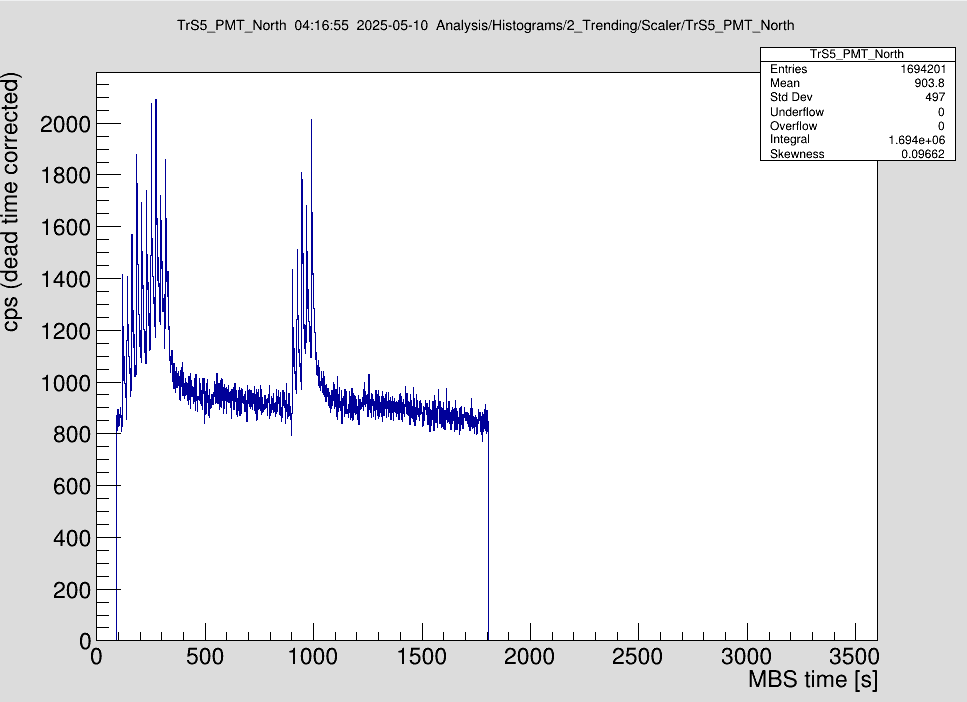
In contrast to PMT Mid, the difference between ions and no ions in the ESR (see screenshot scaler) is not visible. Signal gets higher with injection and shows some kind of exponential decay afterwards.
Beam was dumped at 500 and 1200s. Even after the dump, the signal steadily drops.
We tried to adjust the threshold such that a difference between ions in the ring and not becomes visible, but even with a minimal threshold no effect was visible. |
| Attachment 1: Bildschirmfoto_2025-05-10_04-17-00.png
|
|
|
24
|
Sat May 10 03:54:46 2025 |
Finn, Simon, Carsten | General | Night shift sum up - ammendment day shift |
As the beam in the ESR is most probably not bunched, there was not much we could do. During the night shift we:
- adjusted the threshold of the PMTs mid and north with beam in the ring
- found that the delay generator for PMT mid is broken, so the timing is off and needs to be remeasured
- tried to see the beam with PMT north, but with no success. Maybe with bunched beam this will be possible.

We turned off the PMTs, stopped mbs and the ESR pattern, notified HKR and left at 5am.


===> 10.05.12:30 (Carsten)
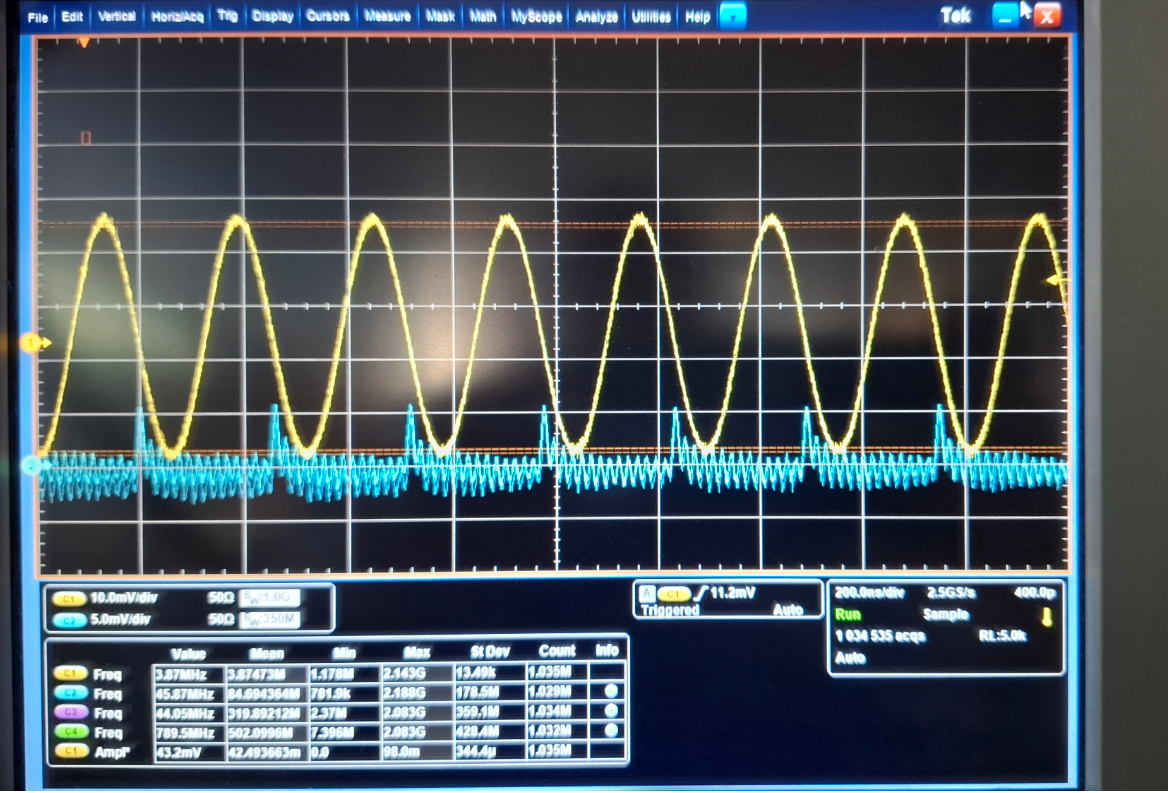
I checked the bunching in the HKR - the beam is bunche - see attached Foto from scope in HKR.
The blue line shows (the "zig-zag") that the ion beam is very well bunched, and that bunching frequency and cooling energy are "well matched". |
| Attachment 1: Bunching_Screenshot_2025-05-10_125634.png
|
|
|
25
|
Sat May 10 12:58:54 2025 |
Carsten | Detectors | Scrapers do not work reliably / Scraper positions for further tests |
I tried scraping with pressurized-air devices in order to verify the beam poistion. All 4 devices that we use do not work reliable (at least when driven "manually" via Device Control).
1) Sometimes they do not reach the set position
2) Sometimes they overshoot the set position but "oscillate" back to finally reach the set value. EVEN with small step like 5mm the drive moves then 15m in and 10 mm back (or even further?)
3) It seems (but difficult to verify to due 2) that position calibration is quite off.

In particular the latter behaviour makes it very difficult to locate the ion beam.  It seems to be possible to set up the particle detector for the primary beam but will make it very difficult if not impossible to set up 208Bi with the secondary beam.

The following value for "scraping" are thus to be taken with a grain of caution.
GE02DD2_G (Part Det behind cooler): beam is destroyd at -25 (at -30 ?)
GE02DS3HG (Scaper in south arc): beam is destrod at -4
GE01DD1AG (Capture North arc): beam is destroyed at about -30
GE01DD2IG (Ion North arc): even at "endlage innen" ion beam cannot be touched.

For further tests I try the following automated settings:

IN in in SC7, BP3
GE02DD2_G, GE02DS3HG, GE01DD1AG : -45
GE01DD2IG : 20

OUT in in SC10
GE02DD2_G, GE02DS3HG, GE01DD1AG : -120
GE01DD2IG : 120
(not fully out) |
|
27
|
Sat May 10 17:05:24 2025 |
Konstantin | Detectors | XUV detector and copper mirror control |
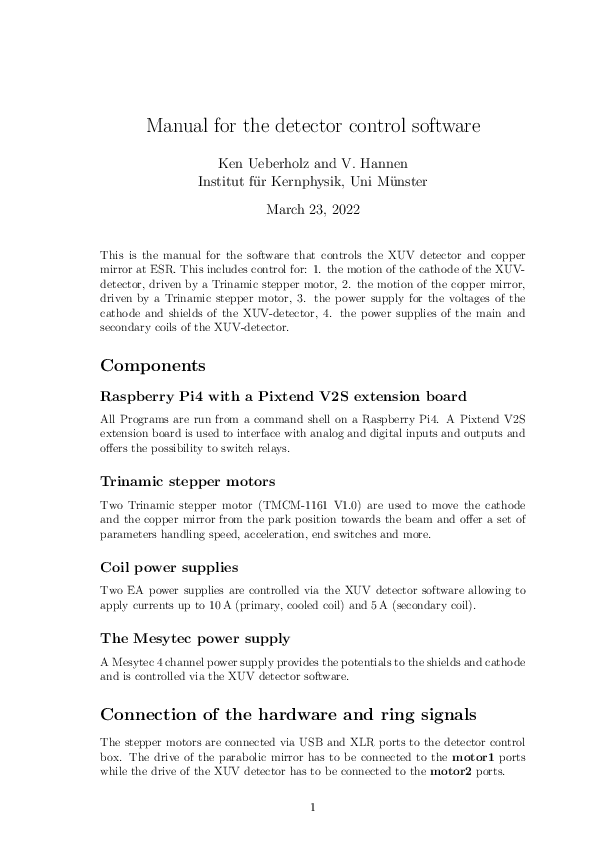
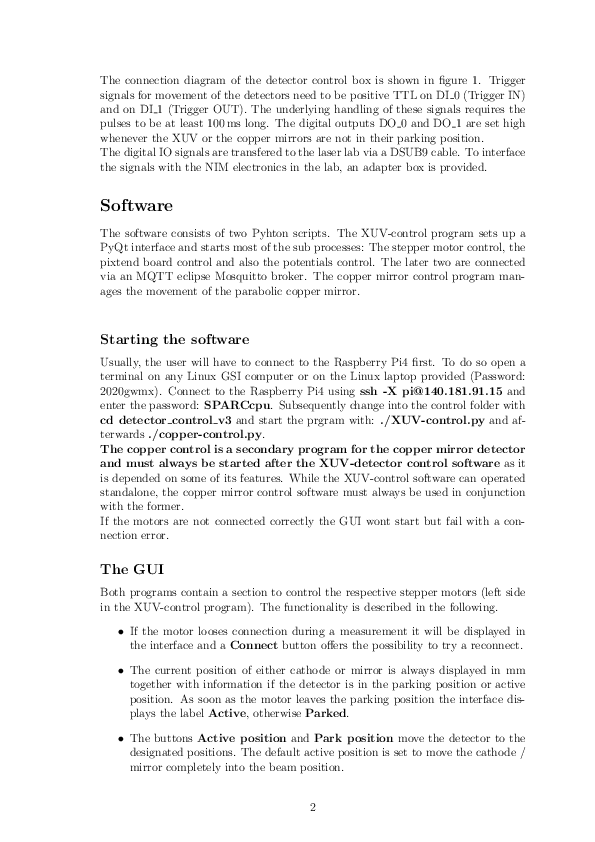
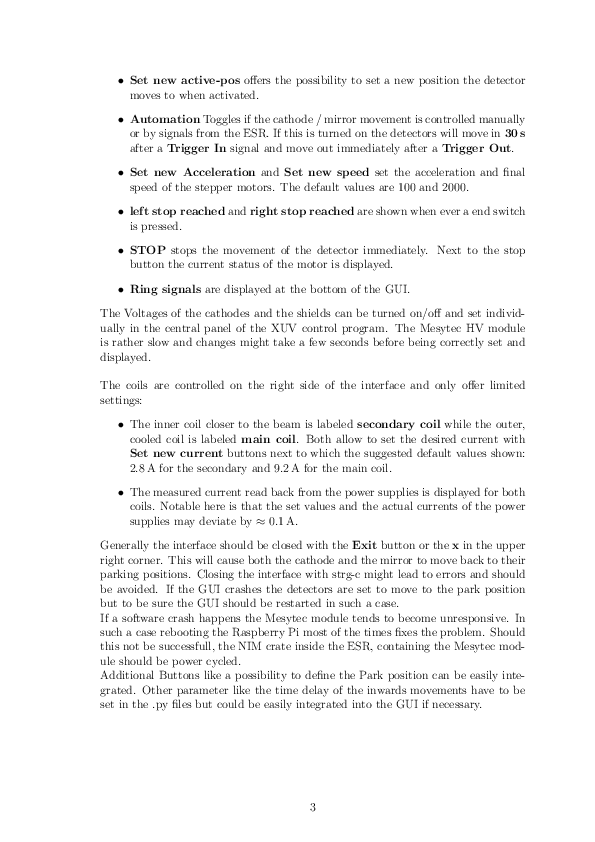
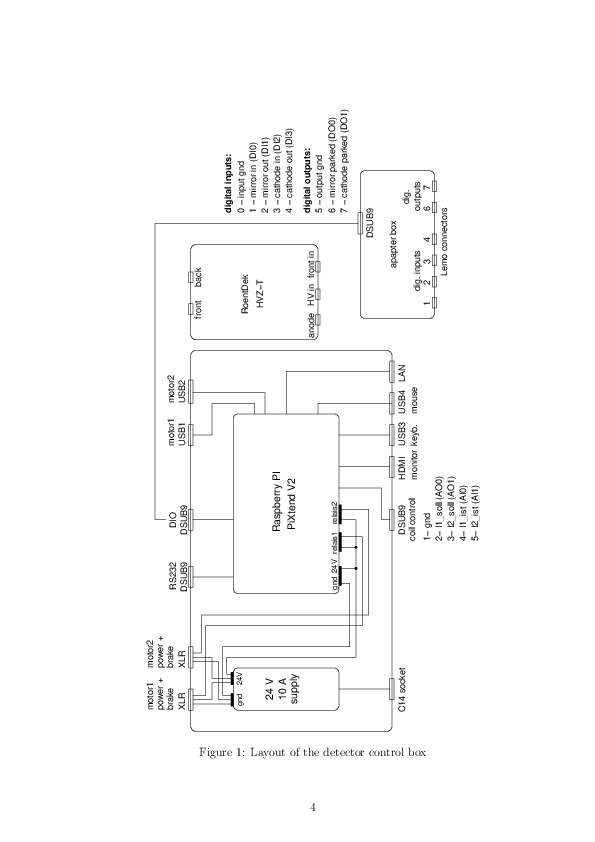
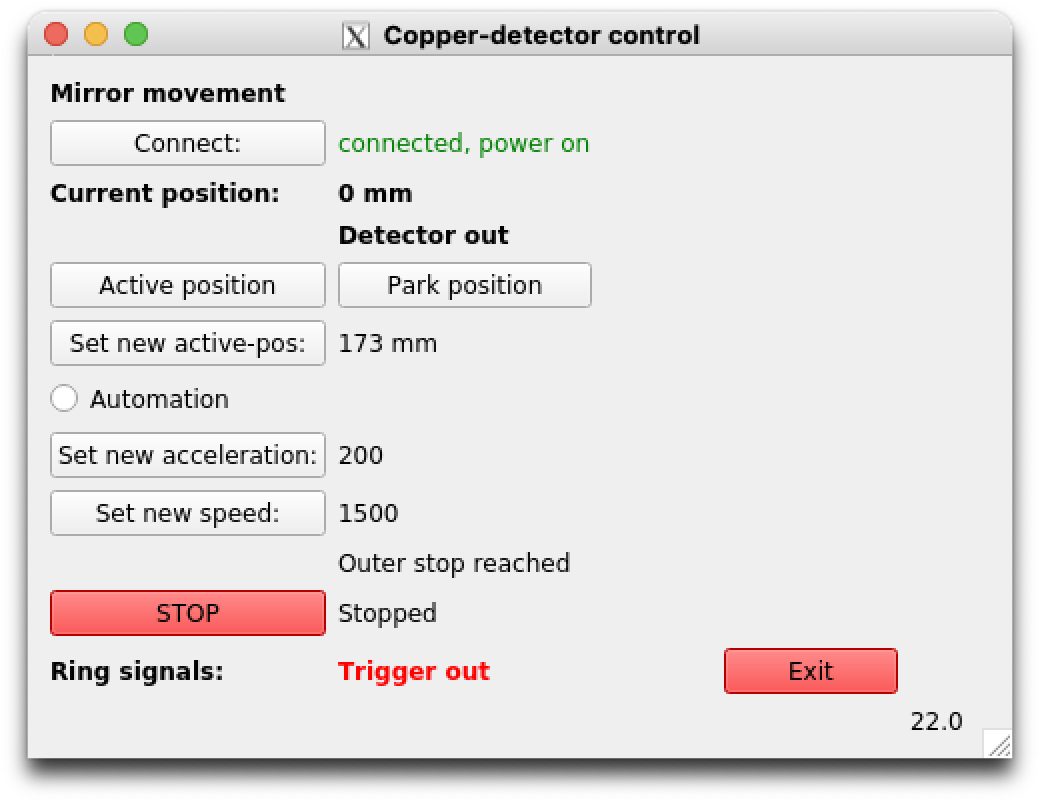
| I attach the manual of the XUV and copper mirror control software, which is hosted at the Raspberry Pi (140.181.91.15) below the optical detection region at ESR. The Motor position of the stepper motor is at 0mm, which corresponds to the outer park position. |
| Attachment 1: Manual.pdf
|
|
| Attachment 2: CopperMirrorControl.png
|
|
|
28
|
Sat May 10 17:47:50 2025 |
Carsten, Wilfried | Accelerator | Drifttube Cooling works |
The cooling ith a tentative DRALS pattern works well.
Cooling voltage in SC8 is now 905 V higher:
ESR manipulations -> Cooler maniuplations -> GECEBG1E is changed from +150V to +1055V. Please note the sign conventions. This means that the electrons are now 905V faster.
This is compensated by a DRALS pattern of -900 V (COOL) / 3300V (MEAS0/MEAS1). The -900V at the drifttubes decelerates the electrons.

The voltage is verified via the bunching pattern in the scope. The bunching signals look best in a flattop of about +1050V to 1060V. 1050V is the design value (1050V -900V = 150V). |
|
29
|
Sat May 10 20:14:47 2025 |
Rodolfo, Wilfried, Carsten | General | Lights in ESR |
The light (Beleuchtung) inside the Cave have been ON since probably yesterday evening (9. May) when Uli was inside the cave for fixing some issues.
We have now turned off the light.
Another possible reason for the non-observation of bunches might be that we probably have a large number of unbunched ions in the ring that are produced in the Be-target/stripper.
|
|
30
|
Sat May 10 20:53:17 2025 |
Rodolfo, Konstantin | Accelerator | Reading of E-Cooler Voltage |
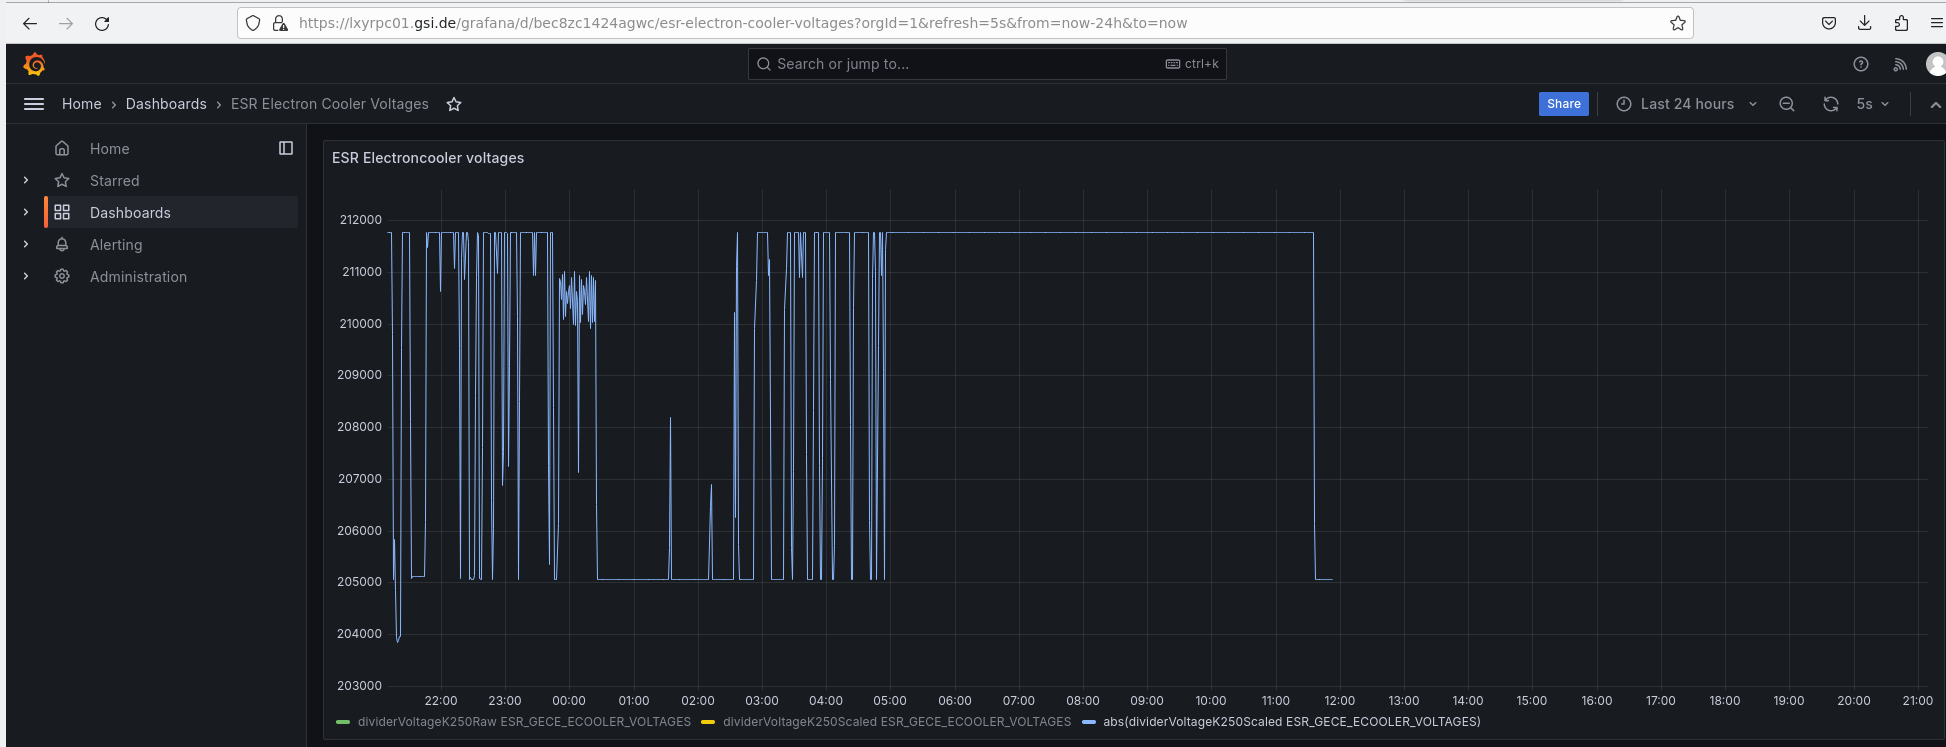
We do not have the reading of the electron cooler voltage. According to Grafana the reading of the voltage stopped at 11:53:00, when the voltage was 205070 V.
Konstantin tried to solve the issue remotely. He cannot access the Computer (a Raspi) remotely. Ping works, but it looks like SSH is not working. |
| Attachment 1: Grafana_ECoolerVoltage_Bildschirmfoto_2025-05-10_21-09-46.png
|
|
|
31
|
Sat May 10 22:47:29 2025 |
Konstantin | DAQ | HV Divider |
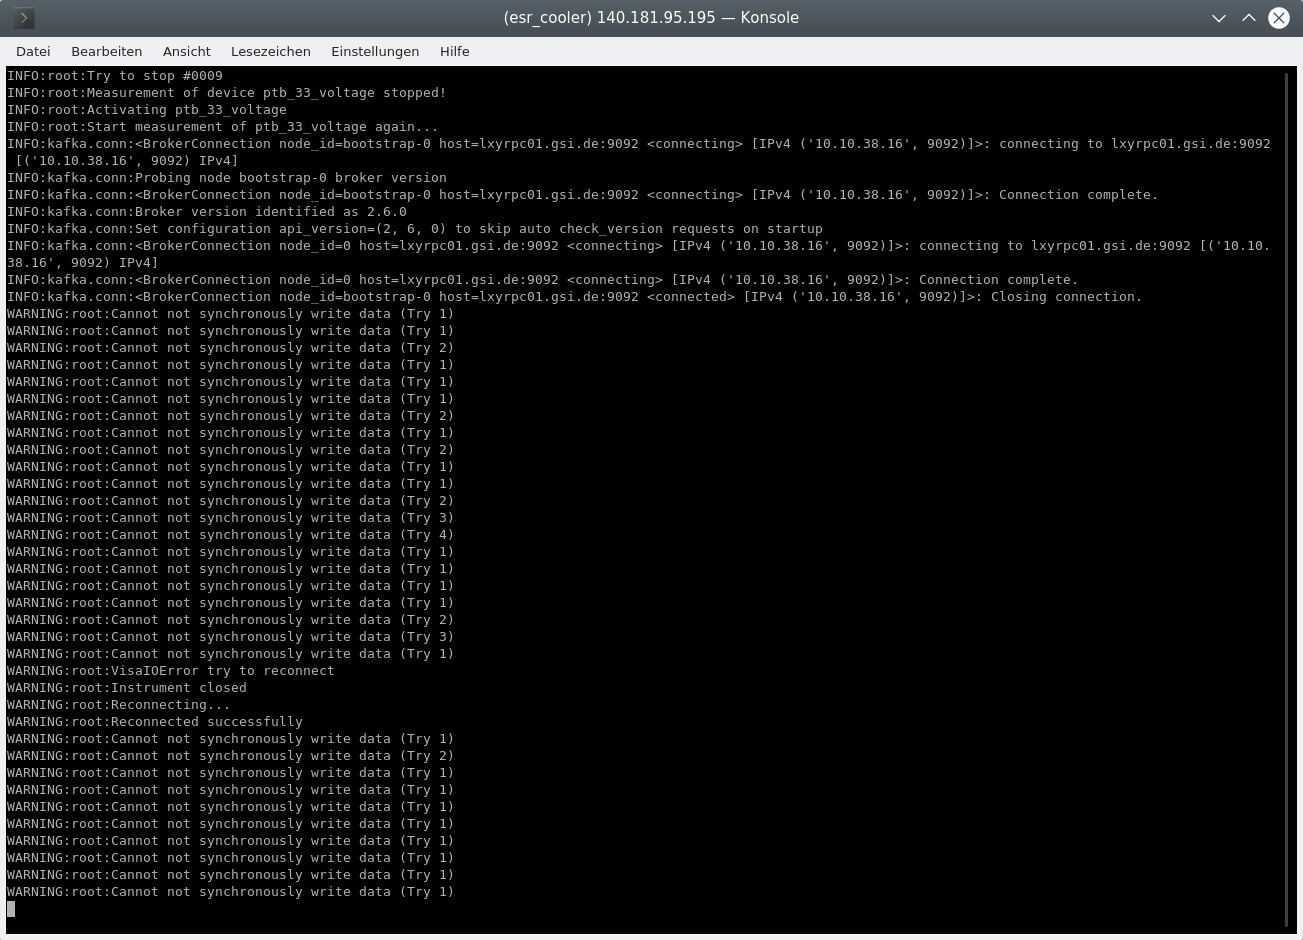
The readout of the hv dividers is running again. In order to restart the acquisition if it has crashed, connect to the raspberry pi and restart the analysis. Therefore, use the following procedure (Optional steps are indicated with (*)):
- ssh esr_cooler@140.181.95.195
- screen -r cooler_signals (Note: If this command ends with an error message, use "-R" instead of "-r". In this case the readout was not running and must be restarted (see below). Otherwise you should see something similar to the attachment. As long as warnings are printed everything works fine
 The program can be stopped by typing "stop" and pressing return.) The program can be stopped by typing "stop" and pressing return.)
- (*) cd Documents/electroncoolerelectricalsignals/
- (*) conda activate cooler_signals
- (*) python main.py -f <file name> -i <interval> (argument filename is the name of the log file and interval is the sending interval of the HV-divider)
|
| Attachment 1: HVReadout.png
|
|
|
32
|
Sat May 10 23:30:37 2025 |
Rodolfo | Accelerator | Ion Pumps at the target section |
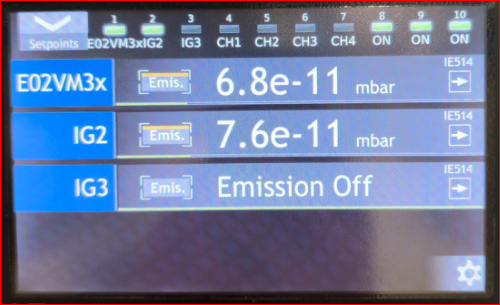
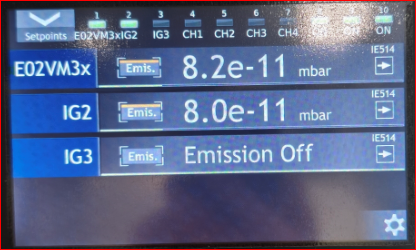
| The ion pumps (E02VP16i and E02VP17i) which nearby the optical detection region produce high count rate into the photomultipiers. Therefore they were turned off on May 5th by our colleague from UHV (Herr Mia). He checked the vacuum before (EIN) and after (AUS) turning off the pumps. |
| Attachment 1: Vakuum_IOP_EIN_2025-05-05.png
|
|
| Attachment 2: Vakuum_IOP_AUS_2025-05-05.png
|
|
|
33
|
Sun May 11 03:10:41 2025 |
Konstantin, Simon | Detectors | Bunched beam on PMT |
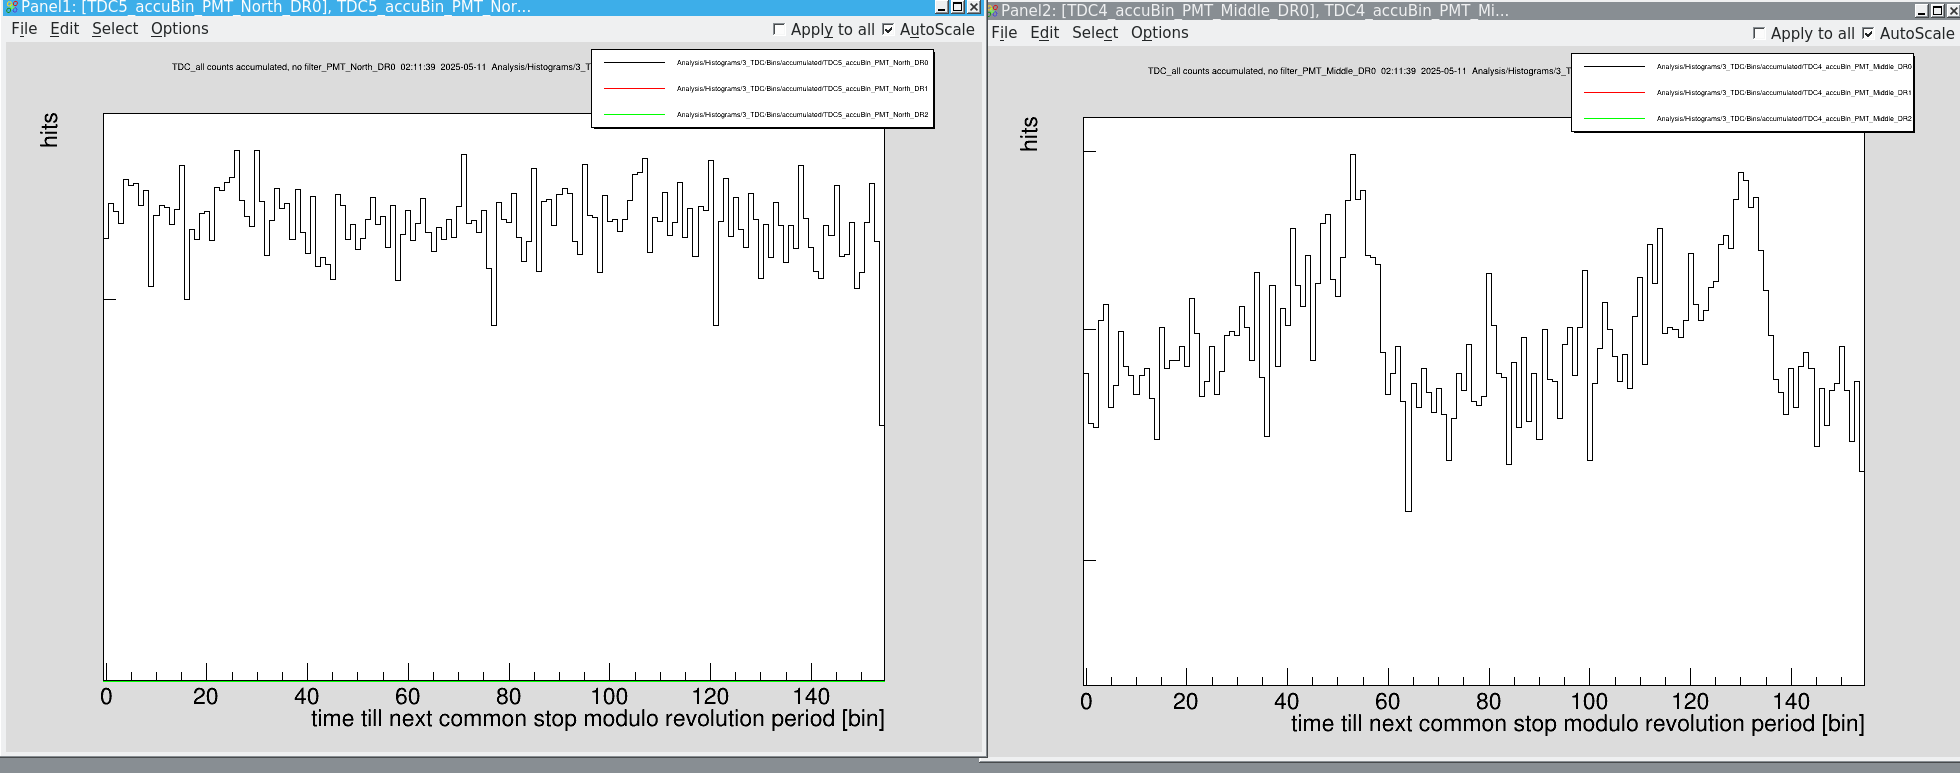
We checked again the time-resolved signal on the PMTs and after several minutes of accumulation we saw a the bunch shapes on PMT mid (att. 1 right) and also a tiny indication on PMT north (att. 1 left).
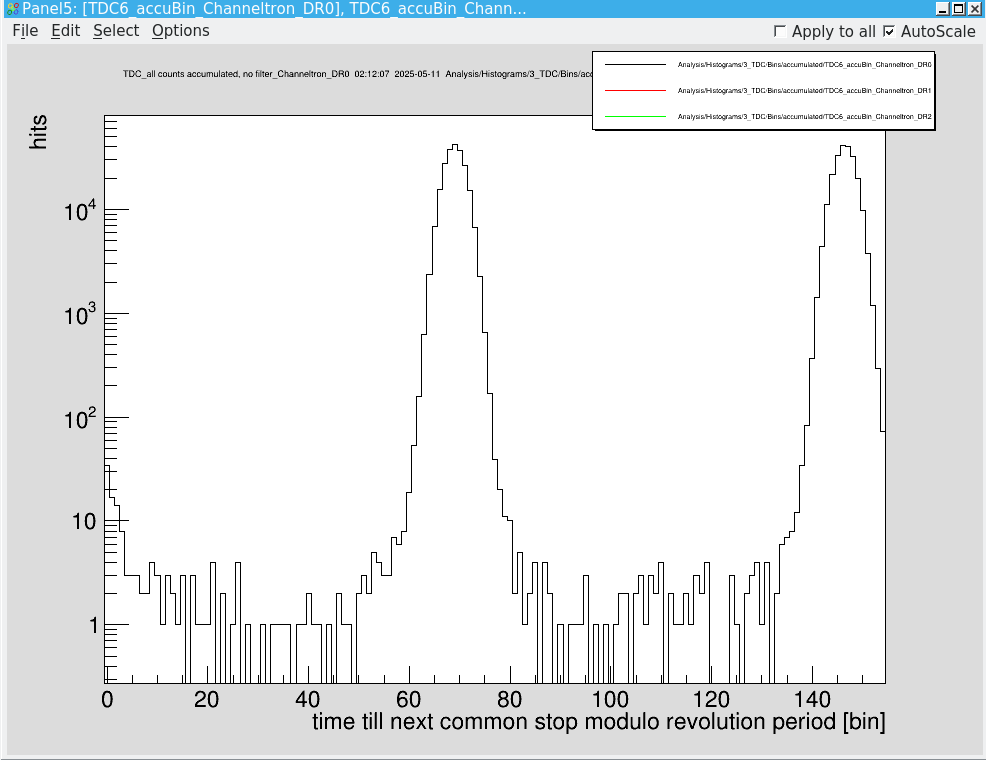
On the particle detector, the bunches are clearly visible (att. 2).
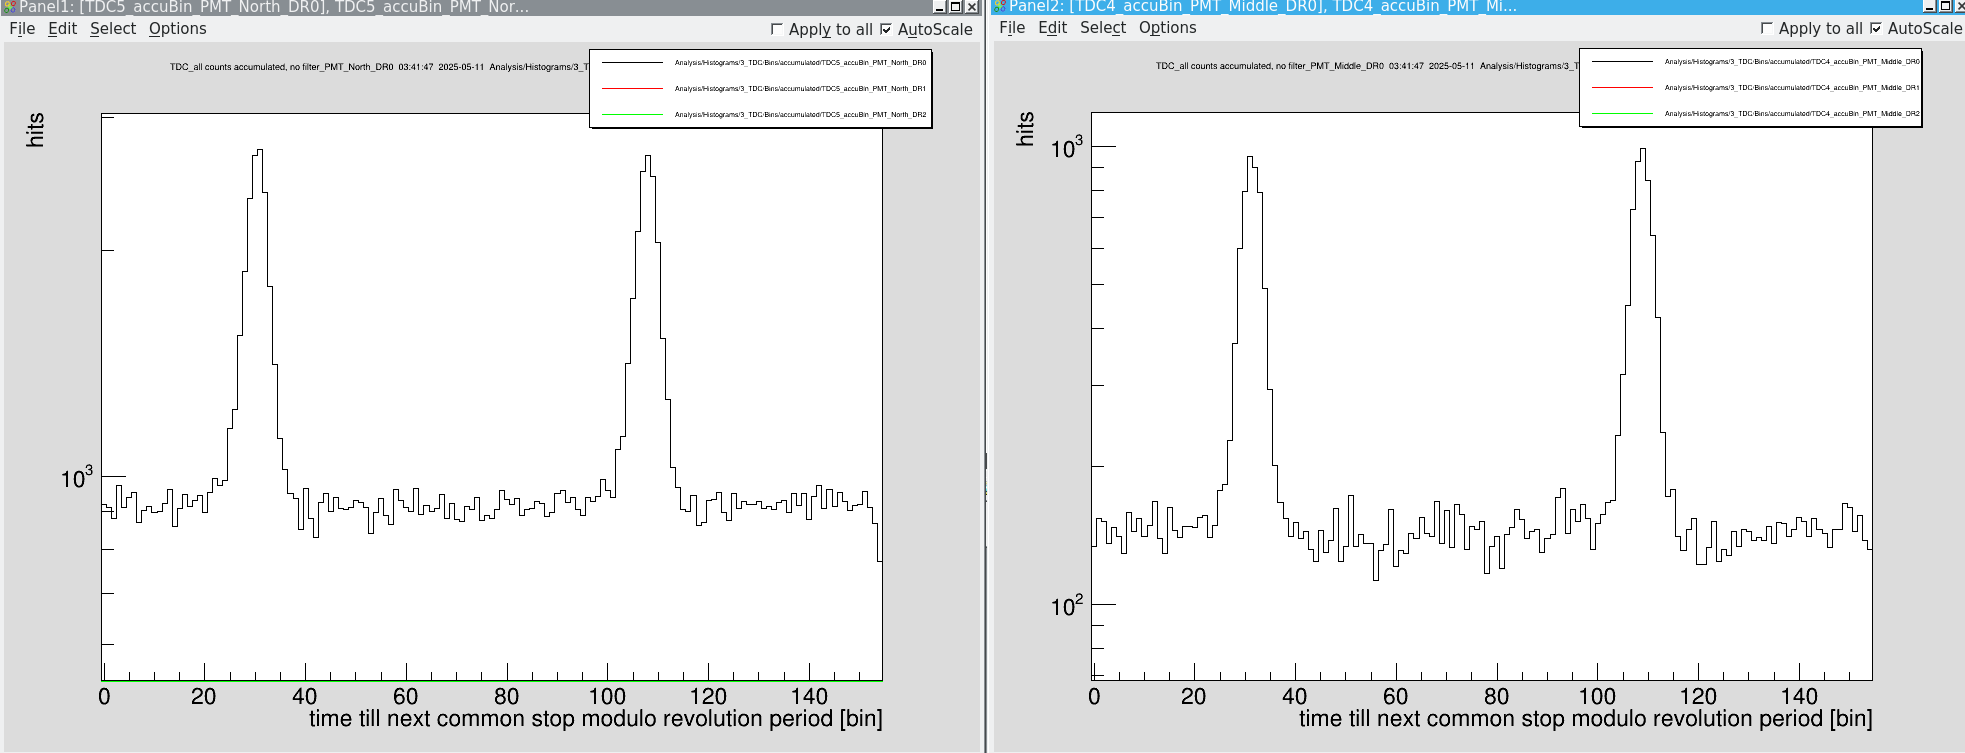
To improve the signal we turned on the nitrogen supply of the PMTs in order to reduce the photon absorption by air. This was indeed a game changer in order to identify bunches (att. 3) |
| Attachment 1: Bildschirmfoto_2025-05-11_02-11-44.png
|
|
| Attachment 2: Bildschirmfoto_2025-05-11_02-12-11.png
|
|
| Attachment 3: Bildschirmfoto_2025-05-11_03-41-52.png
|
|
|
34
|
Sun May 11 03:23:18 2025 |
Simon, Konstantin | Calibration | Delaytime measurement |
We performed another set of delay time measurements to substitude the broken channel of PMT middle. We did this in two step:
1.) Measurement of the total delay between the origin of a signal (AFG 10kHz, -50mV amplitude) and the detection directly before the DAQ after traveling through the long calibration cable (~50m) and the individual channel line. During this step we corrected the delay time if necessary by means of an OG 8000. This was only mandatory for PMT middle. We considered the traveling time of 46ns for all PMT detectors. We didn't measure the delay of PD North and Particle Detector south, since all other channels were fine and the delay after the OG 8000 were reasonable.
2.) Measurement of the delay within the OG 8000 octal gate generator.
|
| Total delay / ns | OG 8000 delay / ns | |
Photodiode North | - | 69.6 | |
Photodiode South | 1266.6 | 73.6 | |
PMT Middle | 1220.6 | 156.6 | |
PMT North | 1220.6 | 167.4 | |
PMT Copper | 1220.6 | 166.0 | |
Particle South | - | 337.6
|
|
|
35
|
Sun May 11 05:16:22 2025 |
Konstantin, Simon | Accelerator | Breeding of Lithium |
We measured the breeding efficiency of Li-like ions in the ESR and the rates are way below the expected 25%.
|
breeding time (min) | # after injection | # after breeding | efficiency
| |
1 | 1,48E+07 | 4E+05 | 0,0270
| |
2 | 1,33E+07 | 5E+05 | 0,0376
| |
3 | 1,37E+07 | 6E+05 | 0,0438
| |
4 | 1,38E+07 | 6E+05 | 0,0435
| |
6 | 1,40E+07 | 7E+05 | 0,0500
| |
8 | 1,46E+07 | 8E+05 | 0,0548
| |
10 | 2,31E+07 | 12E+05 | 0,0519
| |
15 | 1,44E+07 | 8E+05 | 0,0556
|
All measurements were taken with 1 single injection.
Edited by Carsten 2025-05-11:
A word of caution: Due an offset of the current transformer that changes easily with time I would question any reading below 1e6 ions. Even at 1e6 the error could vary from easily by 20 (?) percent.
Secnd comment: The efficiency cannot be deduced that way because before decelartion and scraping we have still a lot of contaminents in the ring. For a correct assesment we would need to have He-like only beam.
Third, the saturation after almost after 3 mins 4% close to max 5.5% looks very suspicious to me. One should definately have closer look here.
In the morning shift we remeasured the breeding efficiency. We stacked 8 times to have a higher ion current in the ESR. Then we waited 40 min
|
breeding time (min) | # after injection | # after breeding | efficiency
| |
40 | 6.2E+07 | 2.4E+06 | 0,039
|
|
|
36
|
Sun May 11 05:25:07 2025 |
Simon, Konstantin | General | Detector drives |
Currently, the particle detectors show a weird behavior. Sometimes they drive too far. IMPORTANT: As long as it is unclear what is the reason for this, only ask for a new injection with the BSS Control once it is checked that the devices GE02DD2, GE02DS3HG, GE01DD2IG, and GE01DS3HG are at their outer end positions.
To avoid an unwanted injection it is the best to stop the pattern directly after you have started it in order to request a new injection. |
|
37
|
Sun May 11 15:42:18 2025 |
Carsten | General | Particle detector / dielectronic recombination measurements |
The DR setup was put into operation yesterday and first spectra recorded (see below).
Particle detector behind cooler ("SA_SZ") presently has voltage of 1350. The threshold at the CAEN CFD was set to 100 and changed to 150 today. There is a huge gap between noise and signal, however, today it seemed in DR that we had a burst of higher pulses.
Position is -45
Drifttube cooling first was tested with 200 mA.
The Cathode voltage of the cooler is therefore 905V higher than the actual cooling energy. The value measured with the precision HV probe is 205970 V
This is compensated by a -900V at the drifttube to decelerate the electrons.
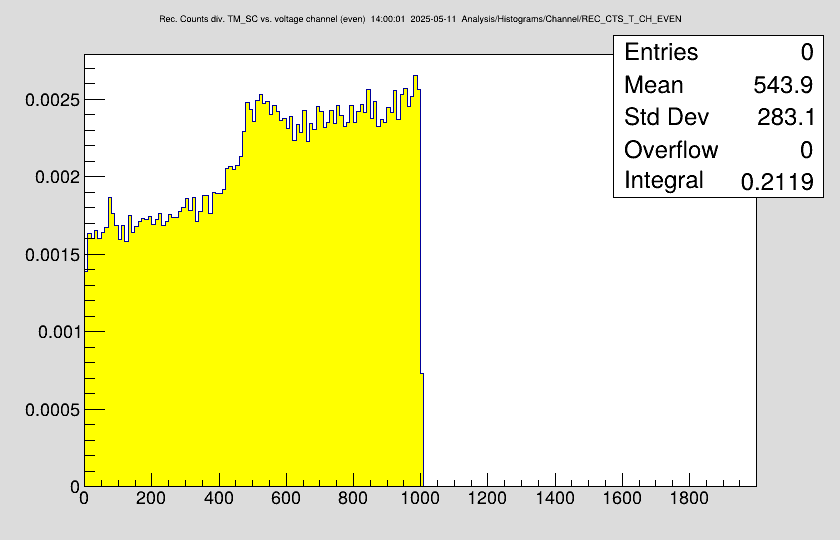
A ramp is created: 208Bi01.dat that scans the CM energy range from 21 eV to 11 eV where the Bi79+ (1s2 2p_1/2 n=20) DR resonance is located. 1001 steps DEcm = 0.01 eV. Scanning direction high to low.
Times 40 ms measurement, 40 ms cooling ,
SubTrigs:
1 : 5000
2: 8200
3: 8400
4: 8600
Schottky files are recorded on NTCAP:
NTCAP 2025-05-10_19-09-35 (10 injections first 2 injections missing in NTCAP)
Bunched 200mA, run6.lmd, run7.lmd, run9.lmd (run8.lmd is empty).
First DR Peaks visible
Bunched 500 mA (new range) 24 to 4 eV stepwidth 0.02 eV high to low
NTCAP 2025-05-11_13-19-38, run10.lmd
run12.lmd (figure of DR peak attached, please note low channels are high energies)
not Bunched 500 mA, run11.lmd
run12.lmd (figure of DR peak attached, please note low channels are high energies)
run13.lmd is empty
19:10 changed the Go4 code
The measurements with bunched beam should be repeated. |
| Attachment 1: DR_500mA_bunched.png
|
|
| Attachment 2: DR_500mA_DC_long_ramp.png
|
|
|
38
|
Sun May 11 17:30:24 2025 |
Carsten, Rodolfo, Jonas | General | Accidentally Skipped Breeding Step in File 0012.LMD |
At ~17:26:30 the beam process was accidentally set to not wait on breeding, affecting the data in file 0012.LMD |
|
39
|
Sun May 11 20:08:37 2025 |
Carsten | Runs | DR runs with DC beam |
We have 4 valid DR files for DR with unbunched beam. Iel = 500mA
run_0011.lmd
run_0012.lmd
run_0014.lmd
run_0015.lmd
corresponding ADC data for the DT voltages are available (ESR NUC).

NTCAP is stopped at ~22:30
(Plan: go back to bunched beam)

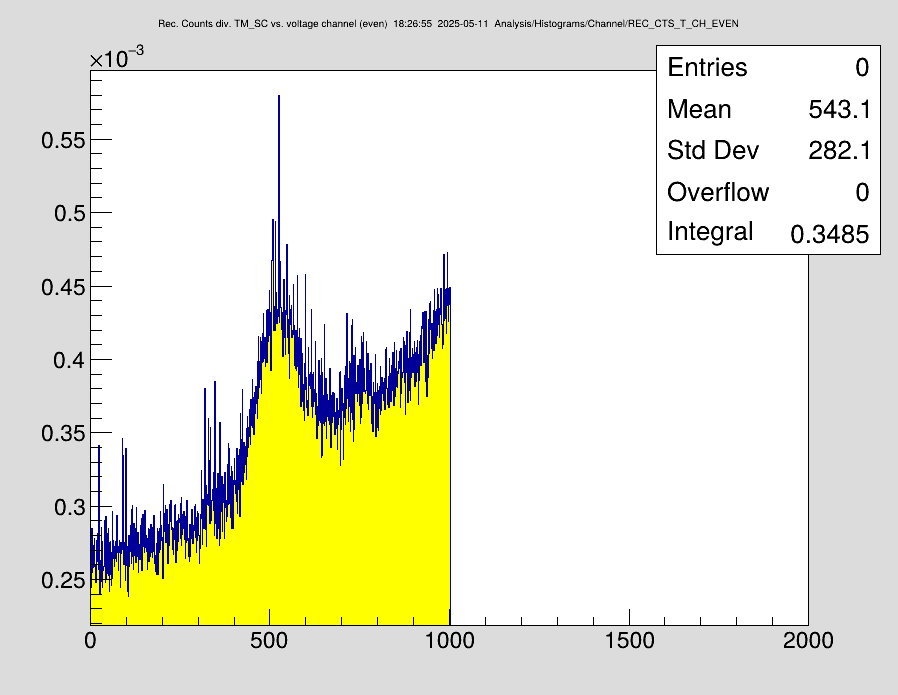
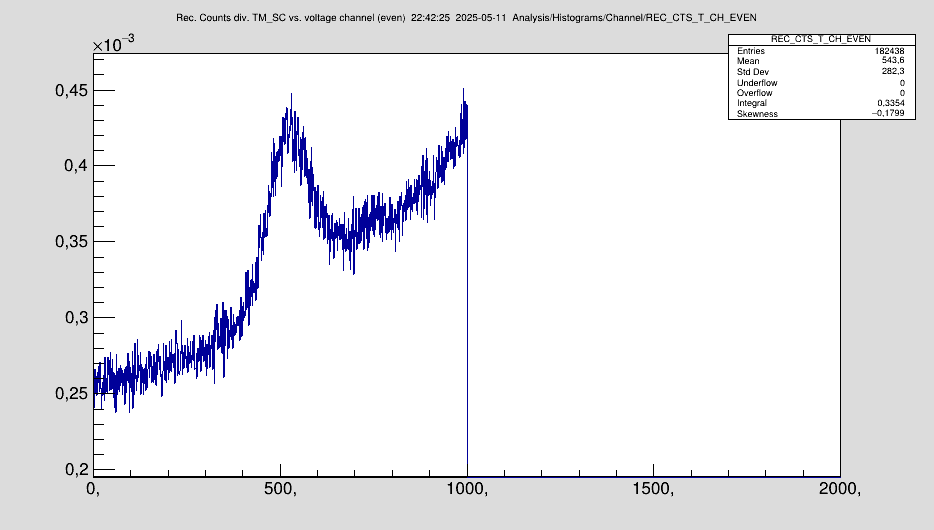
Below is a first offline analysis of the DR data of and of the intermediate cooling step (-900V) of unbunched beam.
The DR spectrum goes from Ecm = 24eV (channel 1) to 4 eV at channel (channel 1001)  with a stepwidth of 0.02 eV per channel (equidistant in the CM-frame). Thus 100 channels are 2 eV.
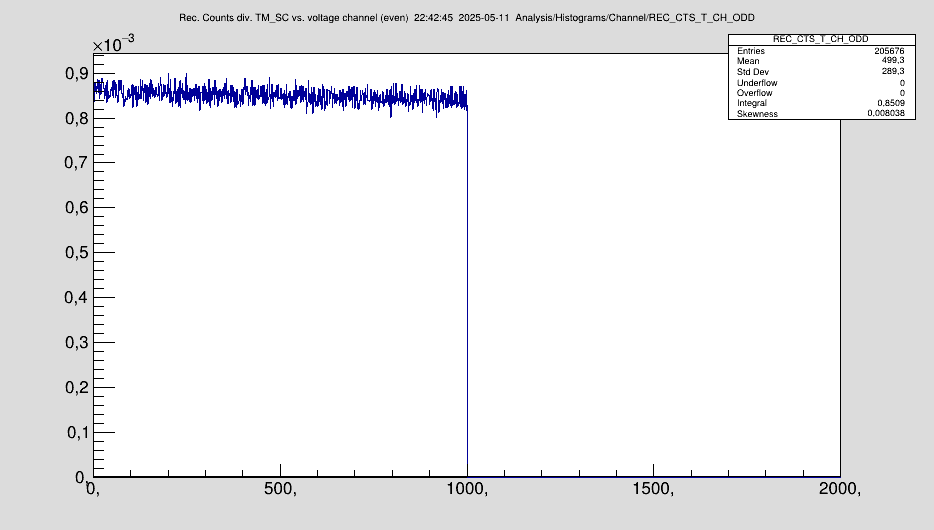
The other spectrum shows the intermediate cooling rate after each measurement step.
The maximum of he peak is at about channel 520, i.e 24 eV - 5.2*2eV = 13.6 eV (expected ~17.8 eV). The peak is very broad. FWHM about 100 channels (2 eV). For comparison, the old data from 1998 had FWHM ~0.6 eV but limited due to density of the resonances - not experimental resolution.

The rising slope is the real RR (radiative recombination at non-zero energies) slope. There is no background from residual gas (verified in the bunching spectrum).
The intermediate cooling rate is about 2.5 to 3 times the rates in the DR spectrum. Expected was AT LEAST a factor 10 but rather a factor of 100 (one hundred). This finding is inline with the long beam lifetimes and the moderate breading efficiency.

Comment: In the analysis, I carefully checked all relevant raw-data spectra, in particular the timing pattern and the measured voltages. The raw data look extremely good (from a technical point-of-view)and agree with the settings.
=> The new setup works very well. |
| Attachment 1: DR_500mA_Not_Bunched.png
|
|
| Attachment 2: RR_500mA_Not_buched.png
|
|
|
40
|
Sun May 11 23:16:14 2025 |
Carsten | Runs | Switched back to bunching beam |
At about 22:30 we switched back to the bunched beam.
The new NTCAP directory is IQ_2025-05-11_22-37-04, started NTCAP Schottky data.
Same ramp as before 24 eV to 4 eV. 1001 steps dE = 0.02 eV,
Measurement step 40 ms / cooling step 40 ms.
The ramp is repeated 15 times.
I_el = 500 mA.
Opened file run_0016.lmd
Jonas checked that the bunching works using the scope in the main control room.

The DR peak appears after very few scans. |
|
41
|
Mon May 12 07:19:16 2025 |
Finn, Simon, Konstantin | DAQ | DR Measurements |
During this night we recorded several DR measurements. Before the DR, we charged bread for about 10 minutes.

1. We took over at 0:00 with file no.16 (started 22:15)
2. Started new file (no.17) at 4:34
3. Recorded file no.18 starting at 6:30

We stopped the measurement at 7:28 and started the shut down procedure. |