| ID |
Date |
Author |
Category |
Subject |
|
230
|
Sat Jul 3 06:48:38 2021 |
The remote Canadian eager beavers (Guy & Iris) | Analysis | Closer potential isomer tracks |
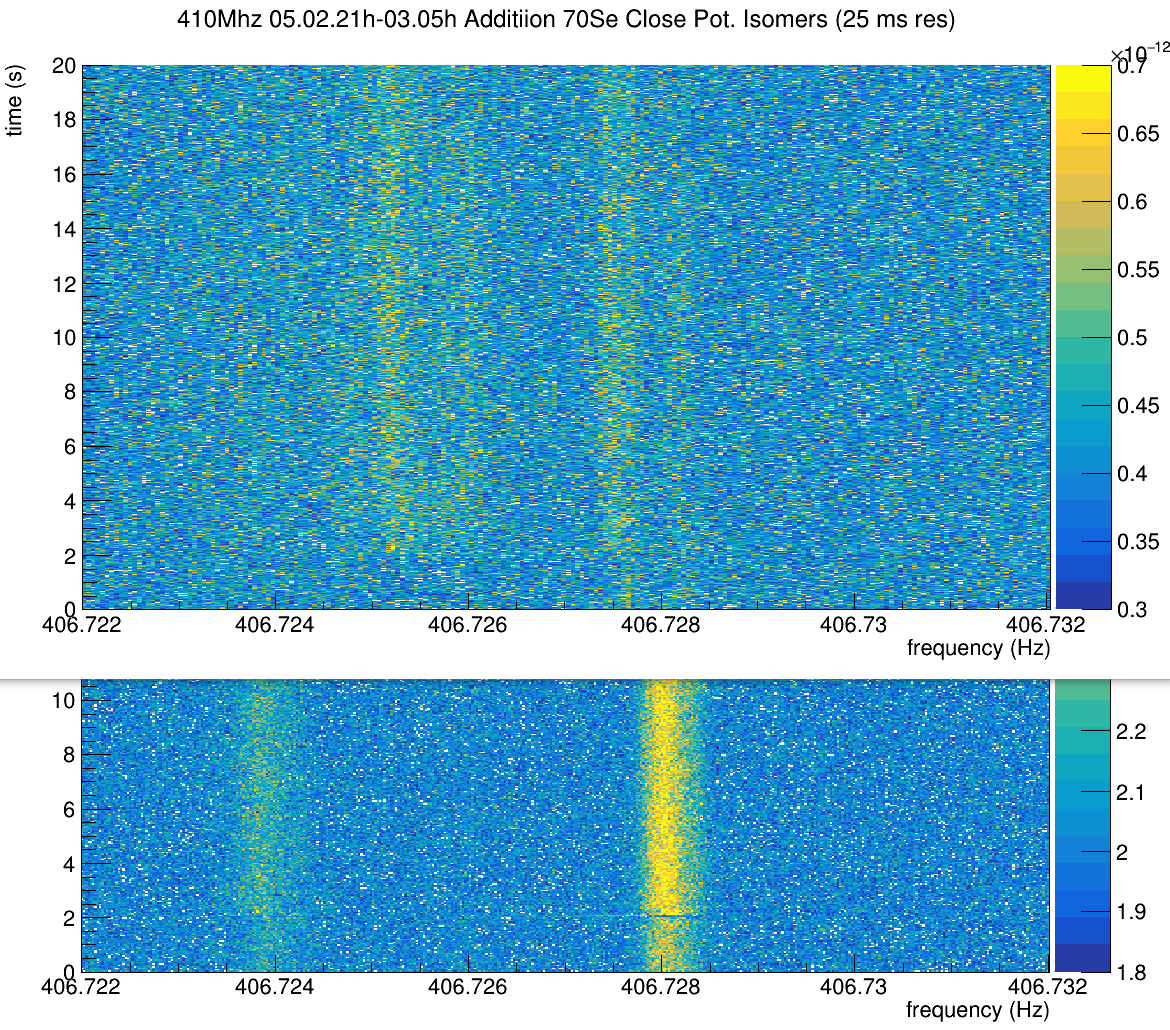
After looking through >800 shots from Jul 2nd 21h to Jul 3rd 05h, we couldn't find a single example of a "smoking gun" isomer decay. I.e. I'm talking about the examples Liliana posted earlier. We did find many examples (roughly 10%) where the ion track spontaneously
disappeared, but this shouldn't be the isomer as there was no frequency shift.

We did, as Iris mentioned, observe some line "in-between" the broad peak unique to the 410MHz, and listed them here (https://triumfoffice365-my.sharepoint.com/:x:/g/personal/dillmann_triumf_ca/EdKsMfSC3AlHopA36PdLBlsBE2MCSY0hh5qIsuau5HFBmg?rtime=Z2os4J492Ug).
I then proceeded to sum these files to see if they lined up. The result it attached, with the previous total sum from 21-00h Jul 2nd at the bottom for comparison. It seems the 70Se line has shifted, this is observed in the other shots too. However, despite the low
statistics, these other shots don't line up with the broad peak identified before, although they don't line up well with each other individually either.
In either case, we think these files might be worth offline analysis as they're the only possible hint of the 70Se isomer so far. |
| Attachment 1: 70Se_close_pot_isomers.png
|
|
|
233
|
Sat Jul 3 07:35:31 2021 |
The remote Canadian eager beaver (Iris) | Analysis | Closer potential isomer tracks |
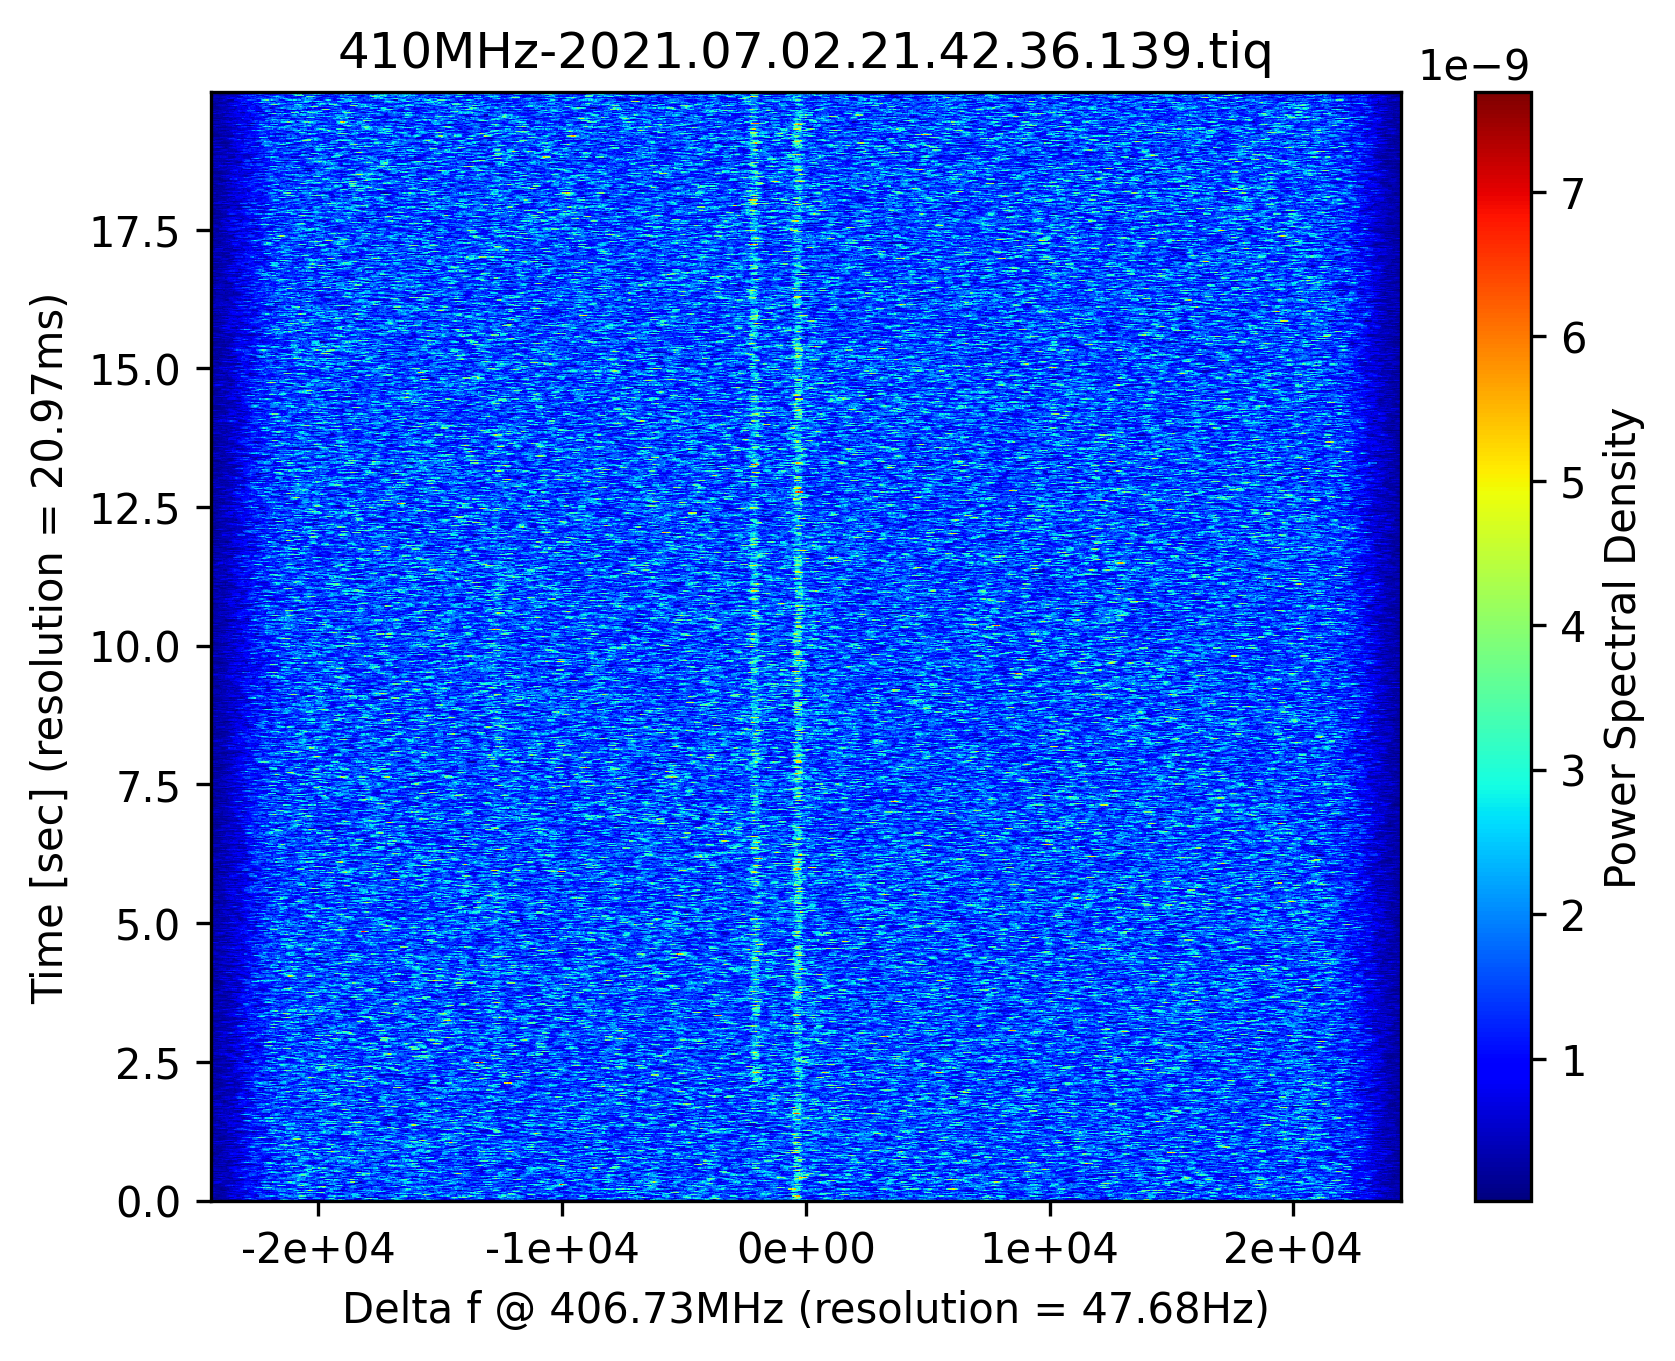
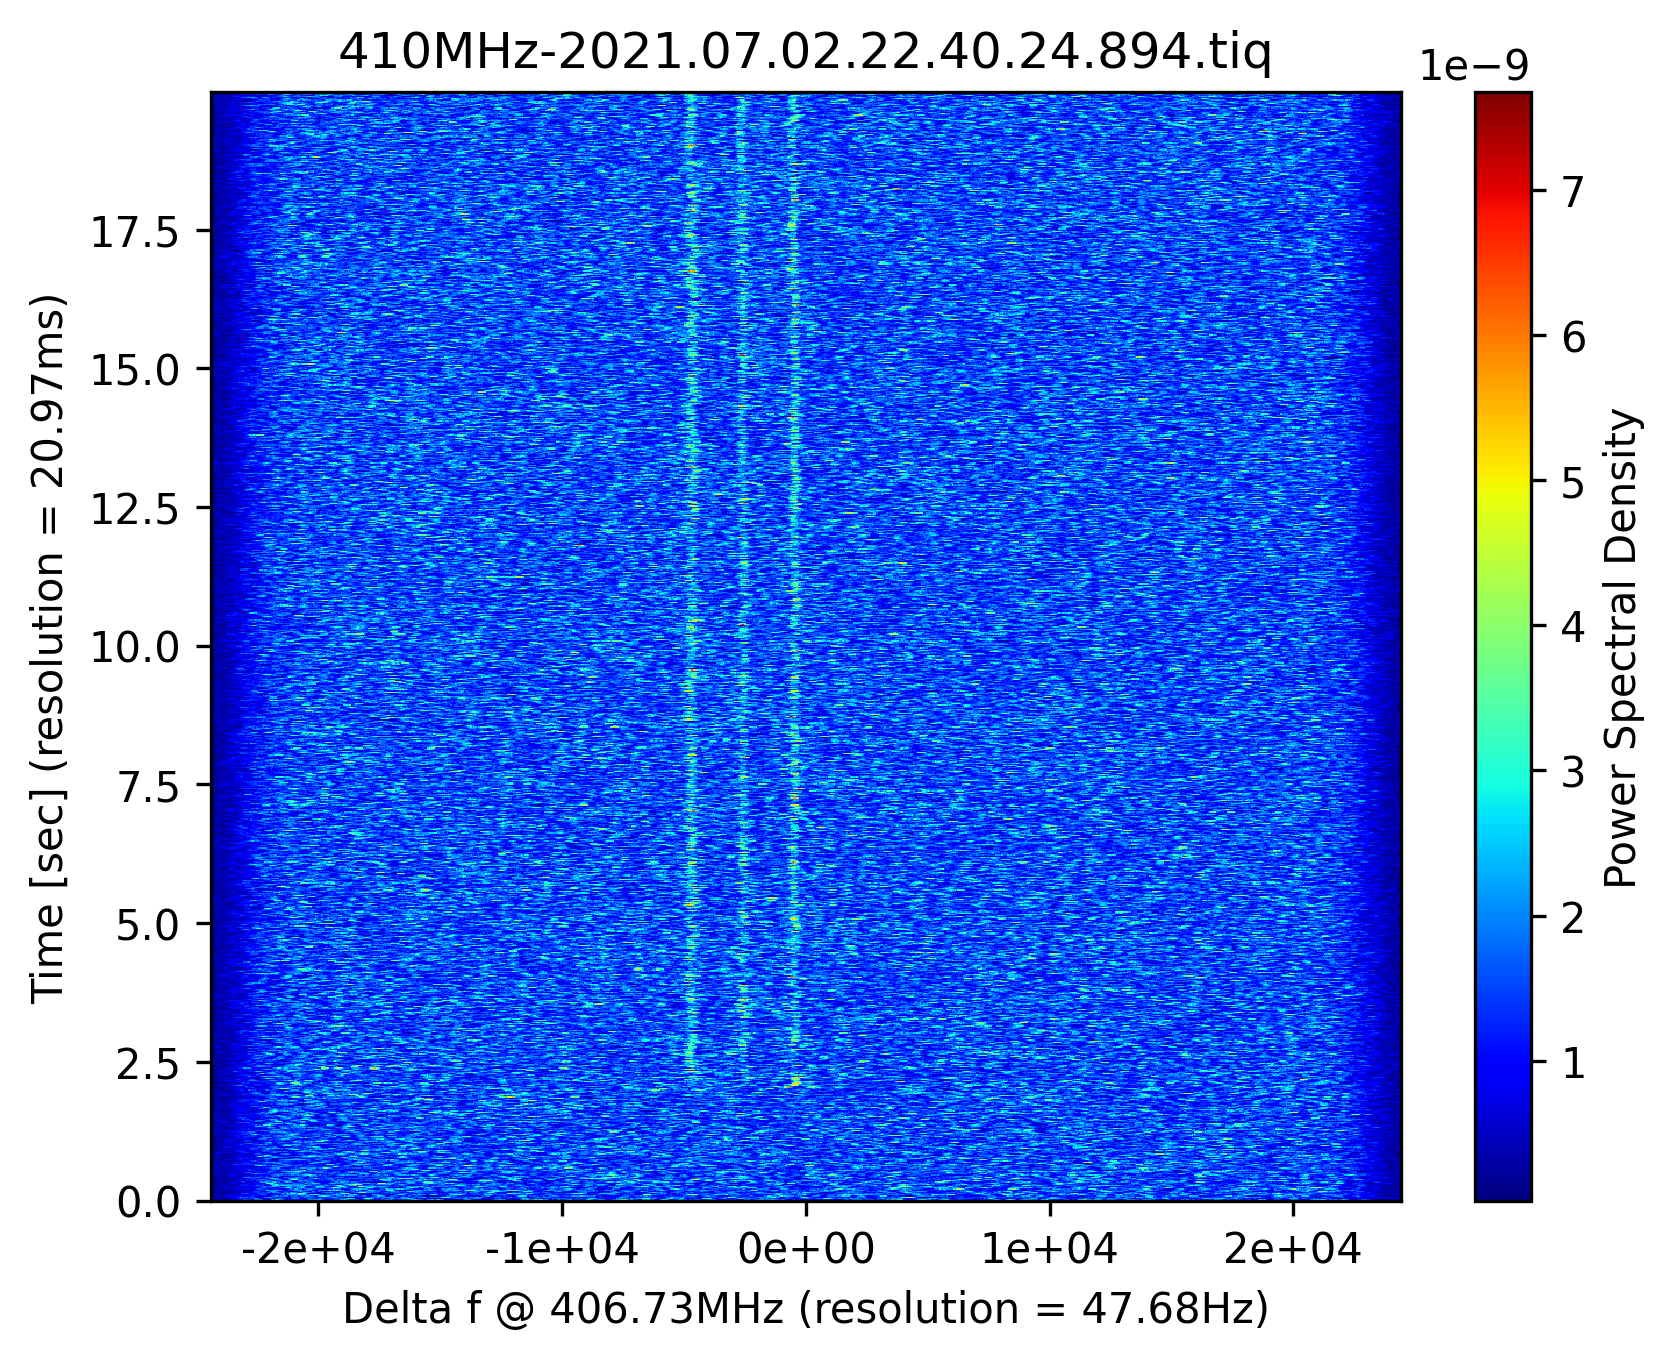
Here's a list of the spectra to look at for the potential isomer, taken btw 21:00 on July 2nd and 6:30 on July 3rd. Two examples attached.

Name	Comment
410MHz-2021.07.02.21.18.54.456.tiq
410MHz-2021.07.02.21.27.19.948.tiq	slightly different freq
410MHz-2021.07.02.21.33.07.438.tiq
410MHz-2021.07.02.21.42.36.139.tiq	slightly different freq
410MHz-2021.07.02.21.52.04.801.tiq
410MHz-2021.07.02.22.03.37.550.tiq	appears at ~3.5s
410MHz-2021.07.02.22.12.31.601.tiq	slightly different freq
410MHz-2021.07.02.22.30.24.641.tiq	slightly different freq
410MHz-2021.07.02.22.40.24.894.tiq	triplet
410MHz-2021.07.02.23.04.38.838.tiq
410MHz-2021.07.03.01.00.29.856.tiq	slightly different freq
410MHz-2021.07.03.01.29.59.709.tiq	slightly different freq
410MHz-2021.07.03.01.45.47.532.tiq
410MHz-2021.07.03.01.47.22.303.tiq	a bit more shifted to the left
410MHz-2021.07.03.01.54.44.606.tiq
410MHz-2021.07.03.02.14.45.610.tiq	a bit more shifted to the left
410MHz-2021.07.03.02.28.58.637.tiq	slightly different freq
410MHz-2021.07.03.02.55.49.838.tiq	a bit more shifted to the left
410MHz-2021.07.03.03.15.50.713.tiq	a bit more shifted to the left
410MHz-2021.07.03.03.55.52.357.tiq	slightly different freq
410MHz-2021.07.03.03.56.55.568.tiq	a bit more shifted to the left

410MHz-2021.07.03.01.11.33.702.tiq
410MHz-2021.07.03.01.20.31.004.tiq
410MHz-2021.07.03.00.07.18.136.tiq
410MHz-2021.07.03.00.42.04.236.tiq
410MHz-2021.07.03.00.45.45.337.tiq
410MHz-2021.07.03.04.22.44.303.tiq
410MHz-2021.07.03.04.26.25.486.tiq
410MHz-2021.07.03.04.45.54.495.tiq
410MHz-2021.07.03.04.49.35.705.tiq

410MHz-2021.07.03.05.25.24.517.tiq
410MHz-2021.07.03.05.58.03.370.tiq

410MHz-2021.07.03.06.19.07.475.tiq

----------------------------------------------

> After looking through >800 shots from Jul 2nd 21h to Jul 3rd 05h, we couldn't find a single example of a "smoking gun" isomer decay. I.e. I'm talking about the examples Liliana posted earlier. We did find many examples (roughly 10%) where the ion track spontaneously
> disappeared, but this shouldn't be the isomer as there was no frequency shift.
>
> We did, as Iris mentioned, observe some line "in-between" the broad peak unique to the 410MHz, and listed them here (https://triumfoffice365-my.sharepoint.com/:x:/g/personal/dillmann_triumf_ca/EdKsMfSC3AlHopA36PdLBlsBE2MCSY0hh5qIsuau5HFBmg?rtime=Z2os4J492Ug).
> I then proceeded to sum these files to see if they lined up. The result it attached, with the previous total sum from 21-00h Jul 2nd at the bottom for comparison. It seems the 70Se line has shifted, this is observed in the other shots too. However, despite the low
> statistics, these other shots don't line up with the broad peak identified before, although they don't line up well with each other individually either.
> In either case, we think these files might be worth offline analysis as they're the only possible hint of the 70Se isomer so far. |
| Attachment 1: 410MHz-2021.07.02.21.42.36.139.tiq.png
|
|
| Attachment 2: 410MHz-2021.07.02.22.40.24.894.tiq.png
|
|
|
127
|
Mon May 10 04:08:13 2021 |
Iris (Chris C., Jeff C.) | Analysis | Comparison between 72Ge: 10th 1-2am on 245 MHz |
> Following Xiangcheng Chen's analysis, I analysed 11 ms time slices separated by 25 ms to see the evolution of the potential isomer across the injection.
>
> Attachment 1: Data from May 7th 19h-20h. -t 11ms progression from -s=5 to -s=5.175
> Attachment 2: Data from May 8th 21h-22h. -t 11ms progression from -s=5 to -s=5.175
>
> The extra resolution gained on the 8th (and potentially other settings too) make the isomer visible where it wasn't present on the 7th.

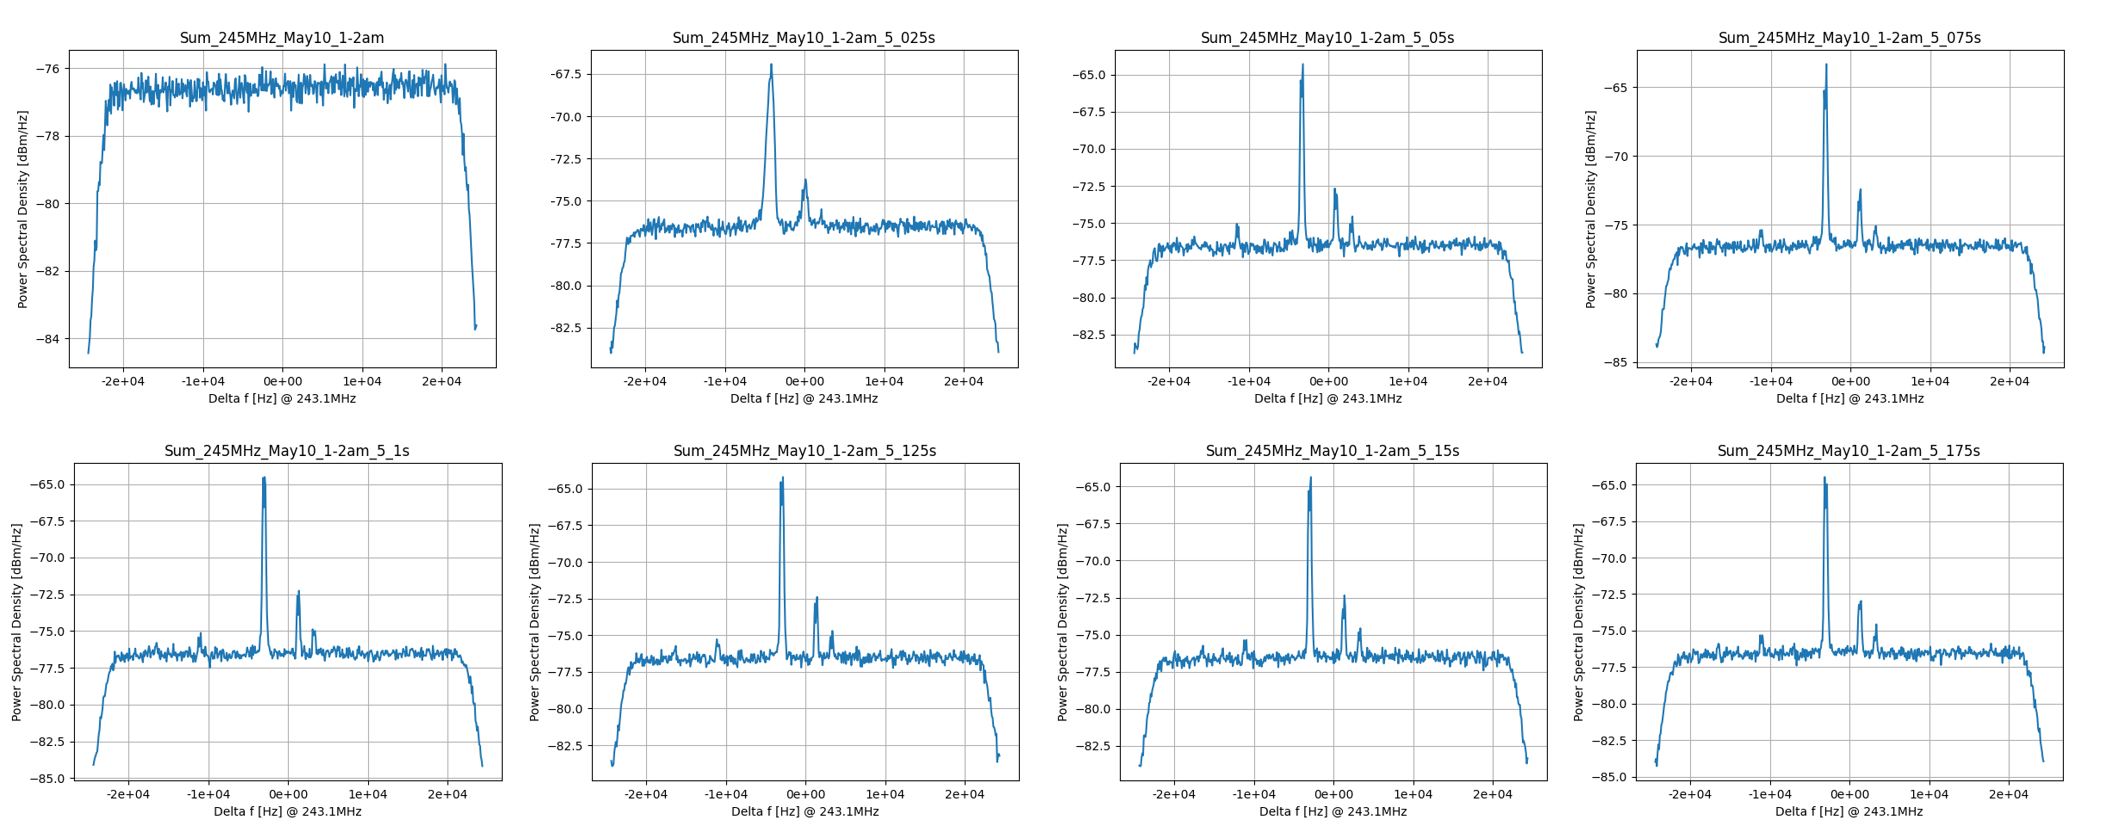
Hi, attached is the sum of all spectra from 1-2am on May 10th, on the 245 MHz detector. Takes me forever to download everything...
I used the same parameters as Guy and Xiancheng: LFRAMES = 512 (in analyzer); -t 0.011 (= 11 ms) -s 5 ... 5.175 s.

Resolution looks good... :-) |
| Attachment 1: Sum_245MHz_May10-1-2am_5_0-5_175s.png
|
|
|
128
|
Mon May 10 05:25:29 2021 |
Iris (Chris C., Jeff C.) | Analysis | Comparison between 72Ge: 10th 1-2am on 410 MHz |
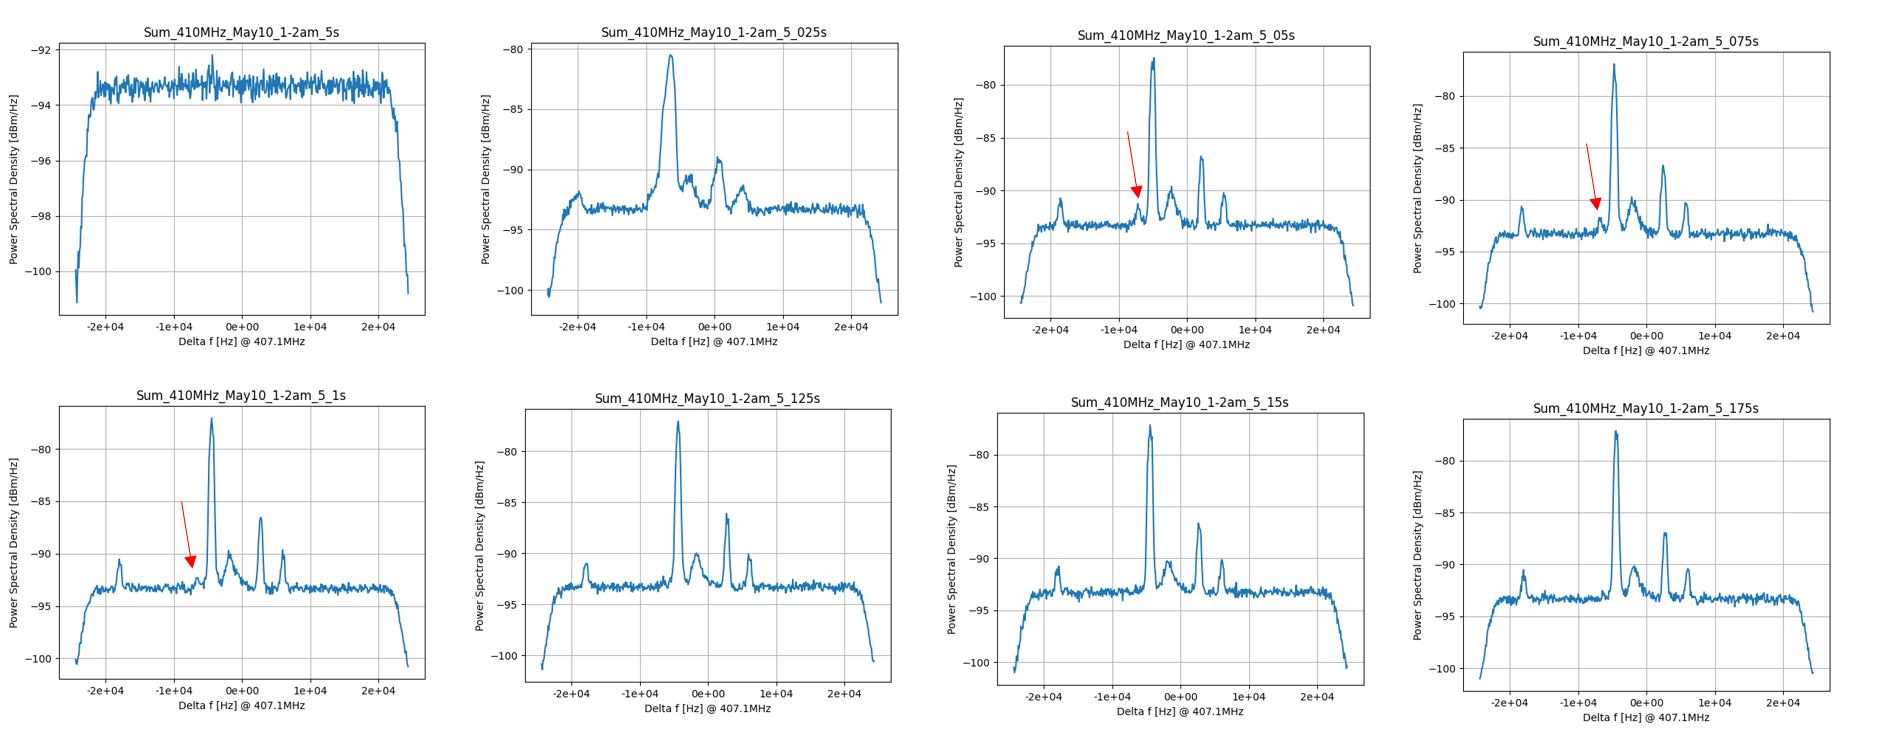
Same as before, but for 410 MHz detectors.
Peaks visible in the 3rd-5th slice.


> > Following Xiangcheng Chen's analysis, I analysed 11 ms time slices separated by 25 ms to see the evolution of the potential isomer across the injection.
> >
> > Attachment 1: Data from May 7th 19h-20h. -t 11ms progression from -s=5 to -s=5.175
> > Attachment 2: Data from May 8th 21h-22h. -t 11ms progression from -s=5 to -s=5.175
> >
> > The extra resolution gained on the 8th (and potentially other settings too) make the isomer visible where it wasn't present on the 7th.
>
> Hi, attached is the sum of all spectra from 1-2am on May 10th, on the 245 MHz detector. Takes me forever to download everything...
> I used the same parameters as Guy and Xiancheng: LFRAMES = 512 (in analyzer); -t 0.011 (= 11 ms) -s 5 ... 5.175 s.
>
> Resolution looks good... :-) |
| Attachment 1: Sum_410MHz_May10-1-2am_5_0-5_175s.png
|
|
| Attachment 2: Sum_410MHz_May10_1-2am_5_175s.root
|
| Attachment 3: Sum_410MHz_May10_1-2am_5_15s.root
|
| Attachment 4: Sum_410MHz_May10_1-2am_5_125s.root
|
| Attachment 5: Sum_410MHz_May10_1-2am_5_1s.root
|
| Attachment 6: Sum_410MHz_May10_1-2am_5_075s.root
|
| Attachment 7: Sum_410MHz_May10_1-2am_5_05s.root
|
| Attachment 8: Sum_410MHz_May10_1-2am_5_025s.root
|
|
130
|
Mon May 10 06:22:15 2021 |
Iris (Chris C., Jeff C.) | Analysis | Comparison between 72Ge: 10th 1-2am on 410 MHz |
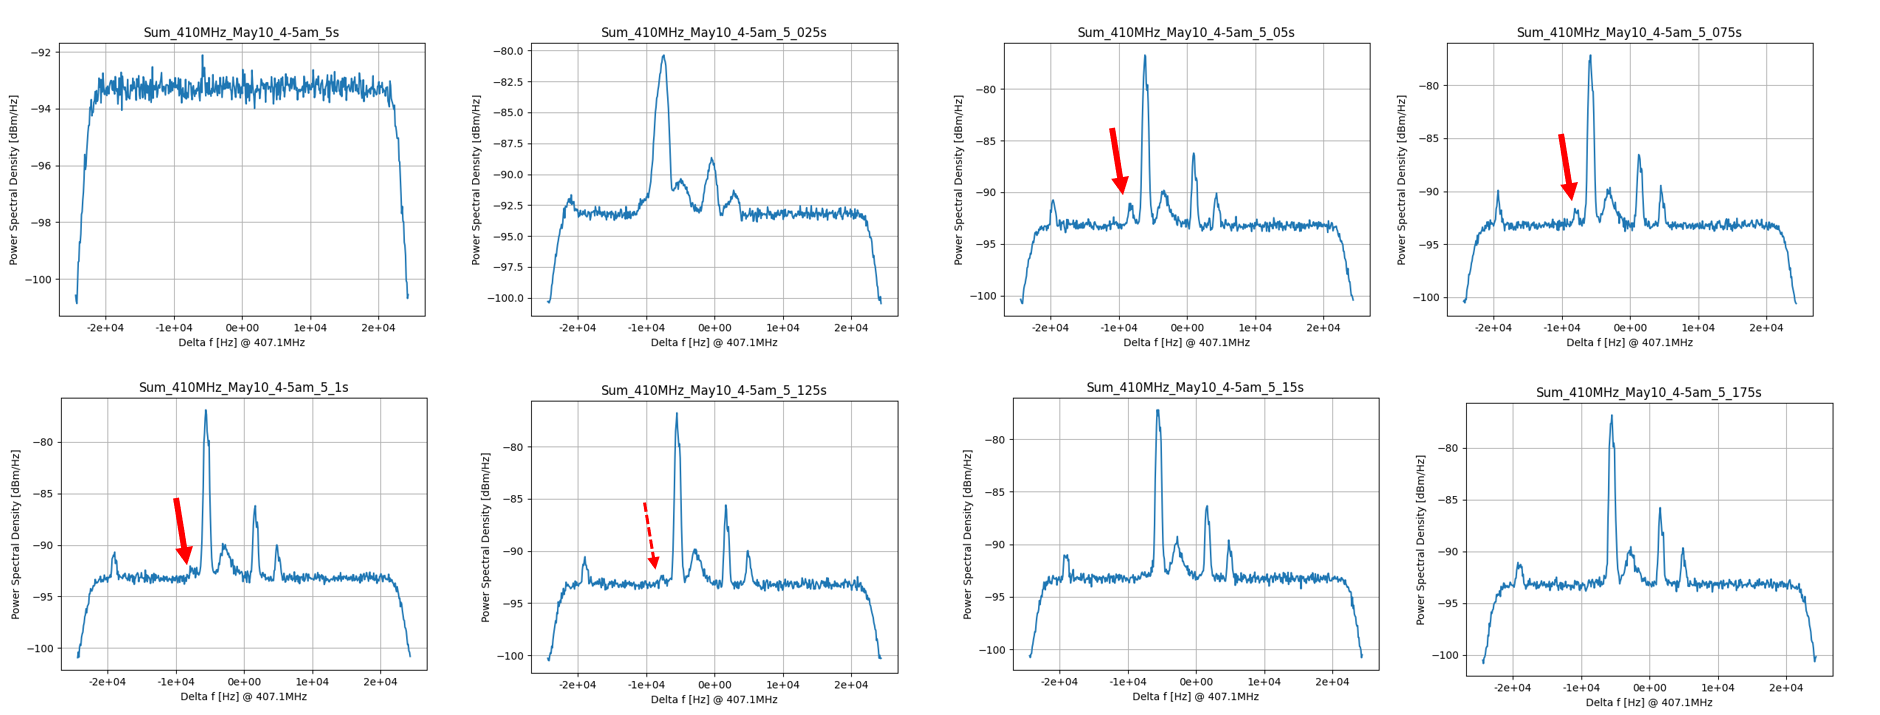
Same as before but for 4-5am on 410 MHz detector. Peak visible.


> Same as before, but for 410 MHz detectors.
> Peaks visible in the 3rd-5th slice.
>
>
> > > Following Xiangcheng Chen's analysis, I analysed 11 ms time slices separated by 25 ms to see the evolution of the potential isomer across the injection.
> > >
> > > Attachment 1: Data from May 7th 19h-20h. -t 11ms progression from -s=5 to -s=5.175
> > > Attachment 2: Data from May 8th 21h-22h. -t 11ms progression from -s=5 to -s=5.175
> > >
> > > The extra resolution gained on the 8th (and potentially other settings too) make the isomer visible where it wasn't present on the 7th.
> >
> > Hi, attached is the sum of all spectra from 1-2am on May 10th, on the 245 MHz detector. Takes me forever to download everything...
> > I used the same parameters as Guy and Xiancheng: LFRAMES = 512 (in analyzer); -t 0.011 (= 11 ms) -s 5 ... 5.175 s.
> >
> > Resolution looks good... :-) |
| Attachment 1: Sum_410MHz_May10-4-5am_5_0-5_175s.png
|
|
| Attachment 2: Sum_410MHz_May10_4-5am_5_1s.root
|
| Attachment 3: Sum_410MHz_May10_4-5am_5_05s.root
|
| Attachment 4: Sum_410MHz_May10_4-5am_5_15s.root
|
| Attachment 5: Sum_410MHz_May10_4-5am_5_025s.root
|
| Attachment 6: Sum_410MHz_May10_4-5am_5_075s.root
|
| Attachment 7: Sum_410MHz_May10_4-5am_5_125s.root
|
| Attachment 8: Sum_410MHz_May10_4-5am_5_175s.root
|
| Attachment 9: Sum_410MHz_May10_4-5am_5s.root
|
|
132
|
Mon May 10 07:13:20 2021 |
Iris (Chris C., Jeff C.) | Analysis | Comparison between 72Ge: 10th 5-6am on 410 MHz |
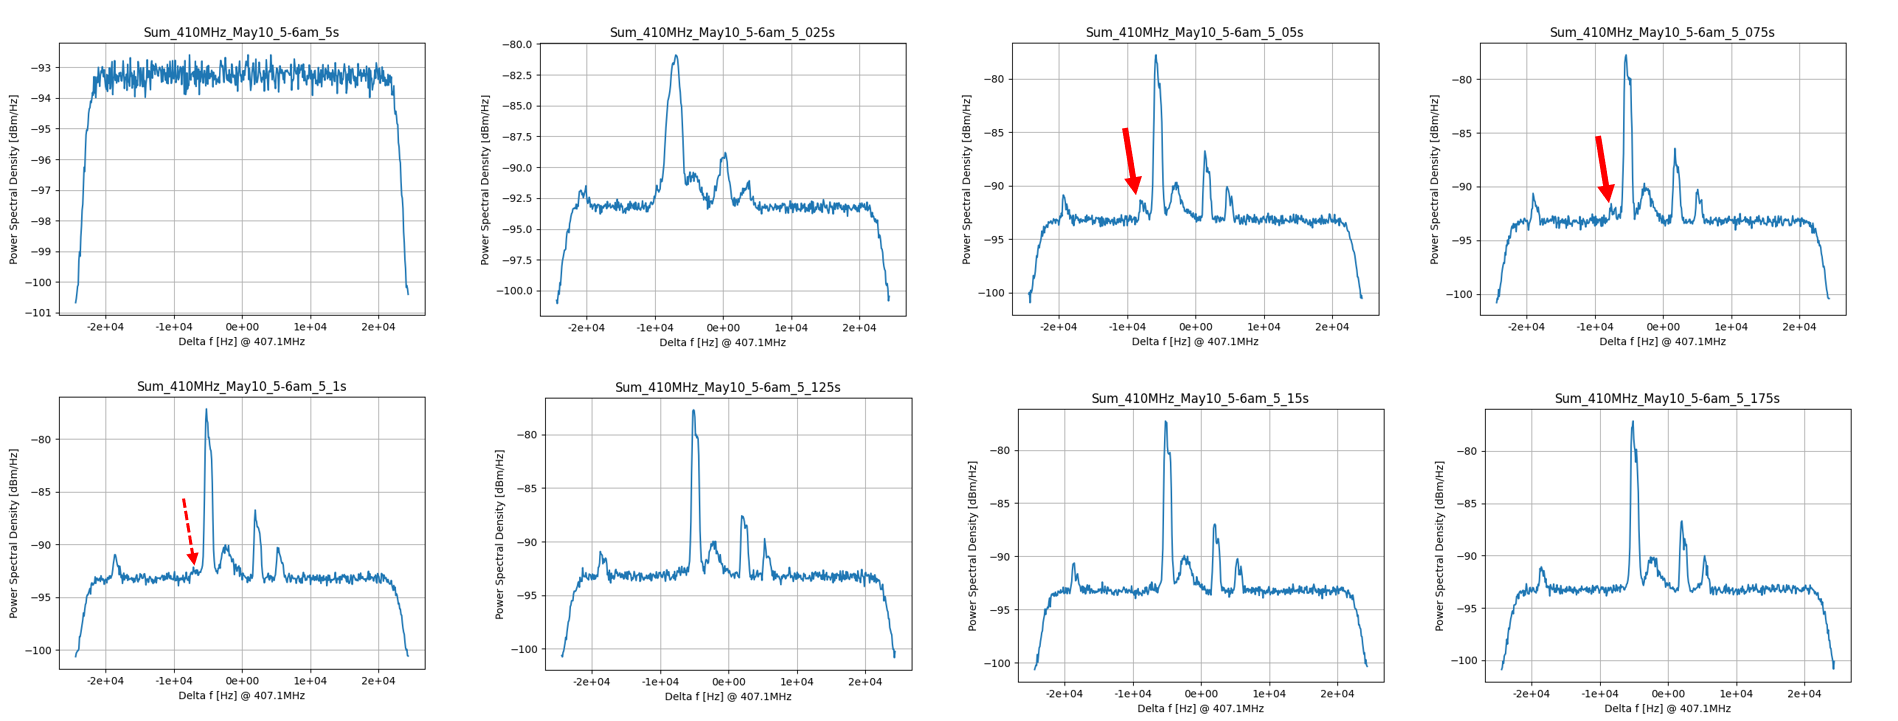
Same as before for 5-6 am.
Peak still there, maybe a bit less than before.


> Same as before but for 4-5am on 410 MHz detector. Peak visible.
>
>
> > Same as before, but for 410 MHz detectors.
> > Peaks visible in the 3rd-5th slice.
> >
> >
> > > > Following Xiangcheng Chen's analysis, I analysed 11 ms time slices separated by 25 ms to see the evolution of the potential isomer across the injection.
> > > >
> > > > Attachment 1: Data from May 7th 19h-20h. -t 11ms progression from -s=5 to -s=5.175
> > > > Attachment 2: Data from May 8th 21h-22h. -t 11ms progression from -s=5 to -s=5.175
> > > >
> > > > The extra resolution gained on the 8th (and potentially other settings too) make the isomer visible where it wasn't present on the 7th.
> > >
> > > Hi, attached is the sum of all spectra from 1-2am on May 10th, on the 245 MHz detector. Takes me forever to download everything...
> > > I used the same parameters as Guy and Xiancheng: LFRAMES = 512 (in analyzer); -t 0.011 (= 11 ms) -s 5 ... 5.175 s.
> > >
> > > Resolution looks good... :-) |
| Attachment 1: Sum_410MHz_May10-5-6am_5_0-5_175s.png
|
|
| Attachment 2: Sum_410MHz_May10_5-6am_5s.root
|
| Attachment 3: Sum_410MHz_May10_5-6am_5_025s.root
|
| Attachment 4: Sum_410MHz_May10_5-6am_5_05s.root
|
| Attachment 5: Sum_410MHz_May10_5-6am_5_075s.root
|
| Attachment 6: Sum_410MHz_May10_5-6am_5_1s.root
|
| Attachment 7: Sum_410MHz_May10_5-6am_5_125s.root
|
| Attachment 8: Sum_410MHz_May10_5-6am_5_15s.root
|
| Attachment 9: Sum_410MHz_May10_5-6am_5_175s.root
|
|
108
|
Sun May 9 17:39:21 2021 |
Guy | Analysis | Comparison between 72Ge: 7th 19h vs 8th 21h |
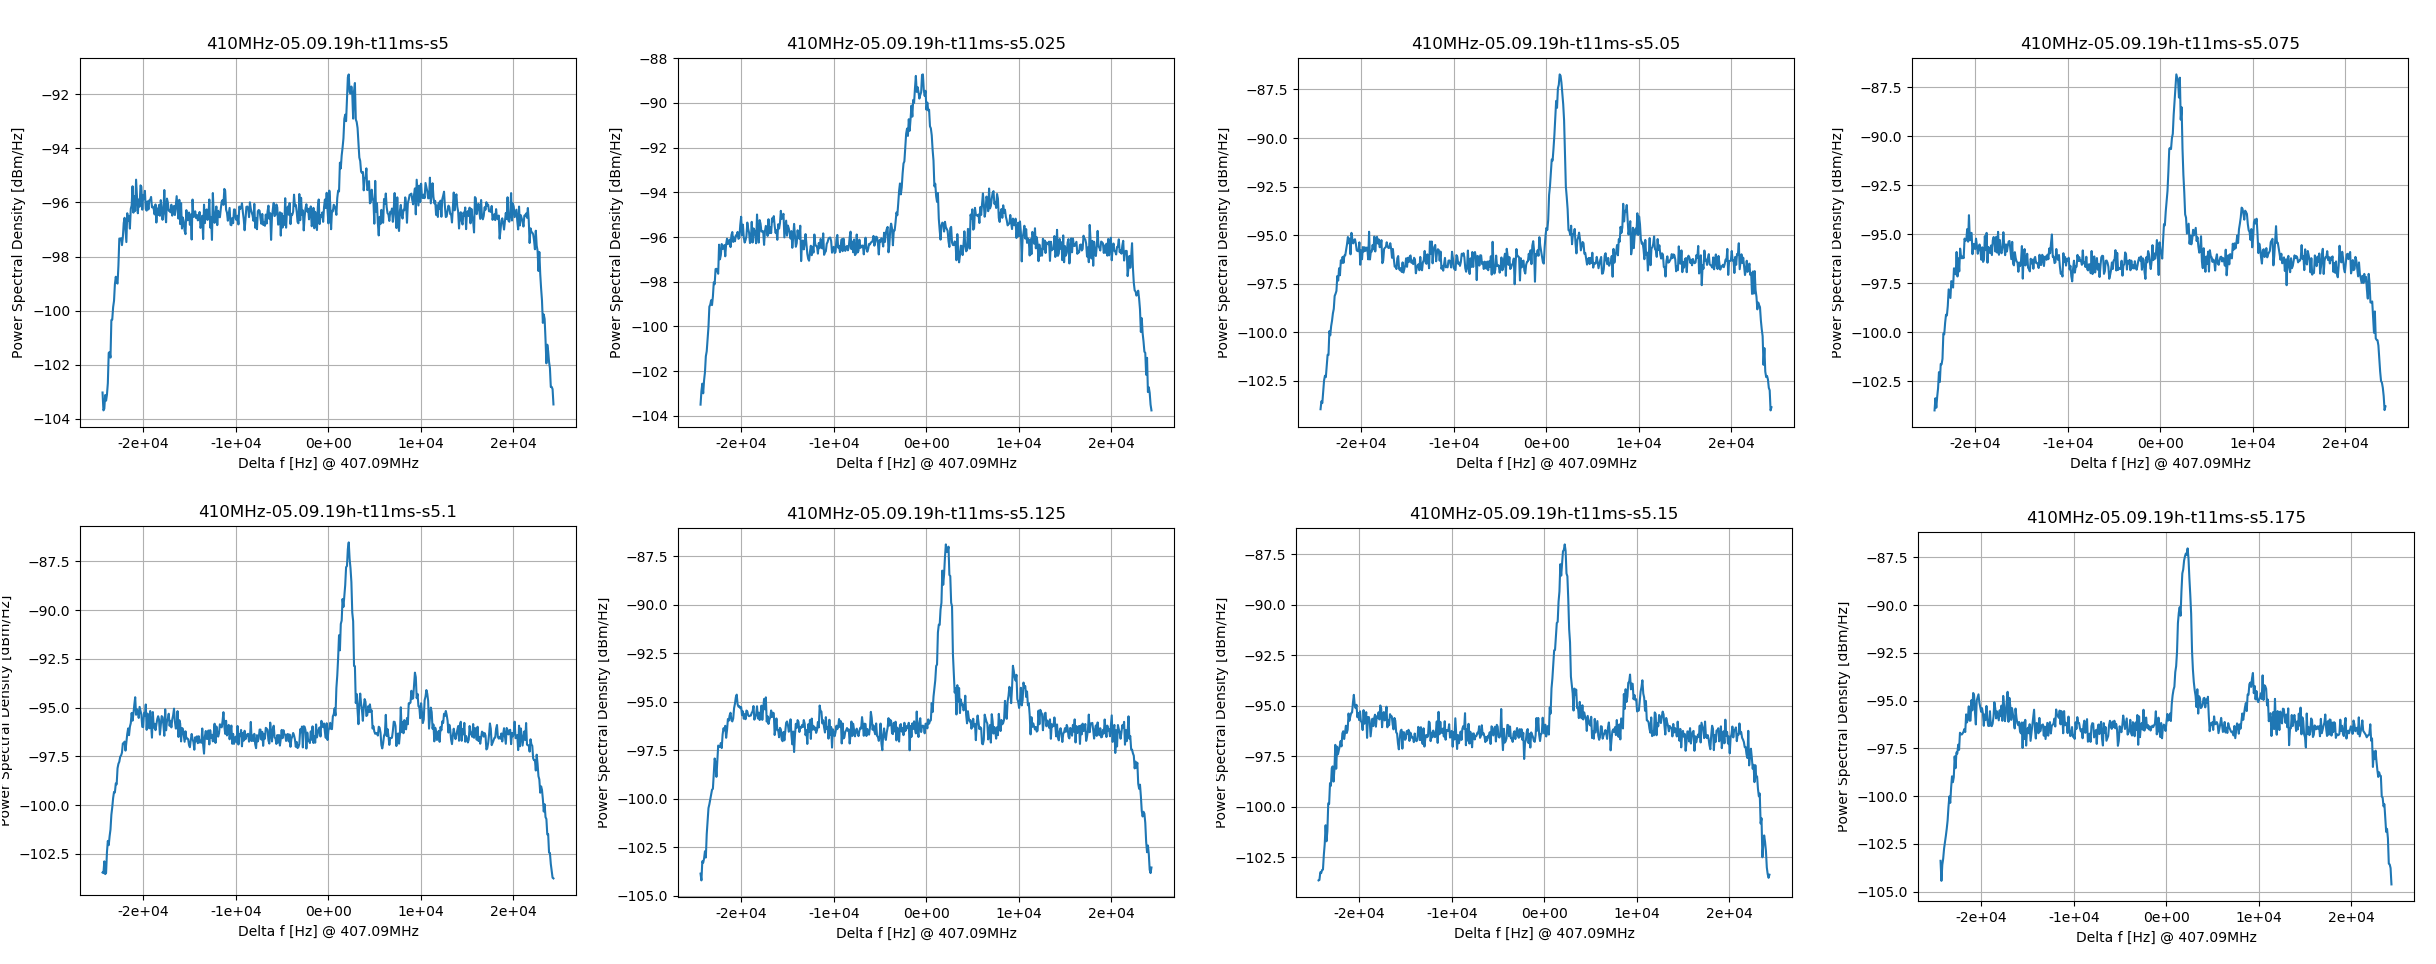
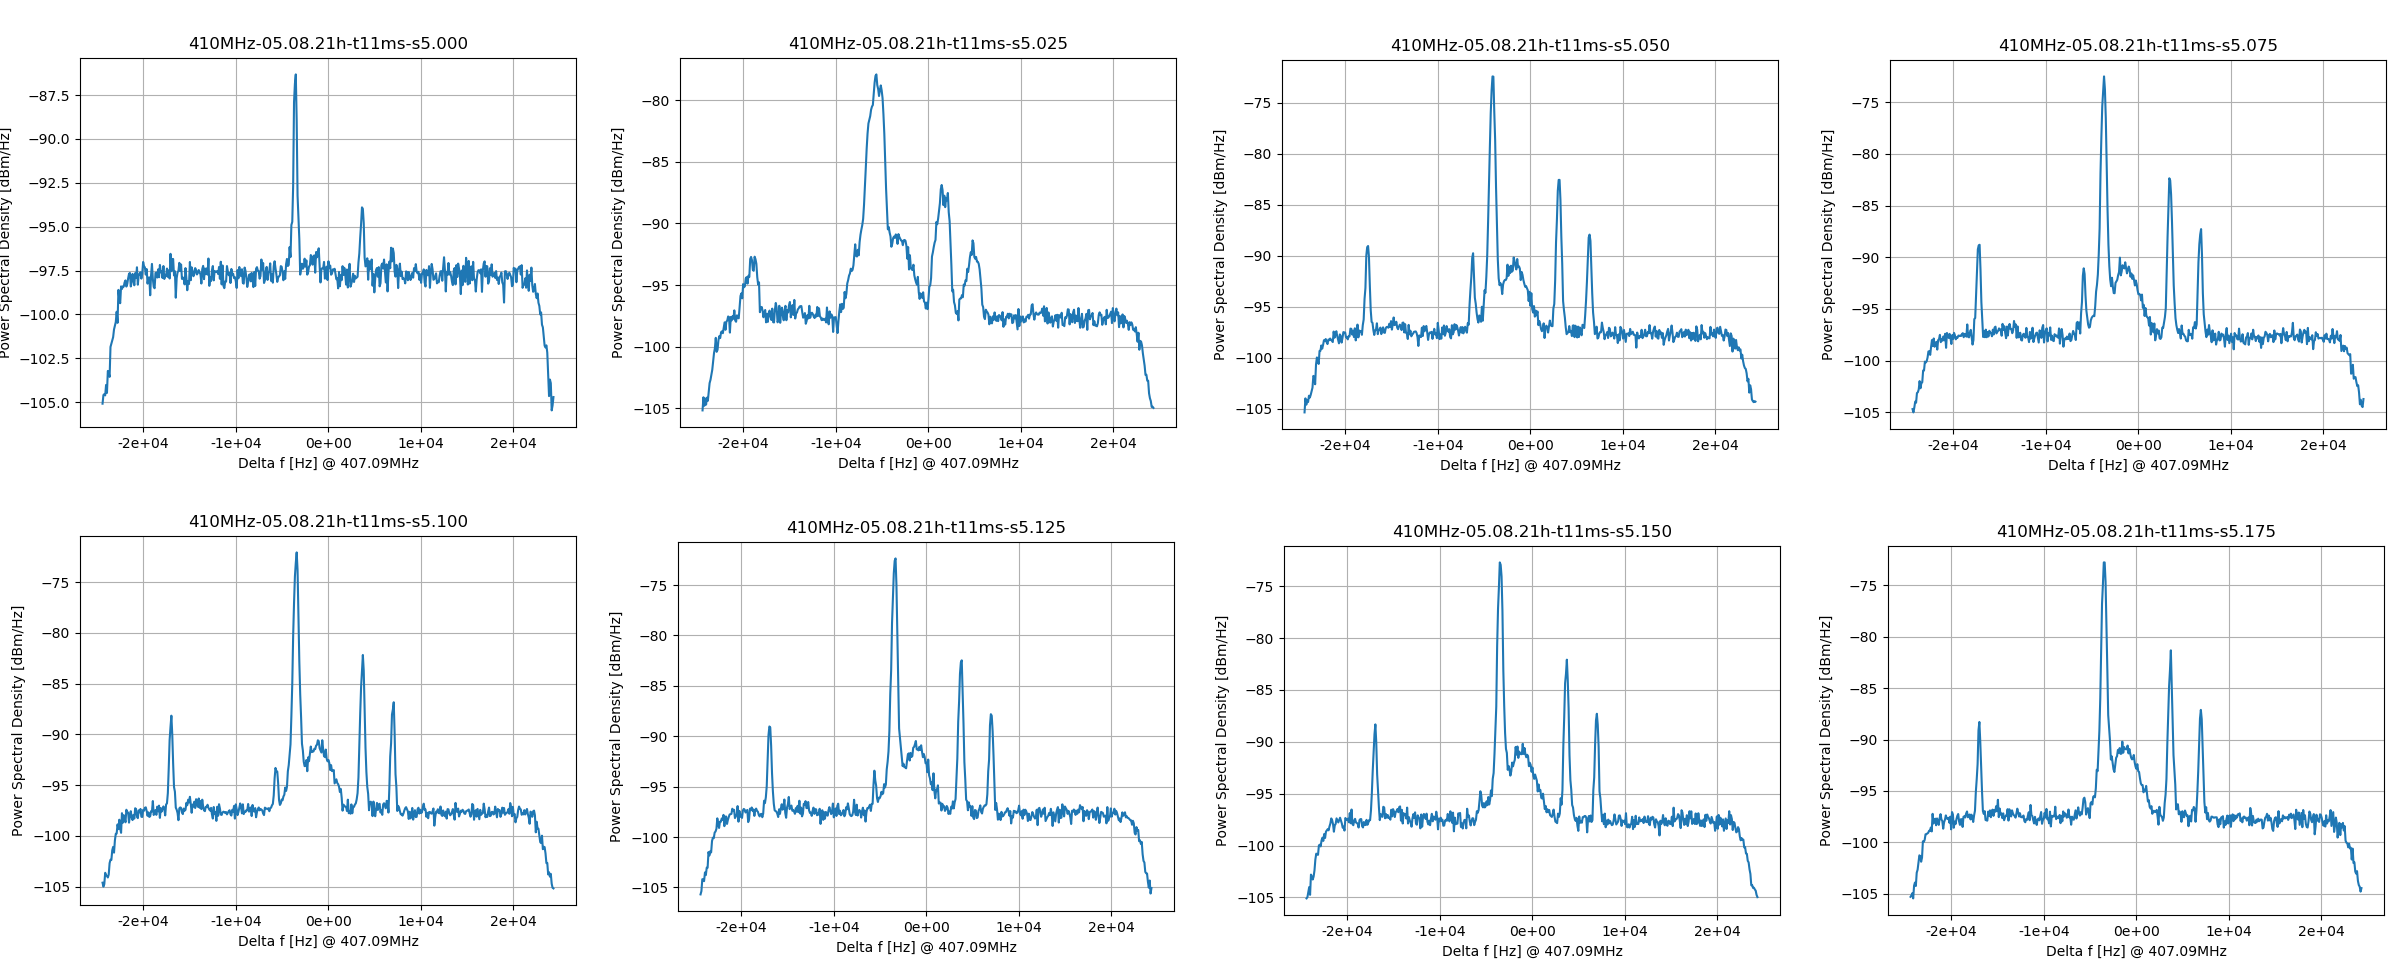
Following Xiangcheng Chen's analysis, I analysed 11 ms time slices separated by 25 ms to see the evolution of the potential isomer across the injection.

Attachment 1: Data from May 7th 19h-20h. -t 11ms progression from -s=5 to -s=5.175
Attachment 2: Data from May 8th 21h-22h. -t 11ms progression from -s=5 to -s=5.175

The extra resolution gained on the 8th (and potentially other settings too) make the isomer visible where it wasn't present on the 7th. |
| Attachment 1: 410MHz-05.09.19h-t11ms-sMontage.png
|
|
| Attachment 2: 410MHz-05.08.21h-t11ms-sMontage.png
|
|
|
112
|
Sun May 9 20:34:47 2021 |
Rui-Jiu Chen | Analysis | Comparison of frequency spectrum between 72Ge and other isotope |
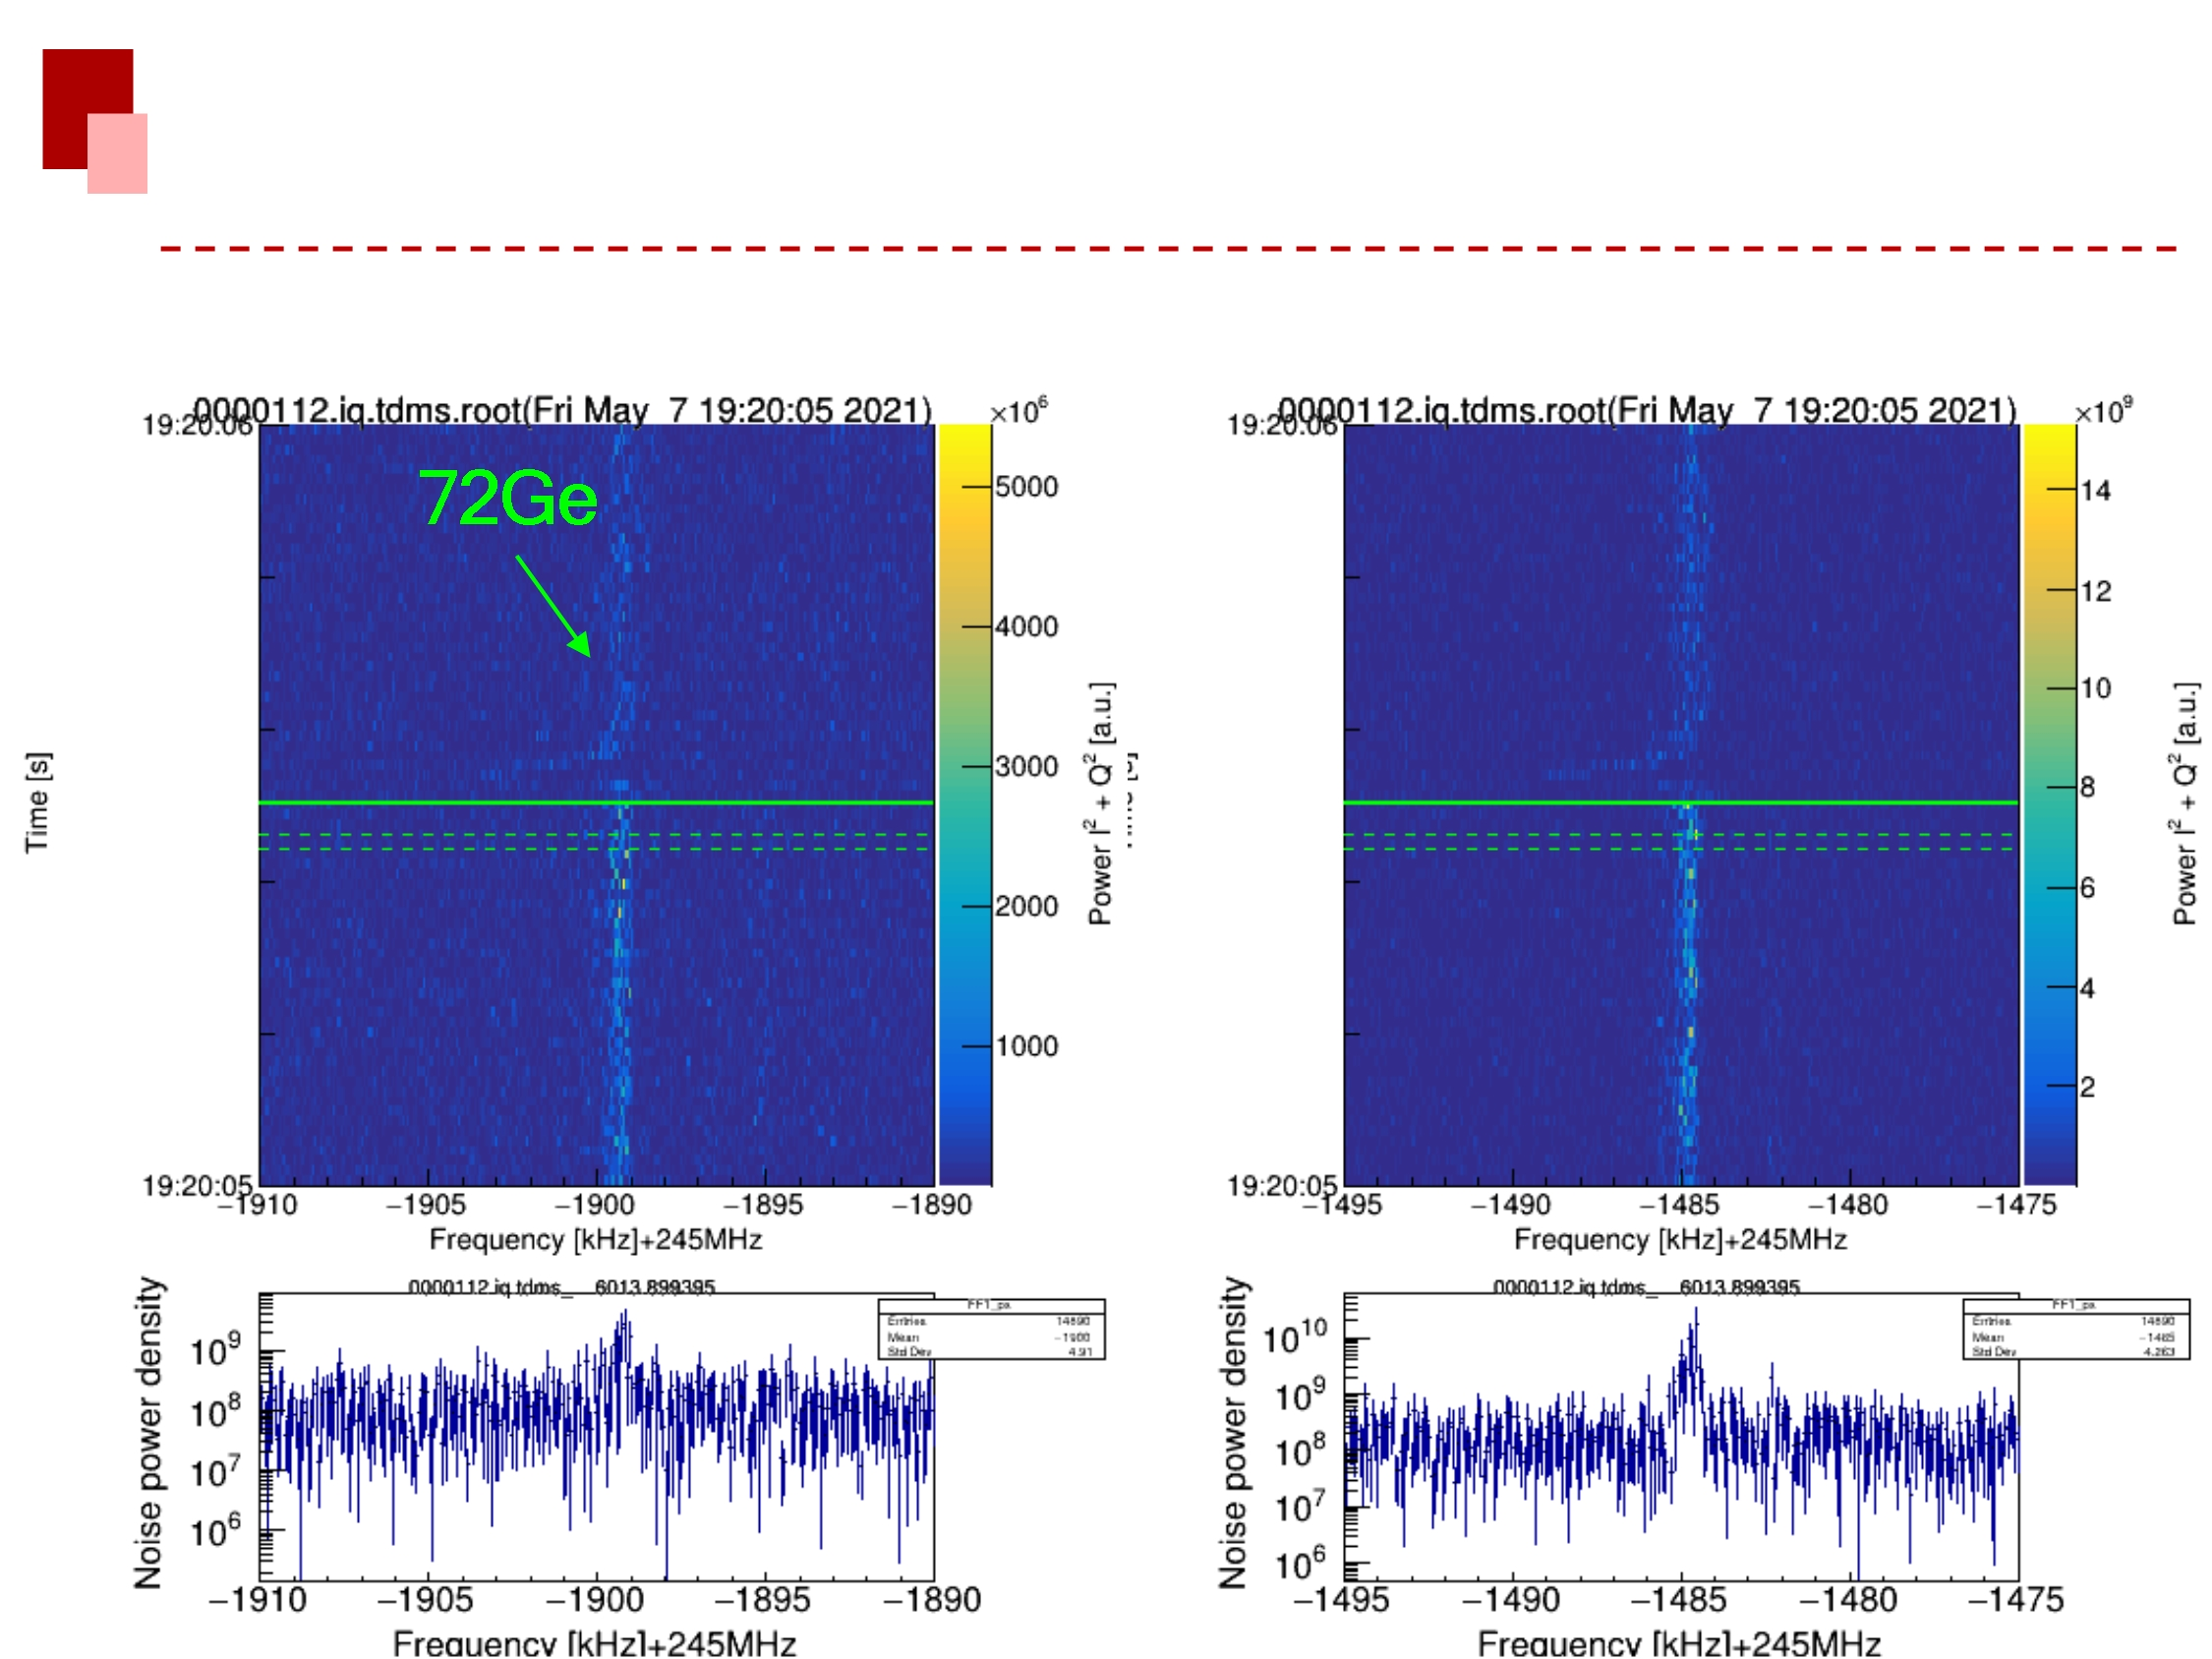
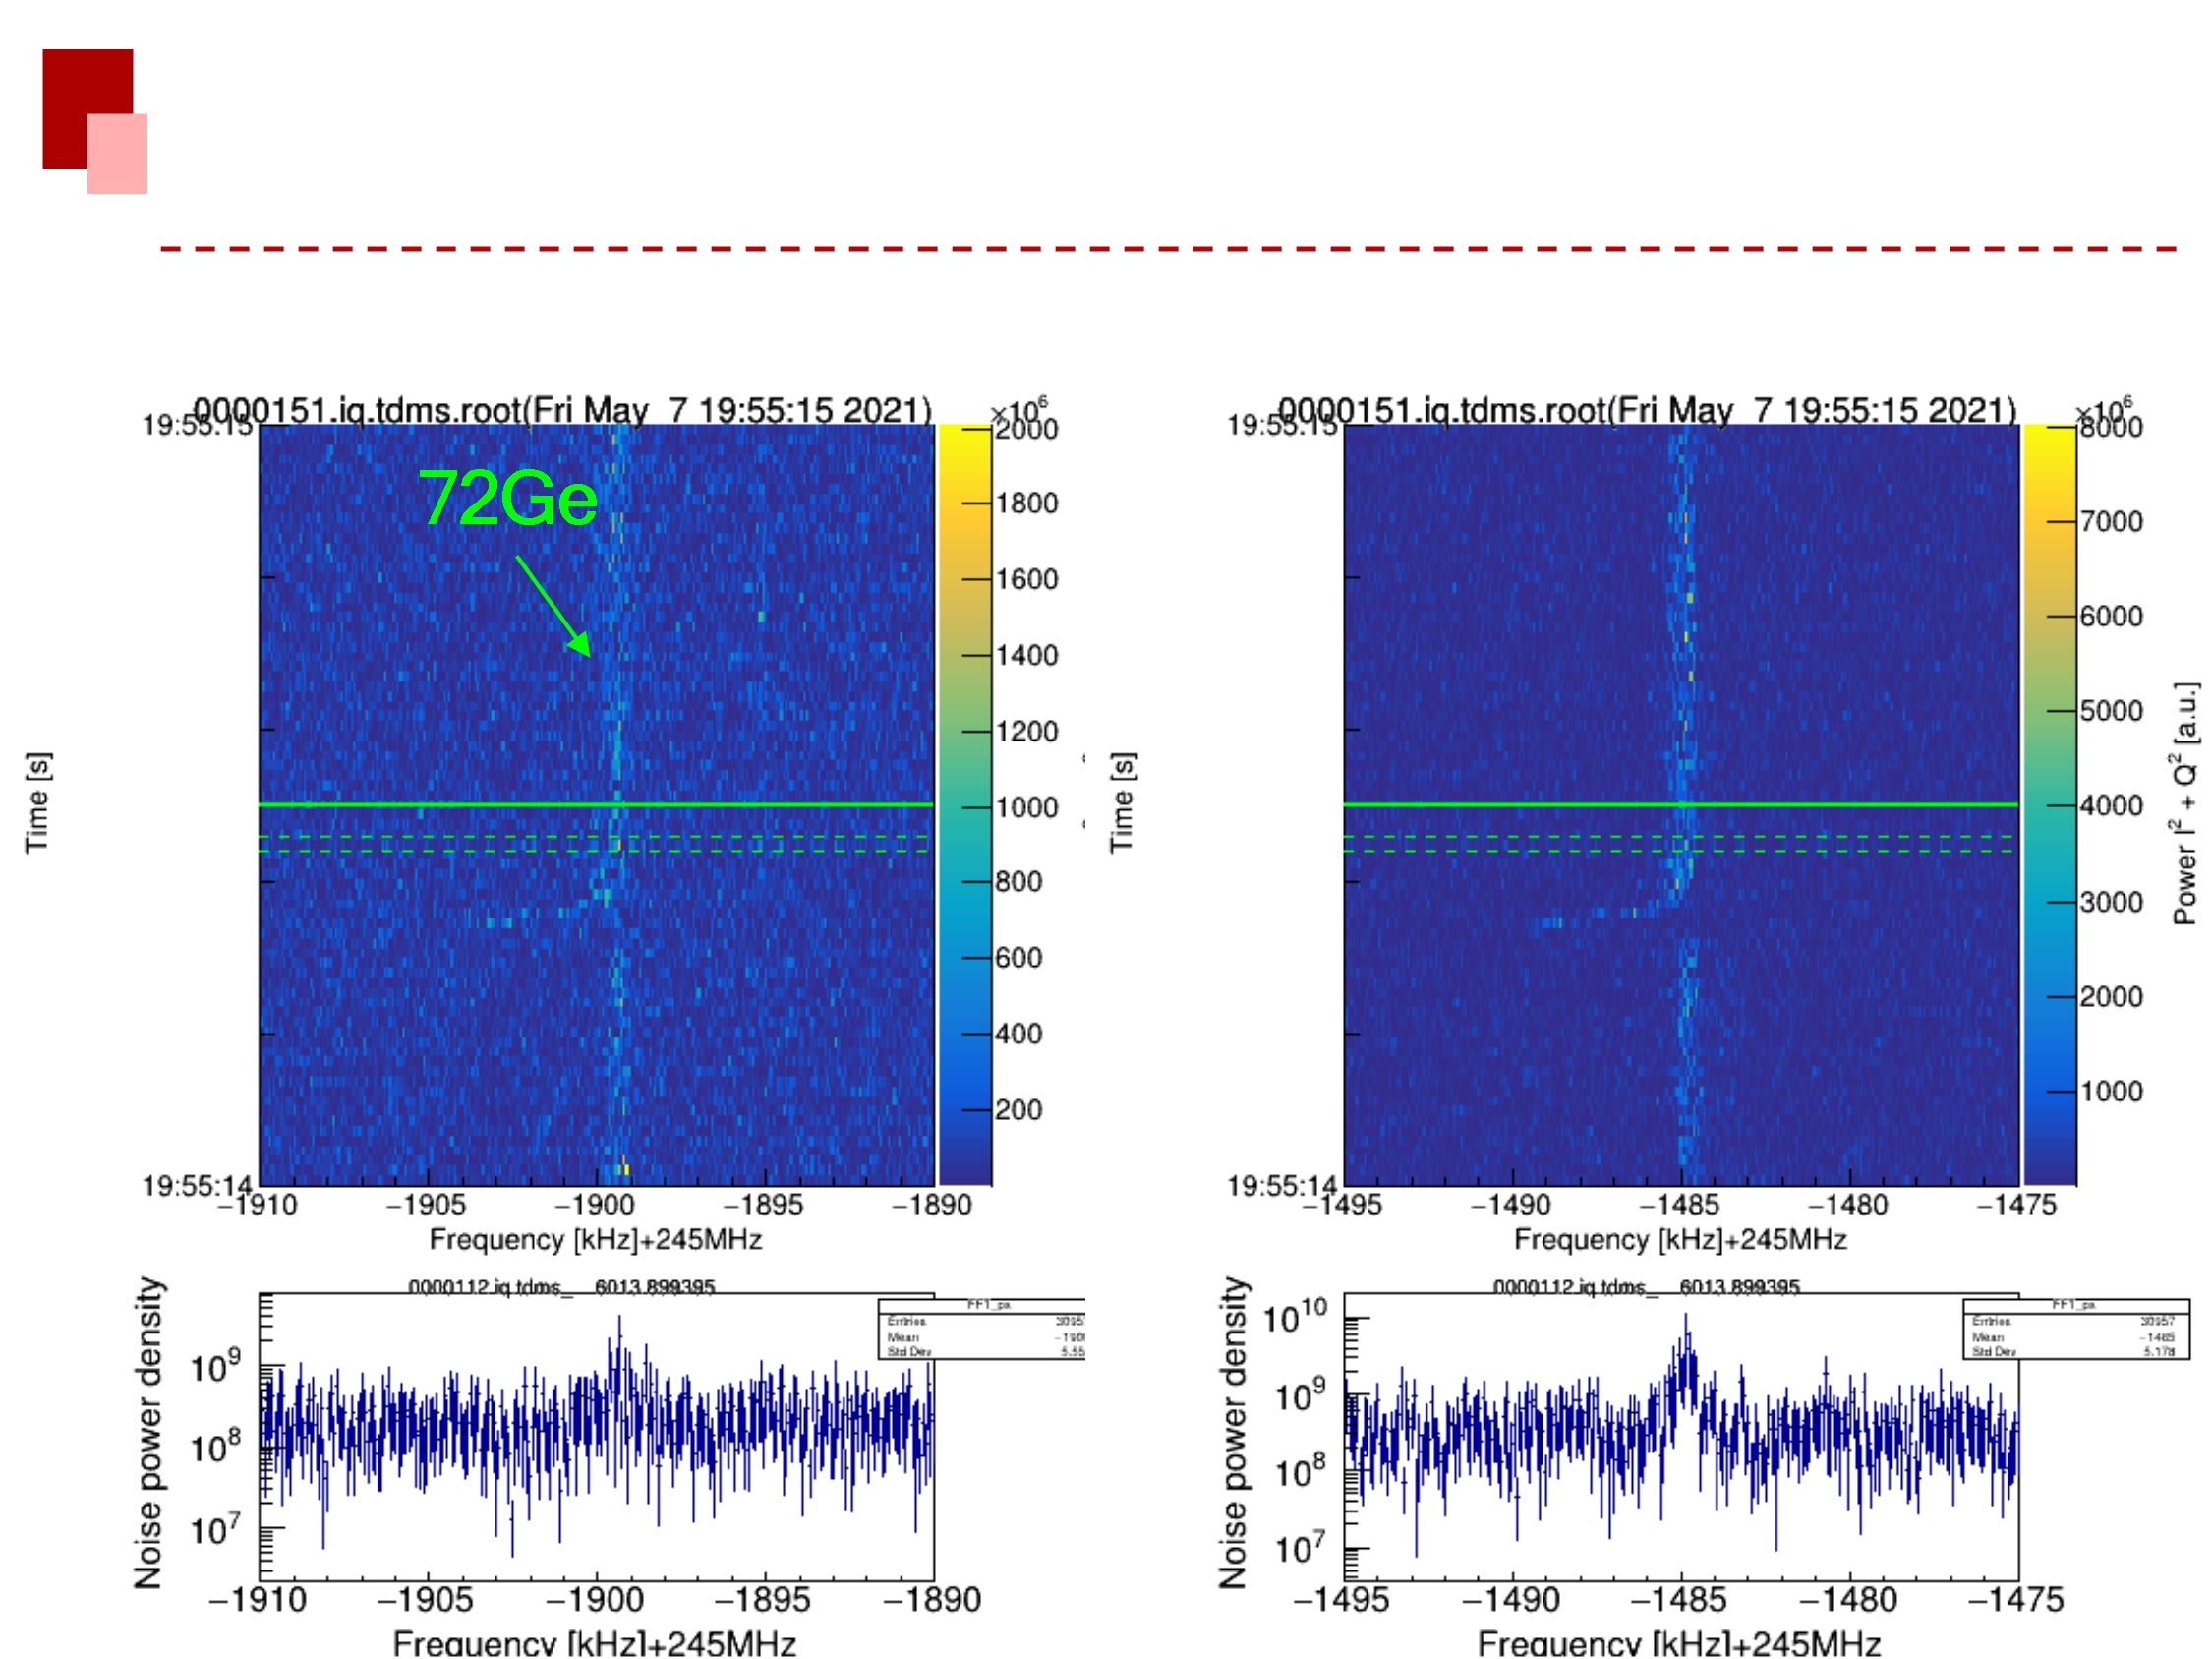
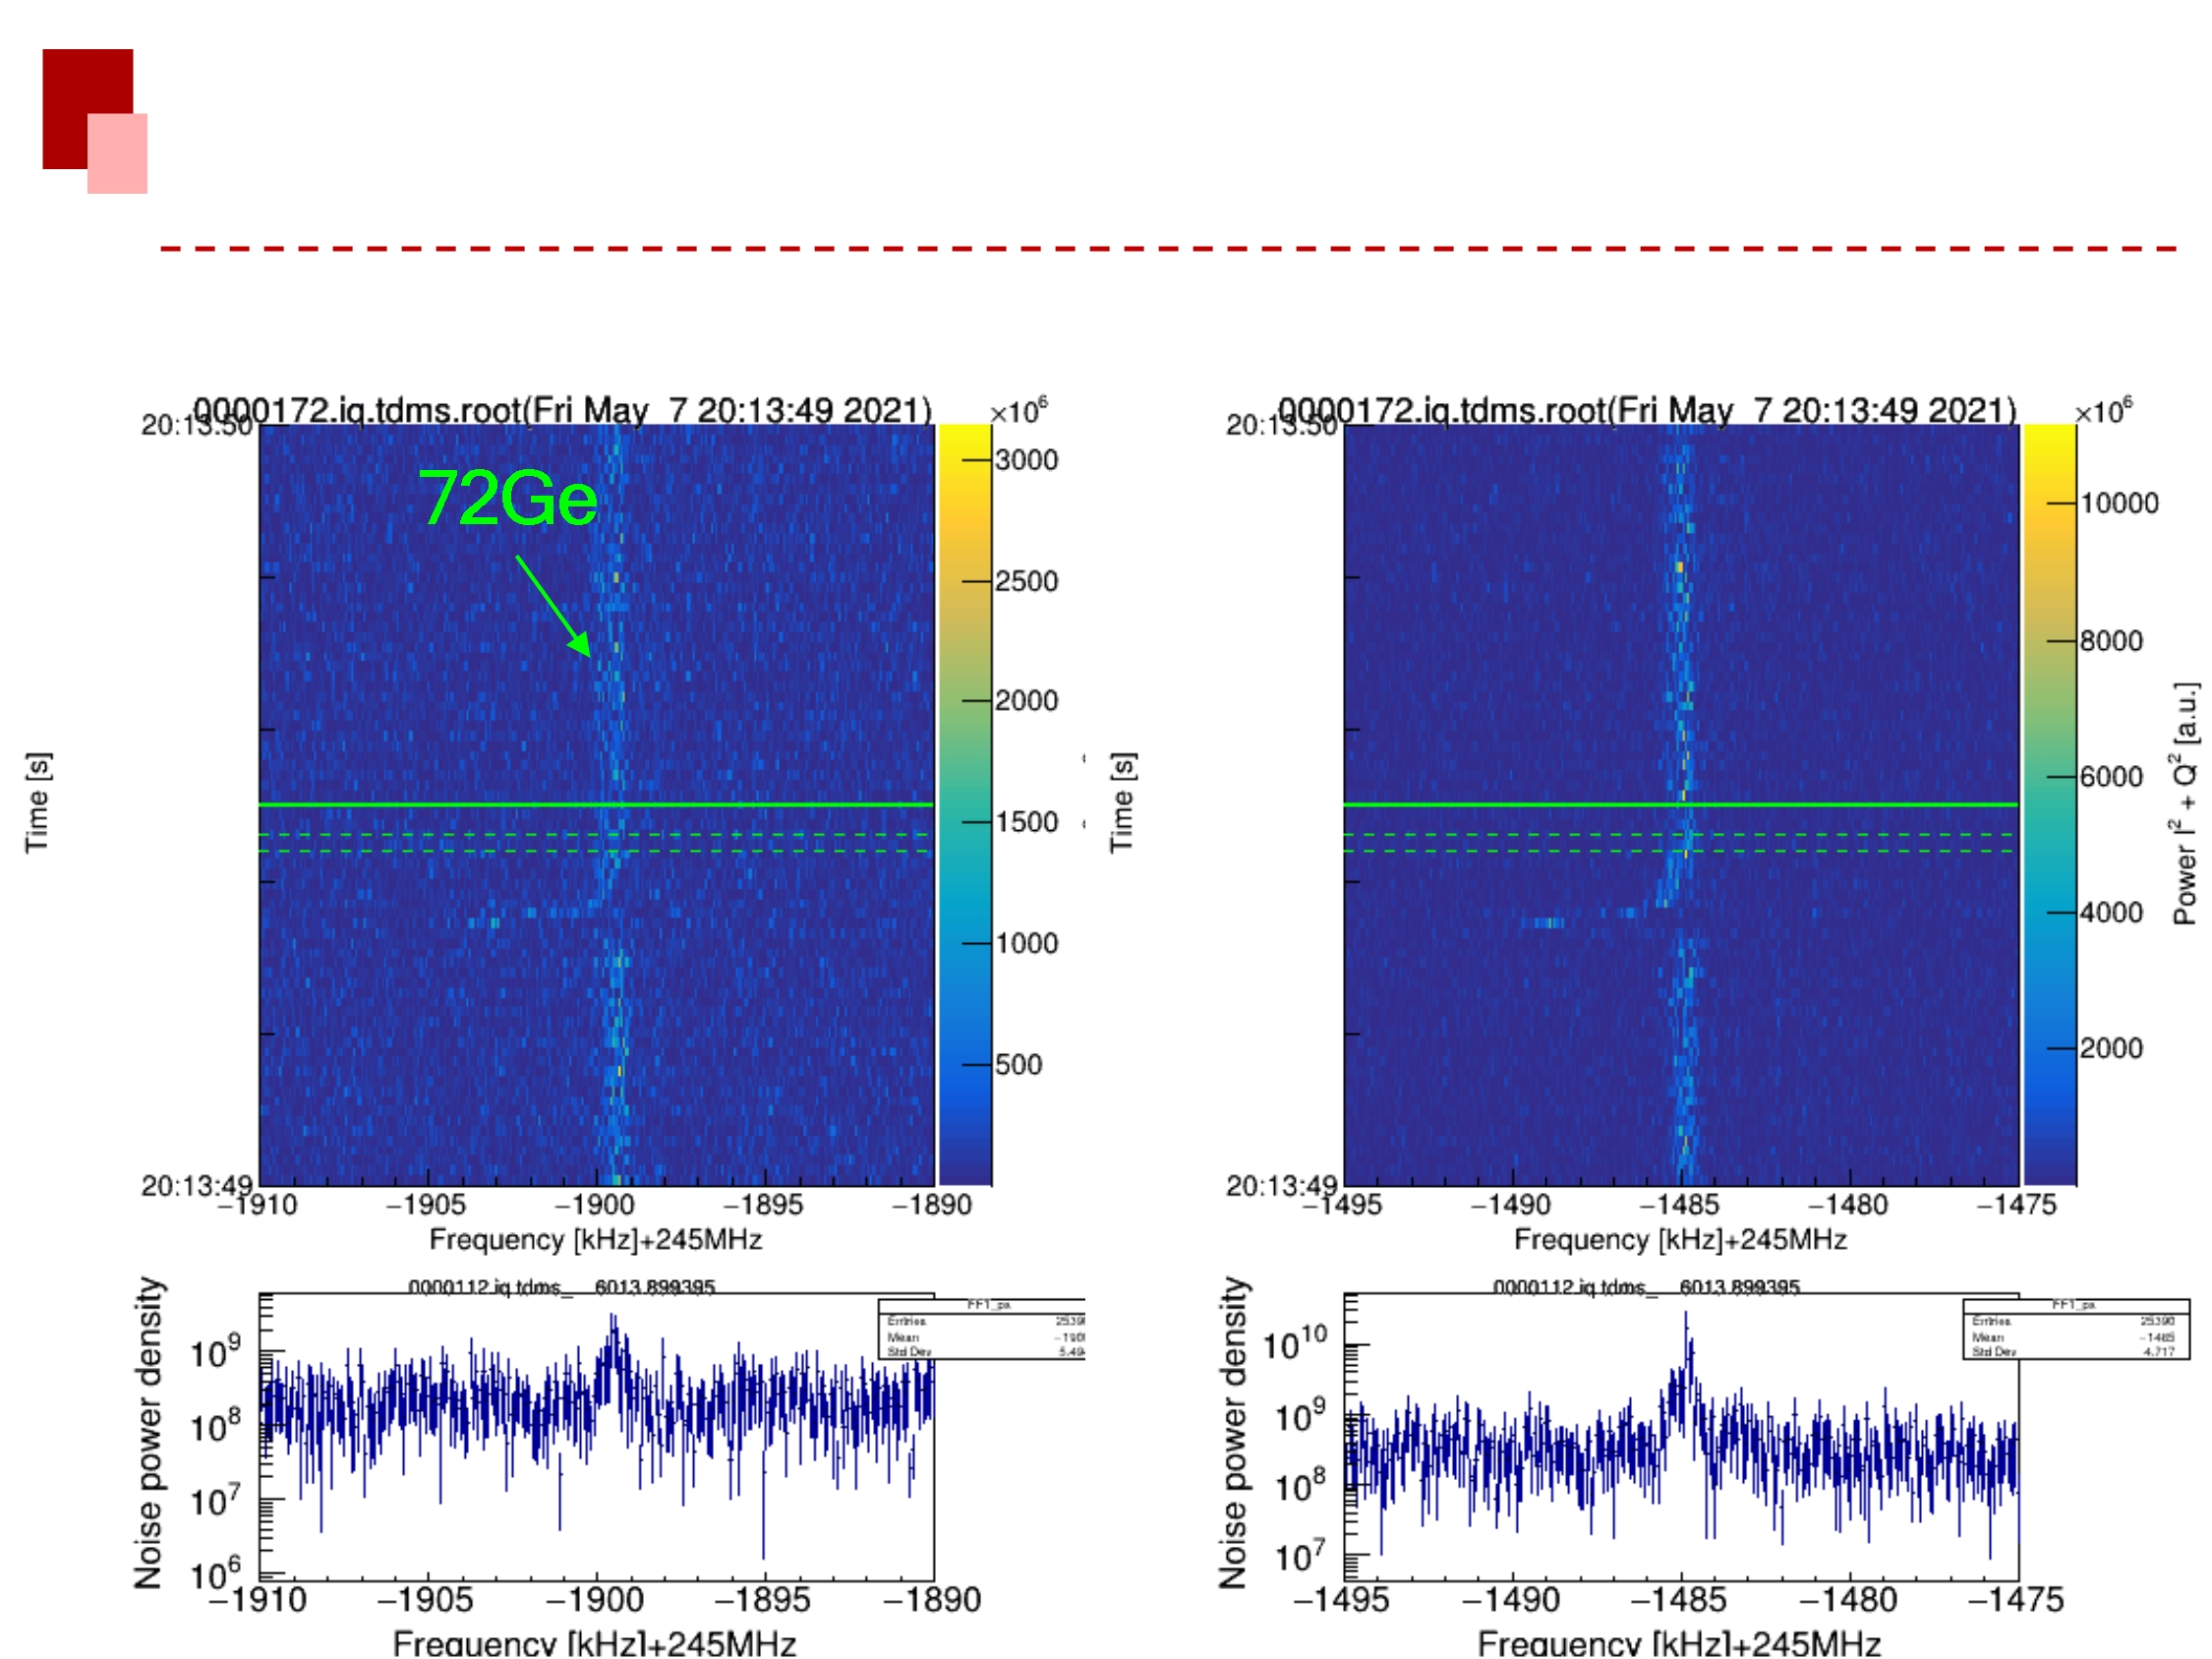
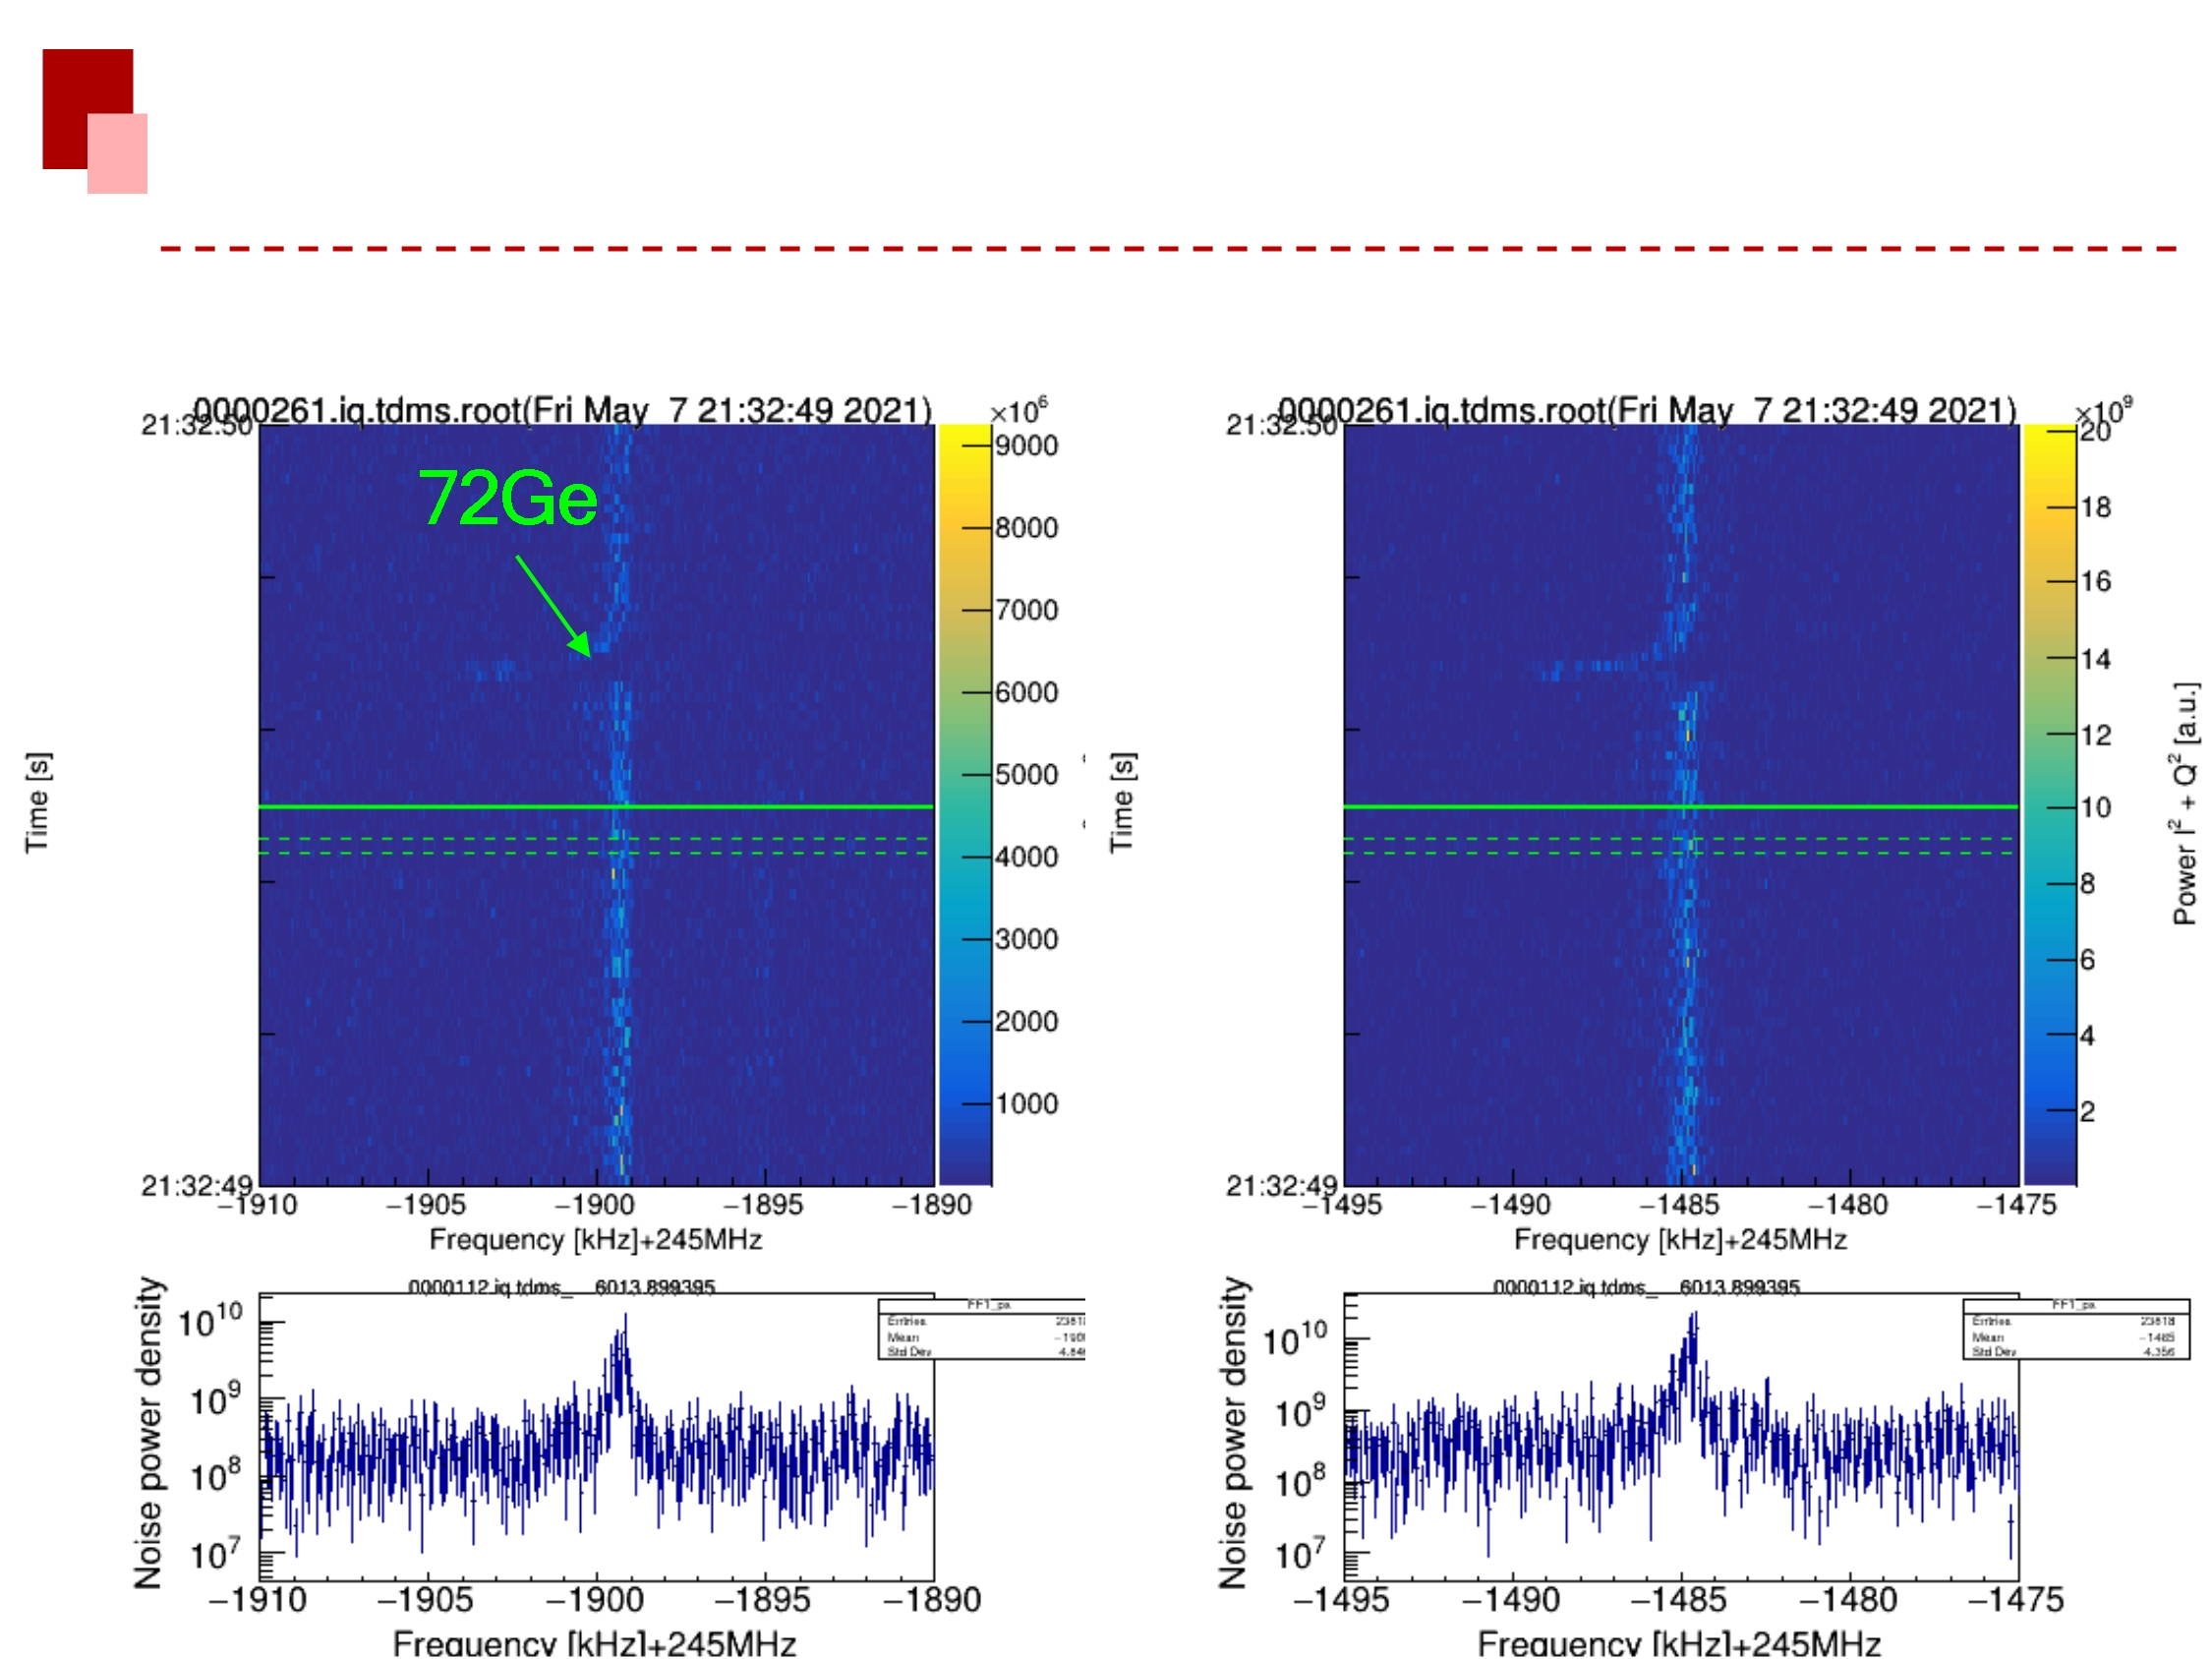
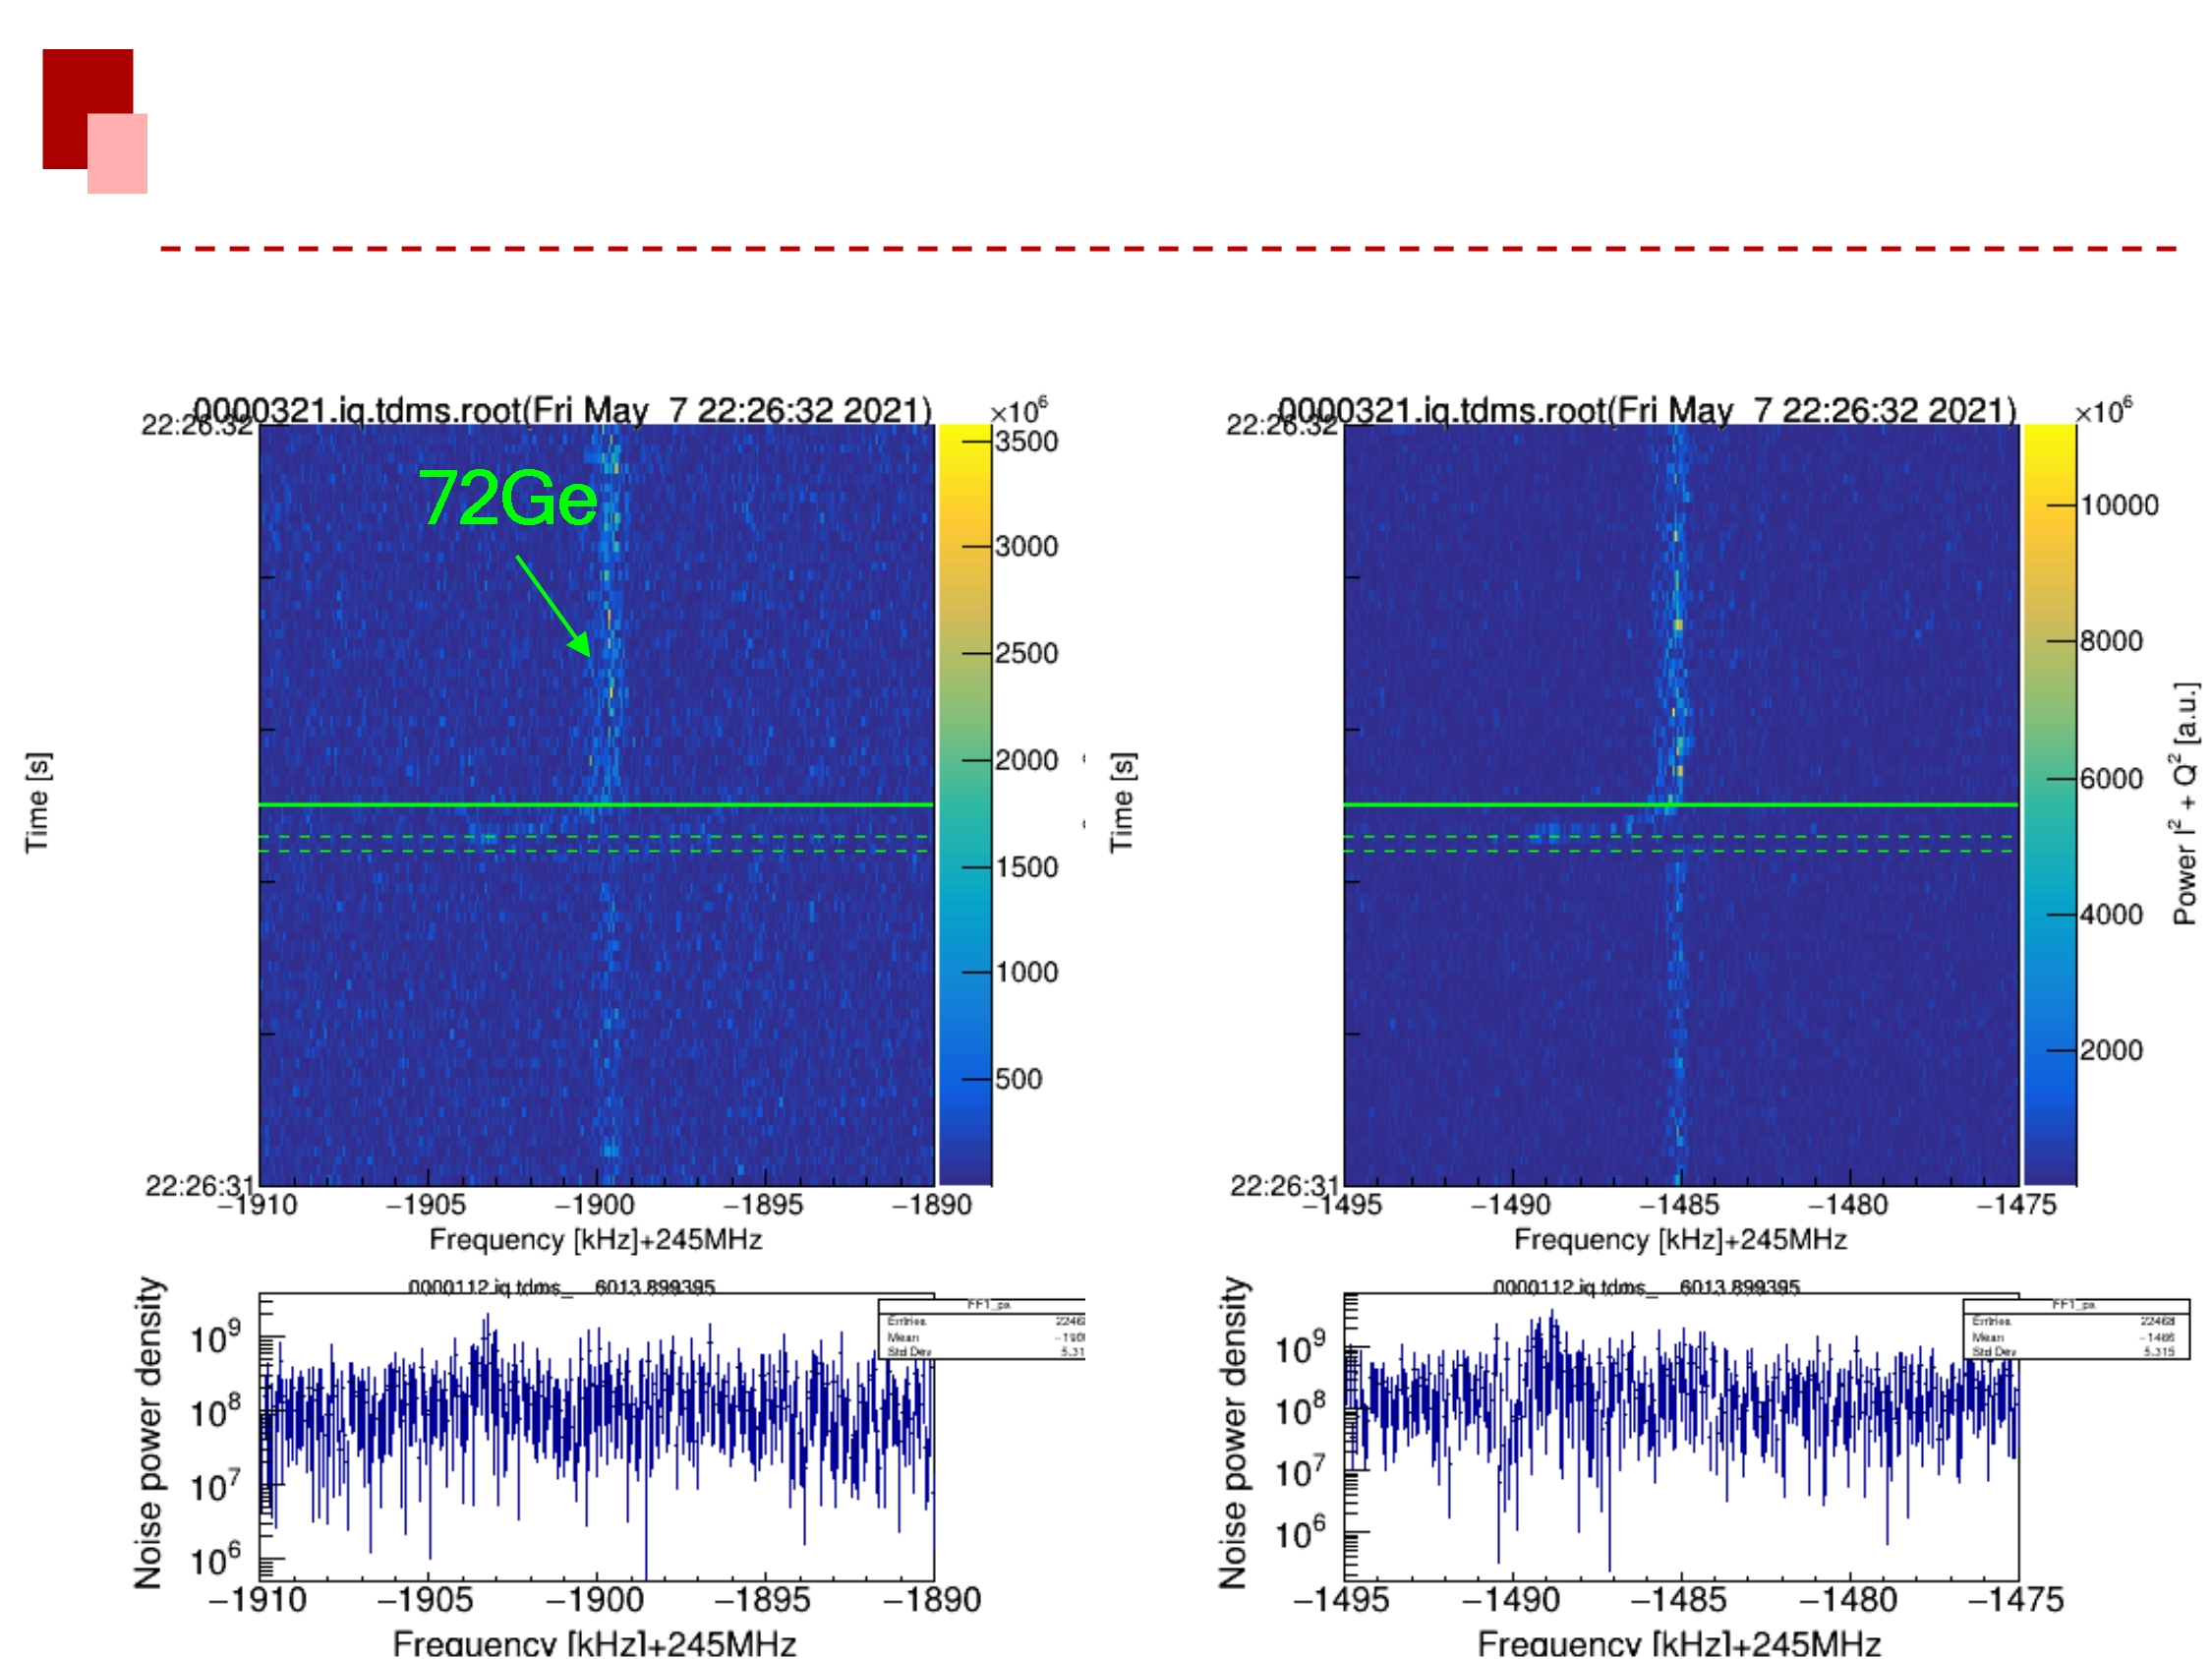
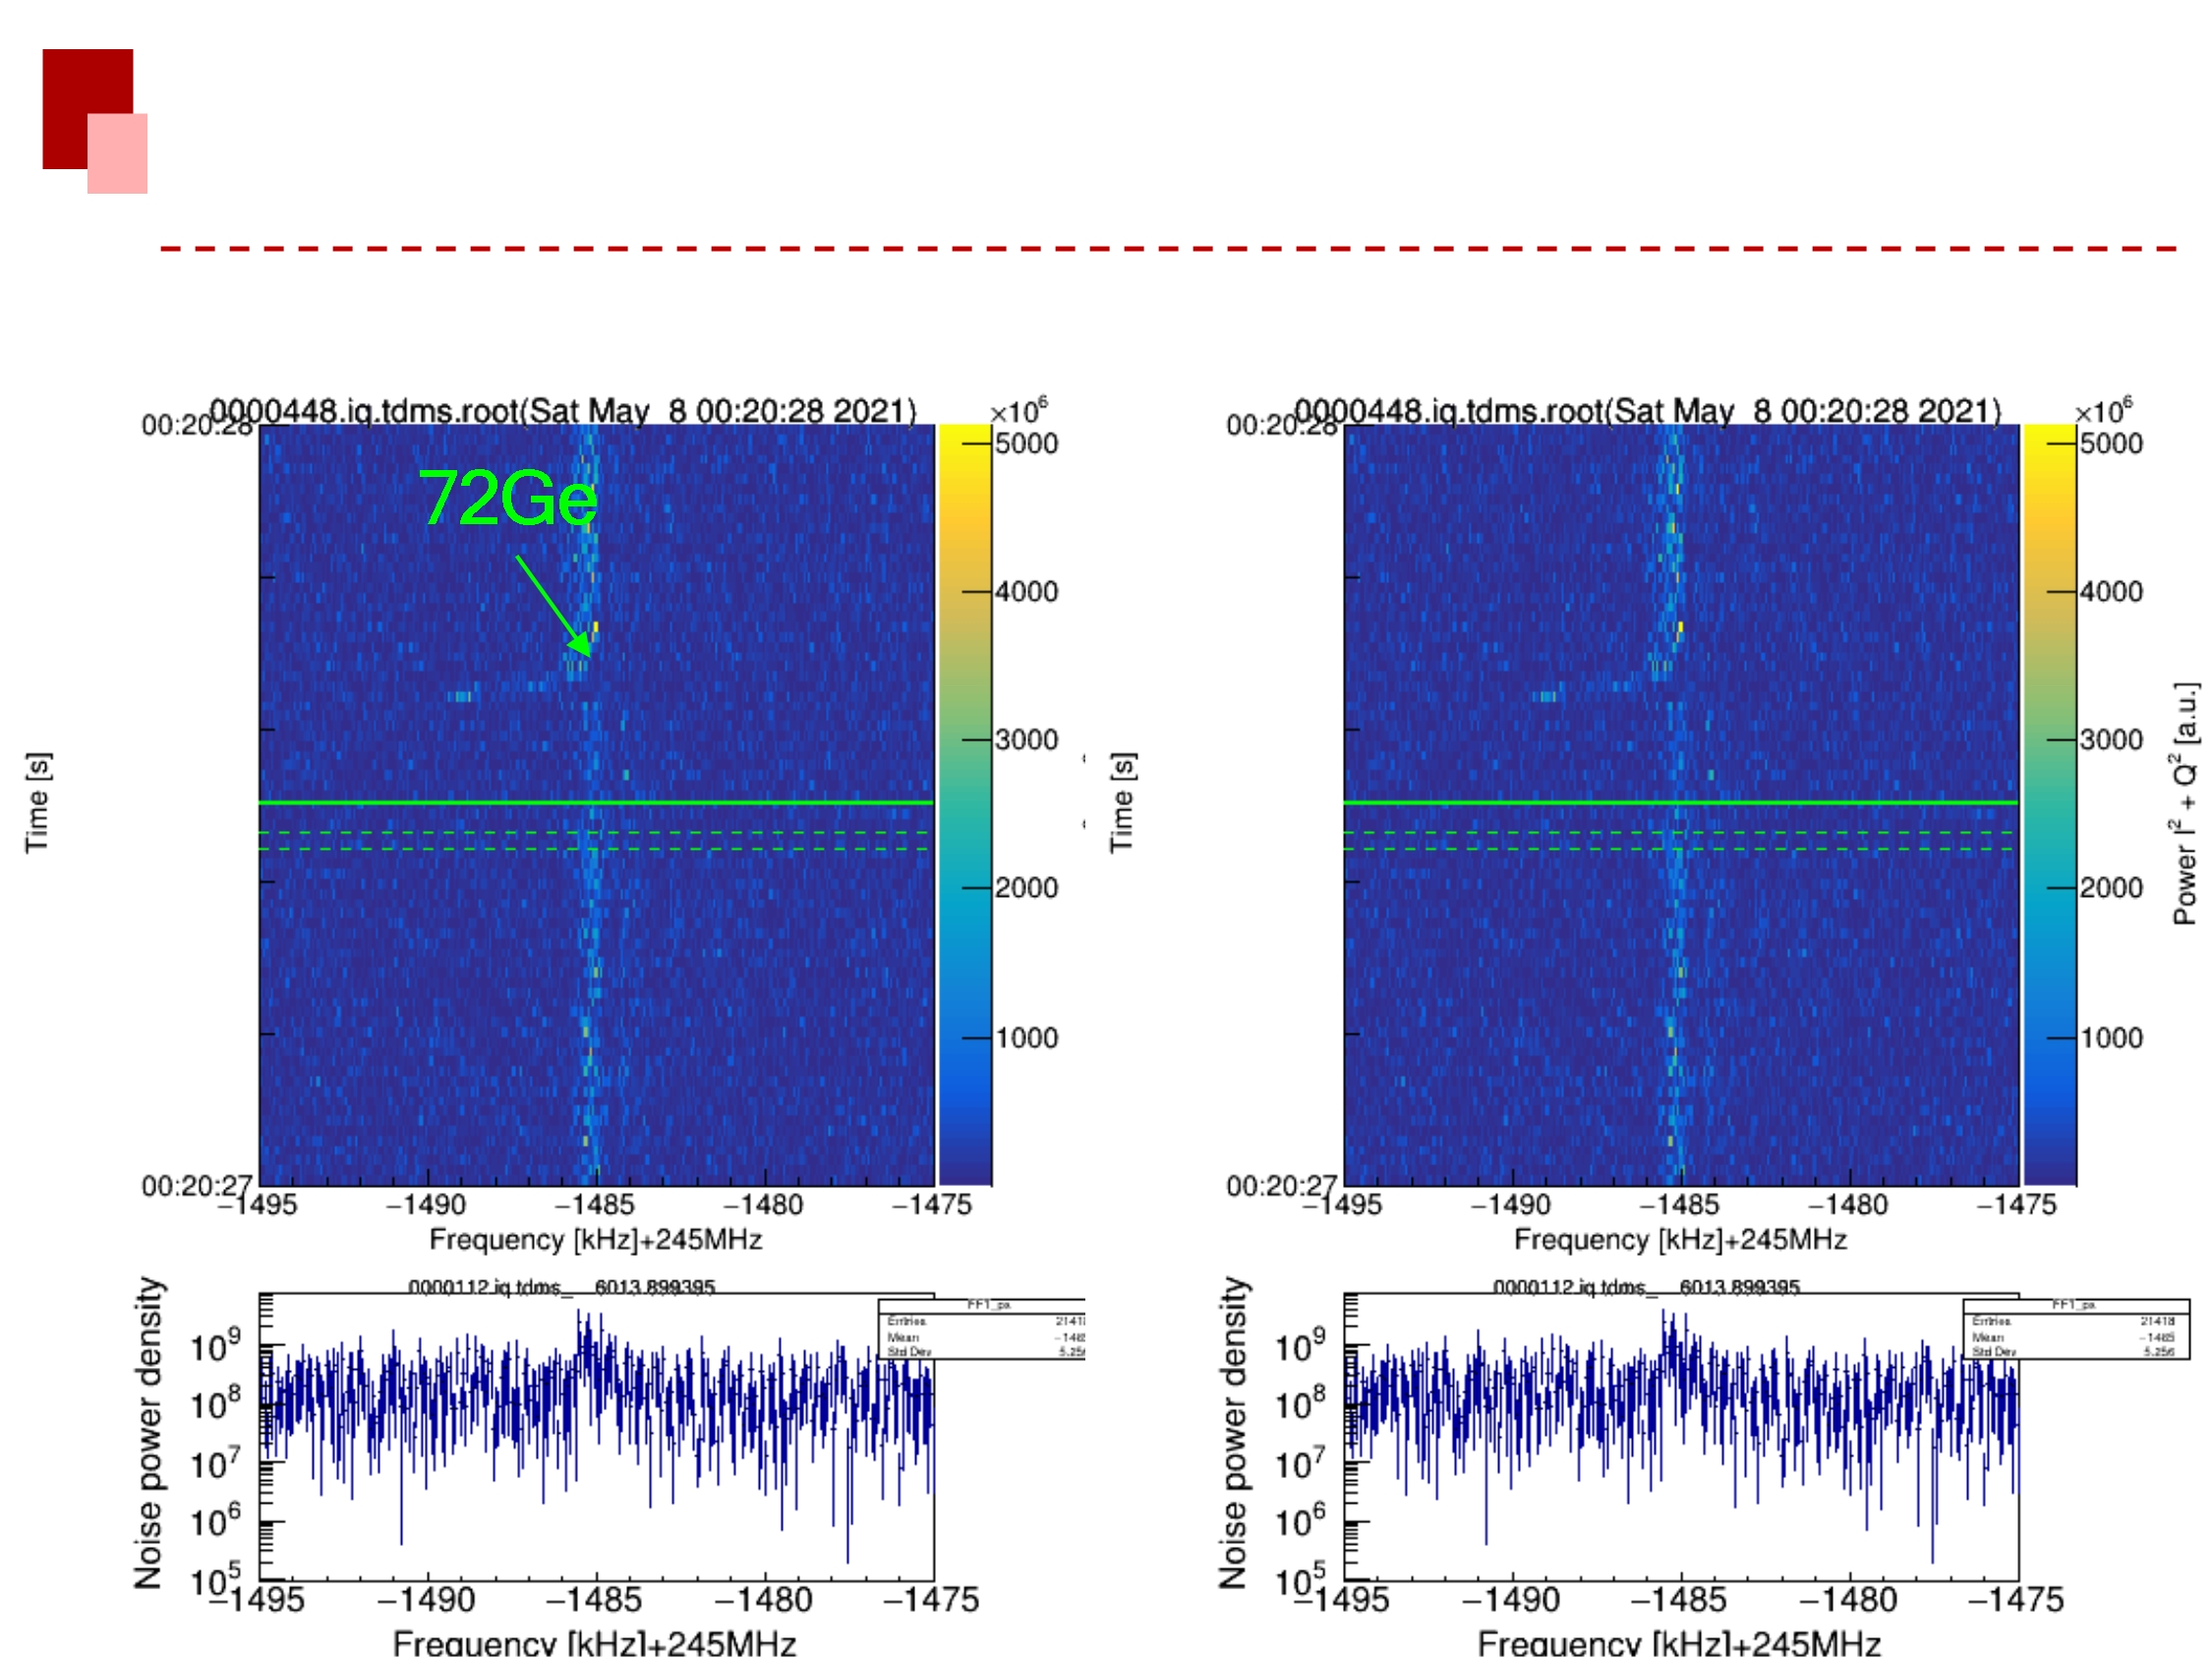
This some preliminary analysis results by using  NTCAP data.   The IQ rate of NTCAP is 20 MSamples/seconds. I analyzed data files recorded from May 7
17:39 to May 8 2:20.  The frequency of 72Ge is bended by 4kHz at the beginning of some injections.  In order to check whether this frequency bending is
due to isomer or unstable magnetic field. I compare the 72Ge with other isotopes. The similar bending was observed for other isotope in each
corresponding injections. It seems that bend is due to unstable magnetic field. |
| Attachment 1: 20210501_NTCAPPreparation_v2_2.jpg
|
|
| Attachment 2: 20210501_NTCAPPreparation_v2_3.jpg
|
|
| Attachment 3: 20210501_NTCAPPreparation_v2_4.jpg
|
|
| Attachment 4: 20210501_NTCAPPreparation_v2_5.jpg
|
|
| Attachment 5: 20210501_NTCAPPreparation_v2_6.jpg
|
|
| Attachment 6: 20210501_NTCAPPreparation_v2_7.jpg
|
|
|
24
|
Fri May 7 01:49:03 2021 |
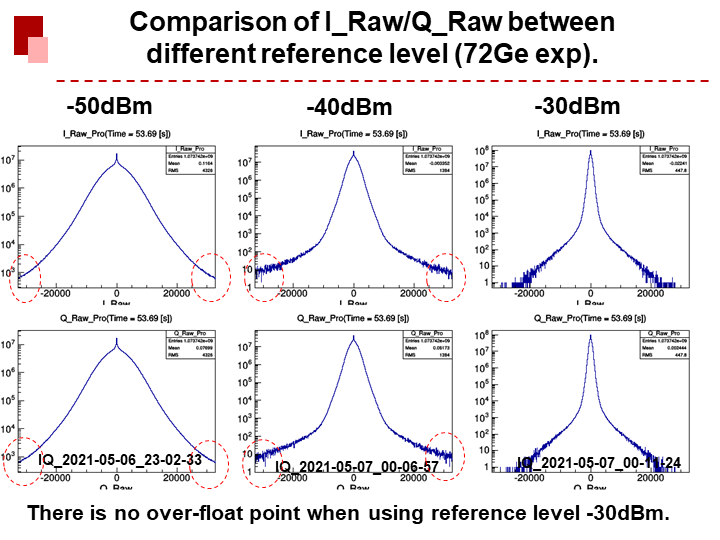
Rui-Jiu Chen | DAQ | Comparison of I_Raw/Q_Raw between different reference level |
This is a comparison of I_Raw/Q_Raw between different reference level. The range of NTCAP ADC is only 2^15 bit. So signals (I_Raw and Q_Raw) should
not be outside ADC range. It is clear that there is not point outside the ADC range when using reference level -30dBm. |
| Attachment 1: 20210501_NTCAPPreparation.png
|
|
|
17
|
Thu May 6 21:36:04 2021 |
Regina + Markus + Yuri | Accelerator | Cooler Curve |
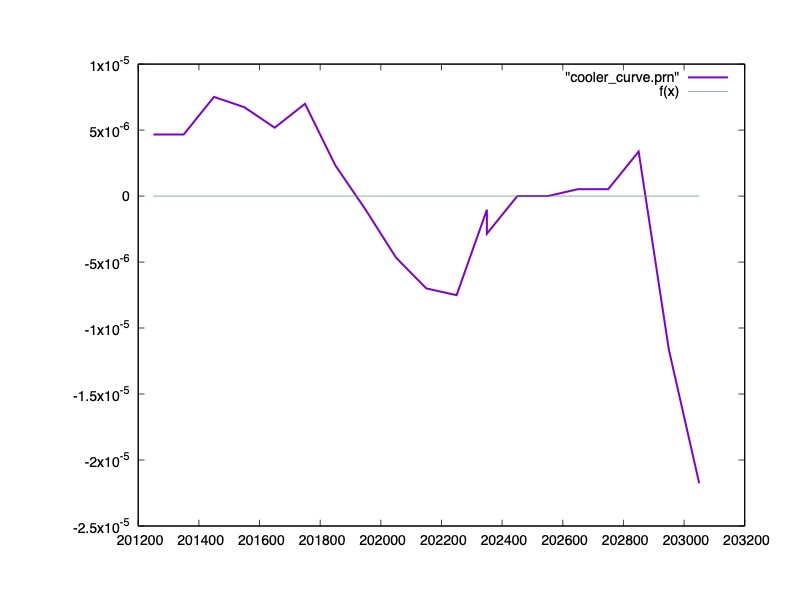
| Final cooler curve, Isochronous 78Kr |
| Attachment 1: cc_1.jpg
|
|
|
154
|
Wed Jun 30 14:48:54 2021 |
Oliver | General | Data taking - and not... |
We just started data taking. But a few minutes later the main experiment needed to do some adjustements to the beam. This interrupts us for a couple of minutes... |
|
32
|
Fri May 7 04:39:00 2021 |
Liliana, Akash, Wolfram, Helmut, Shahab | Runs | Data taking starts |
File start being recorded at 4:38 am
Sync with the server is working.

Be aware that the timestamp of the files is 1h behind with respect to real time |
|
12
|
Thu May 6 16:45:42 2021 |
Ragan, Rui-Jiu | DAQ | Data taking with NTCAP |
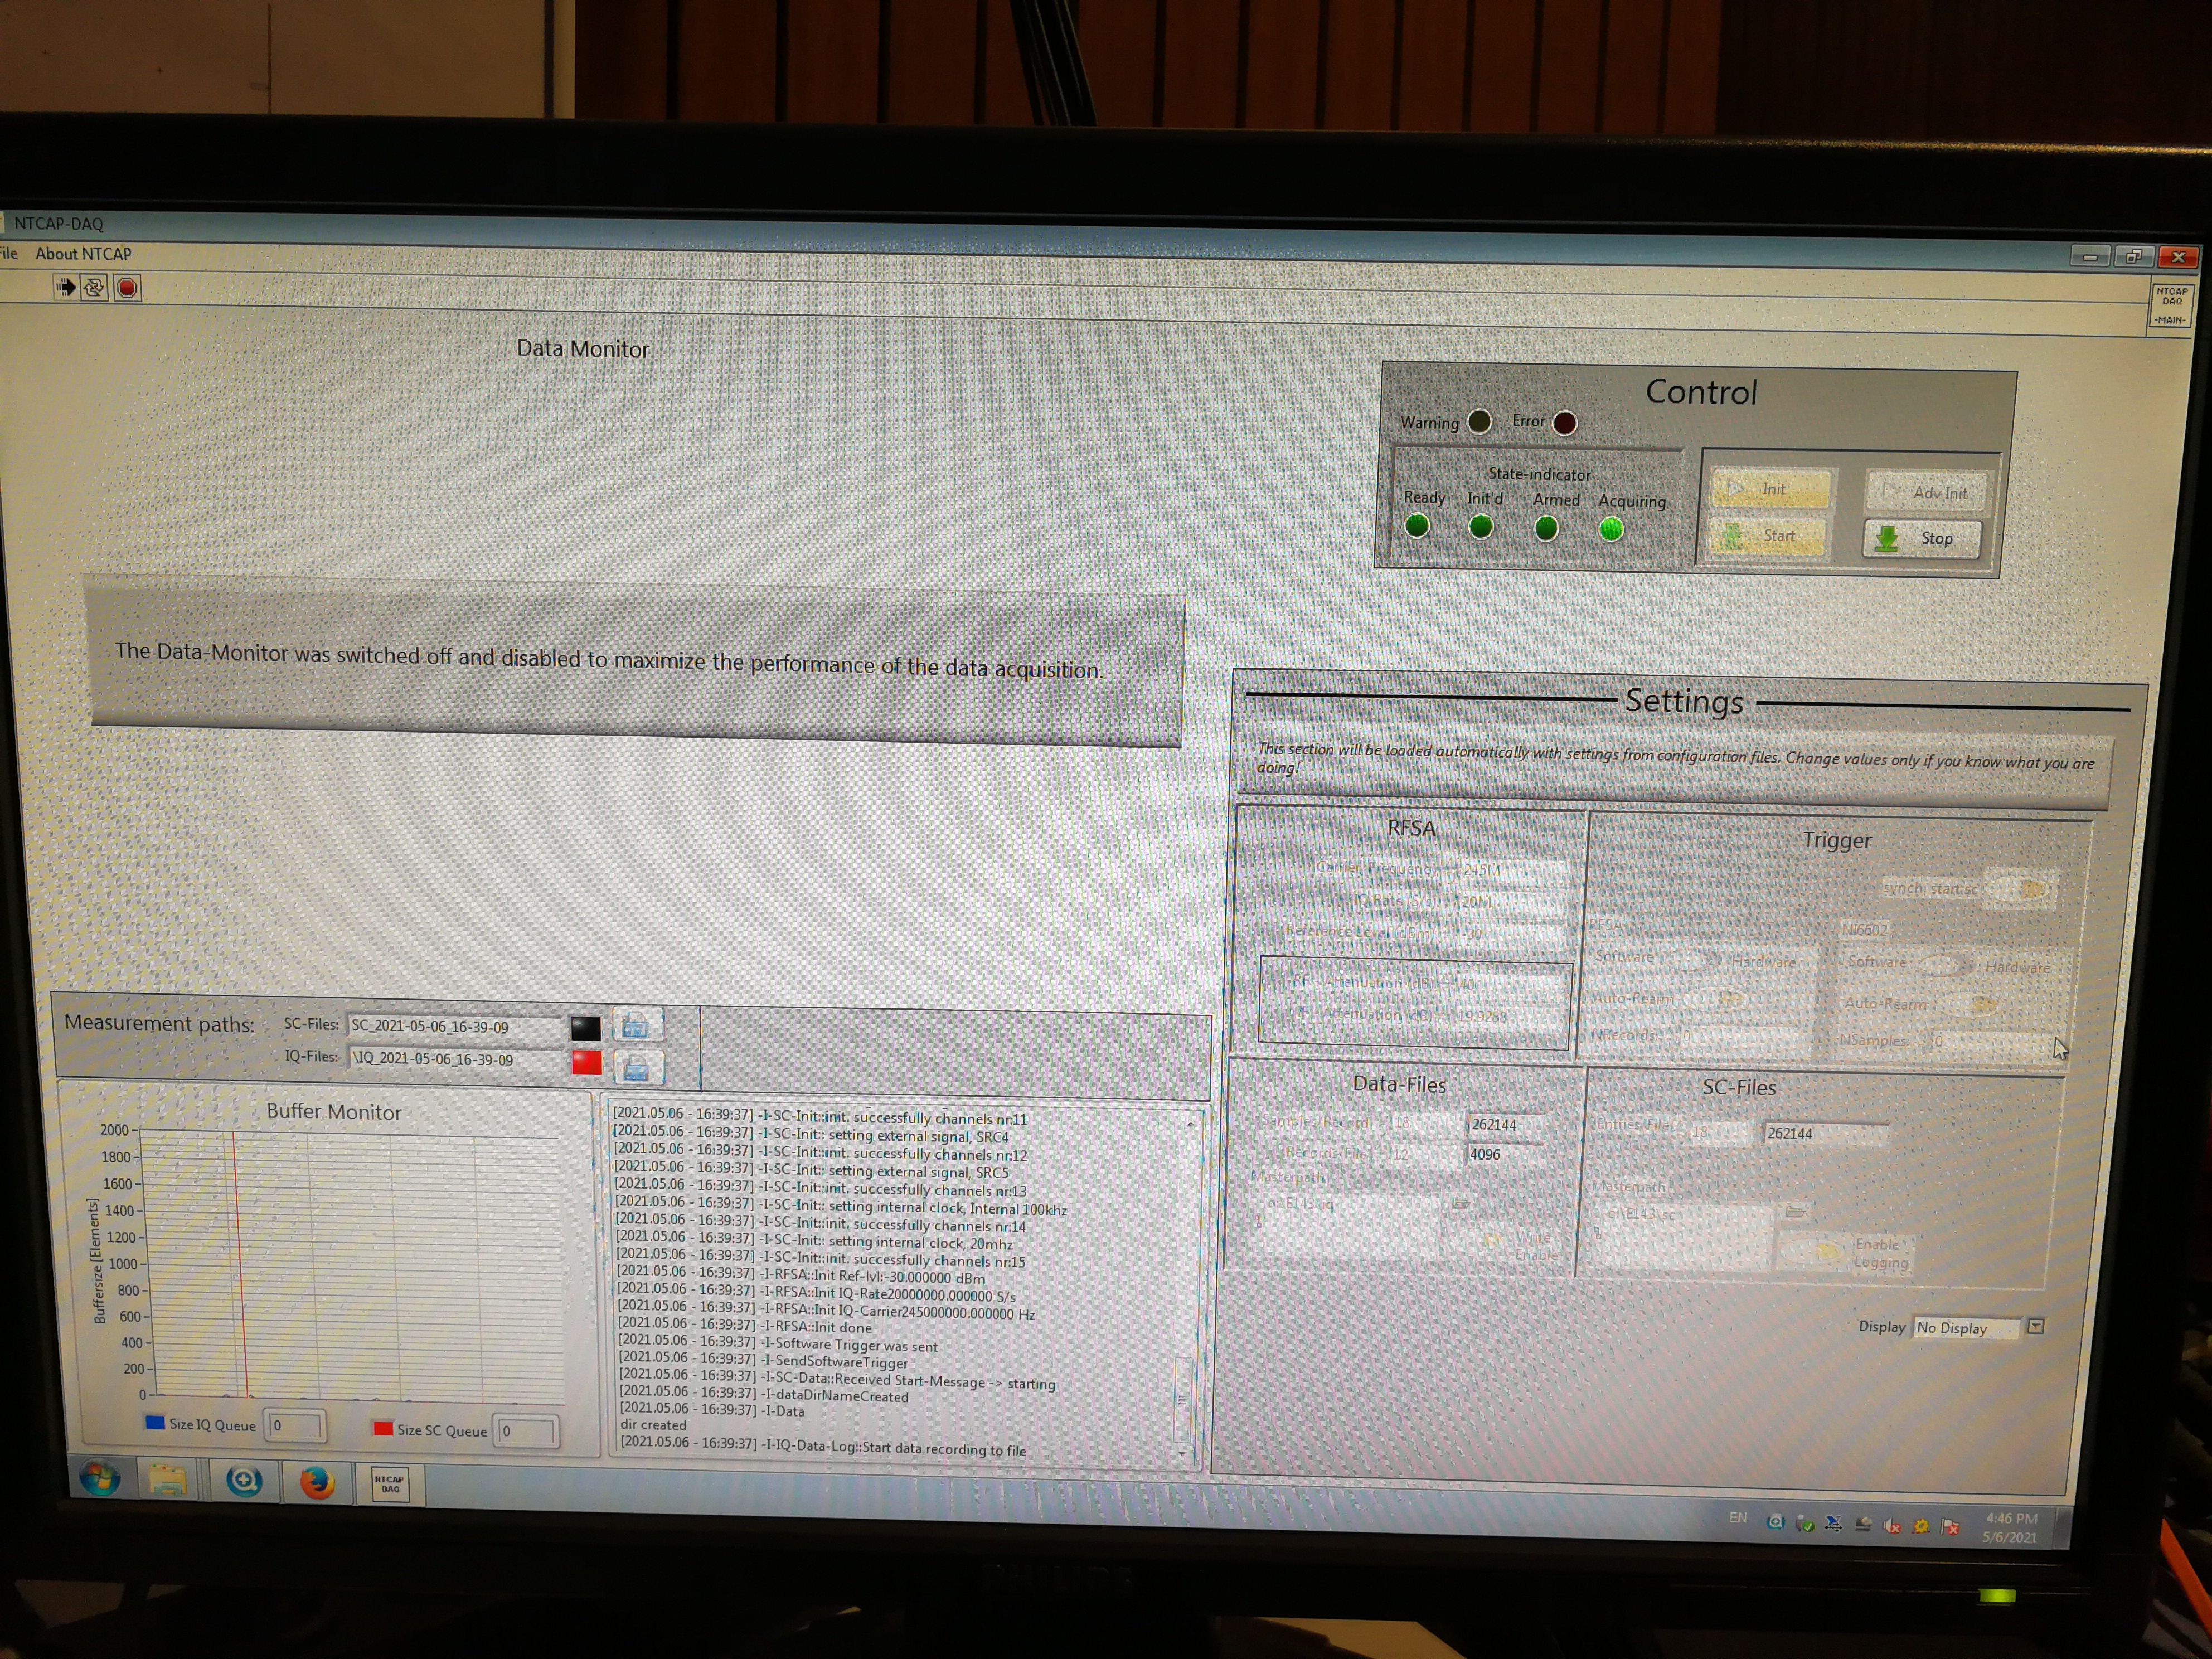
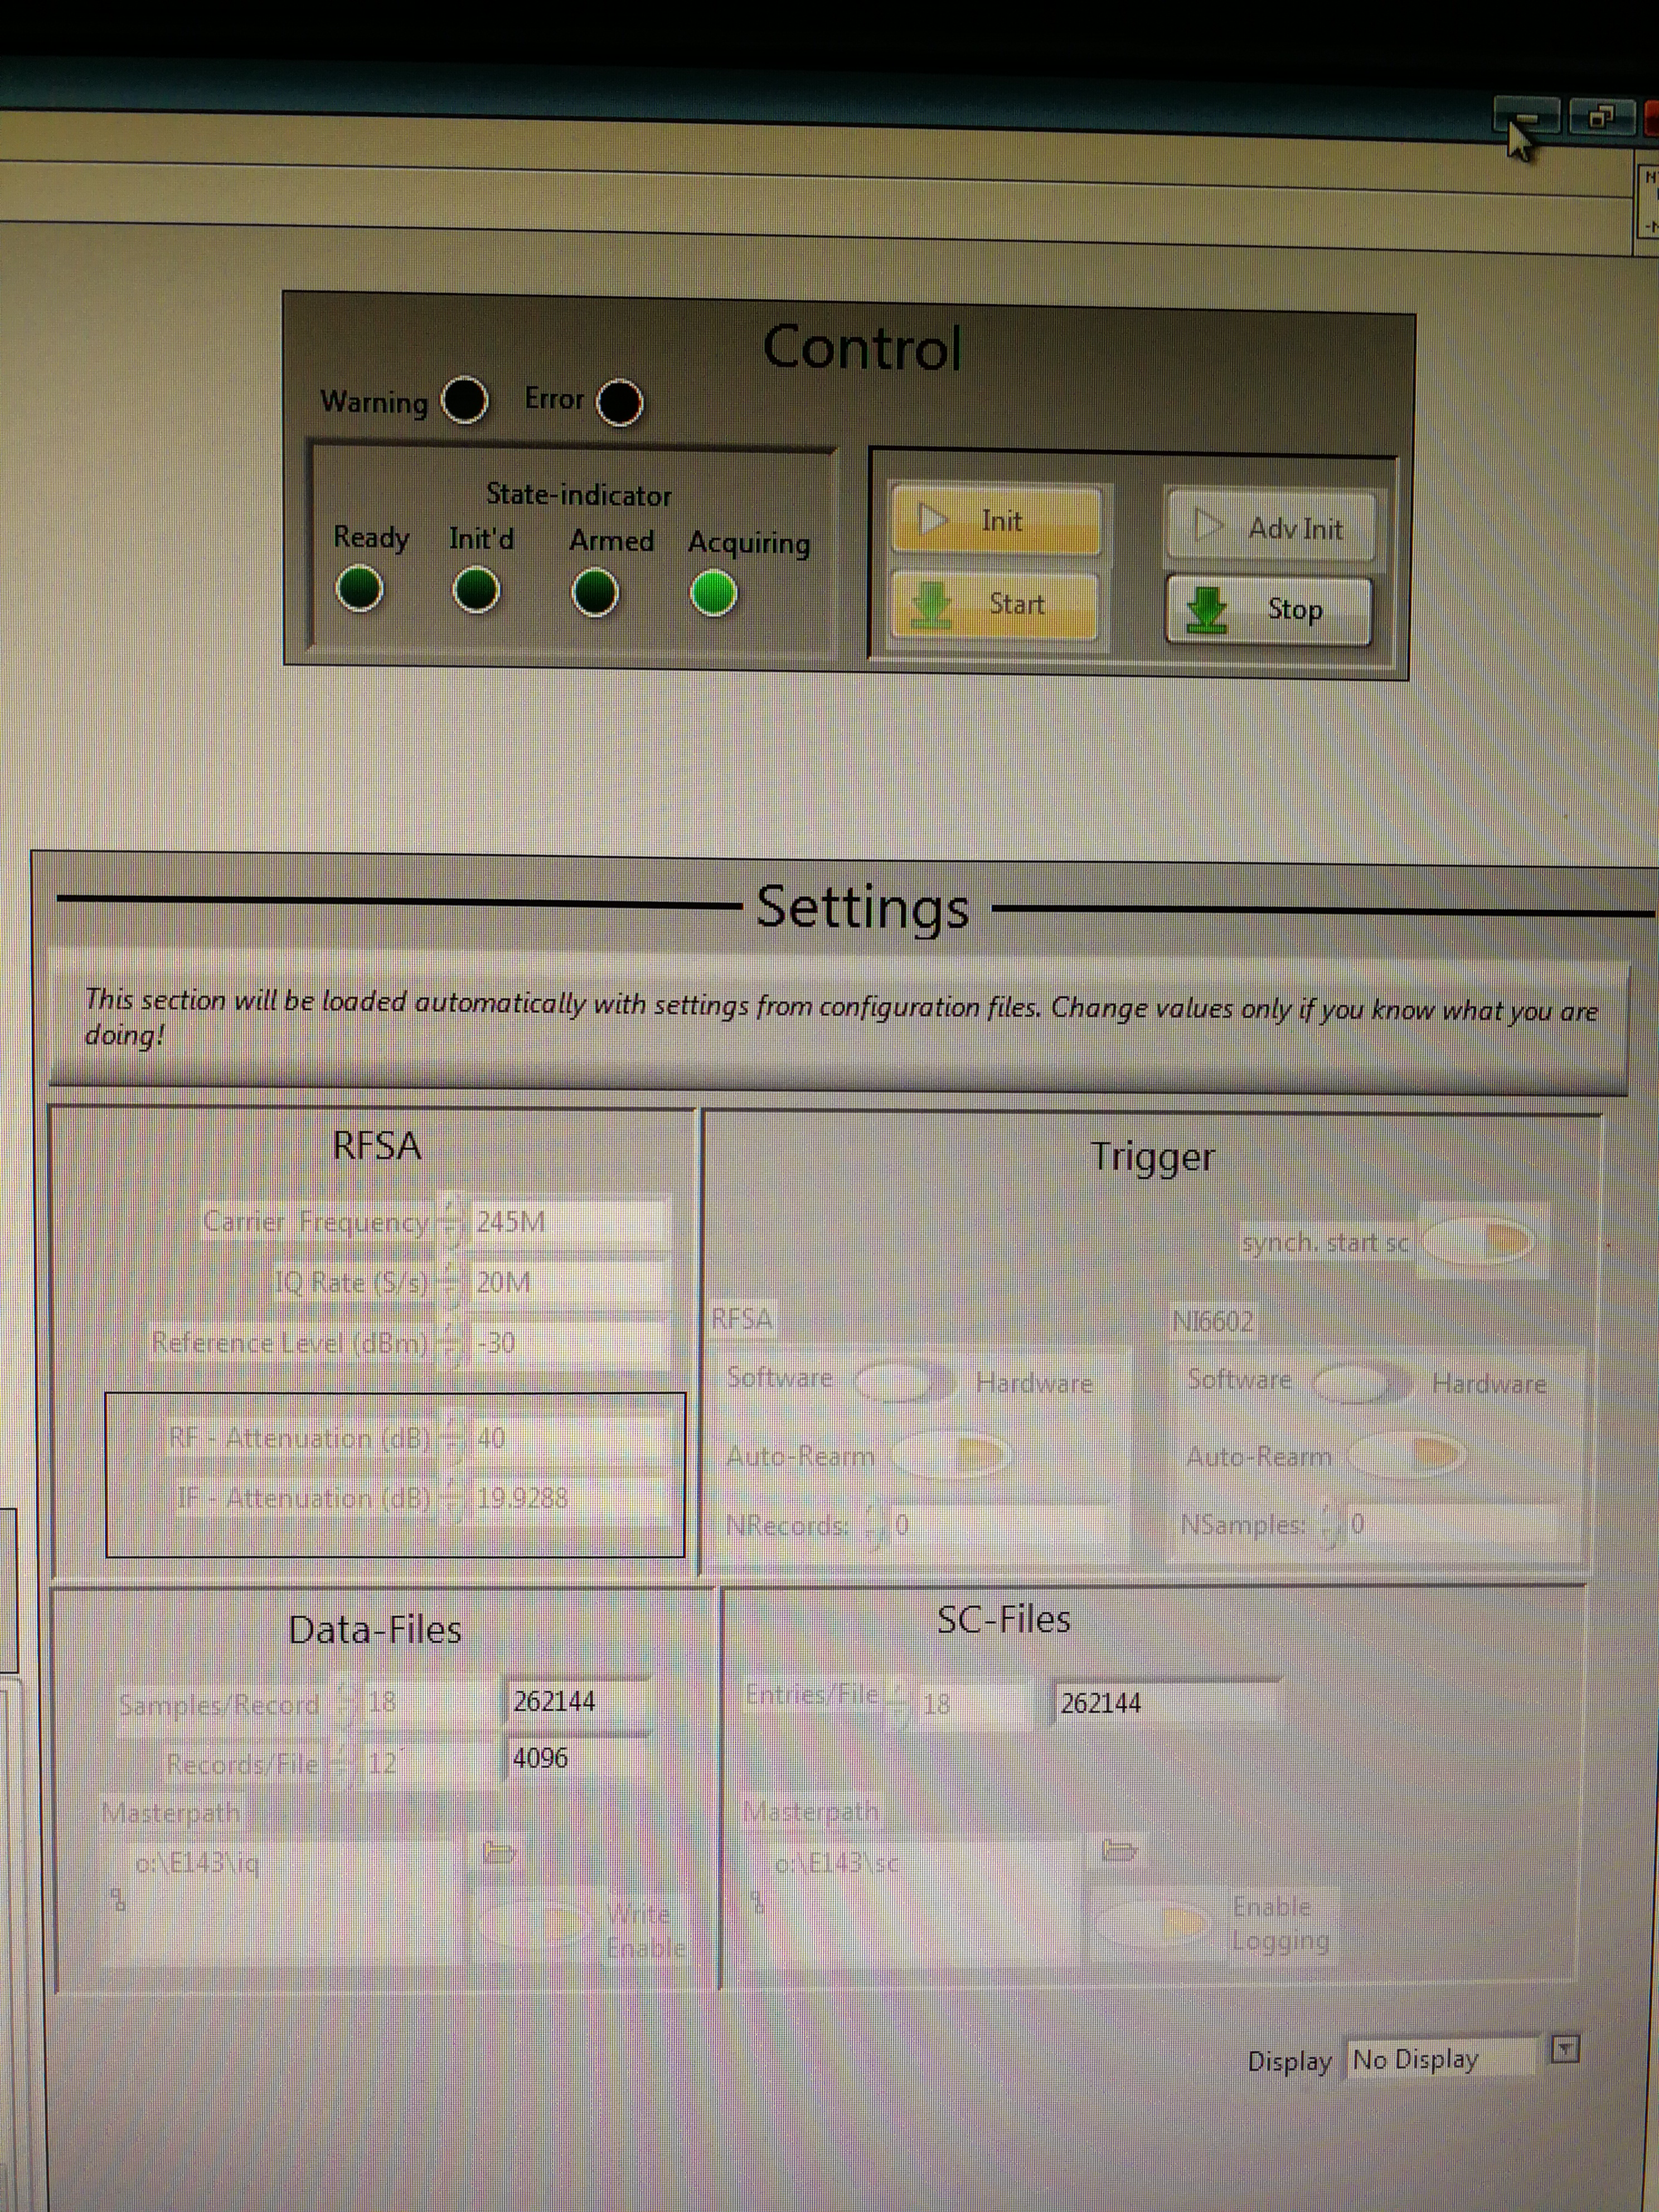
NTCAP is on and data taking has started.
On time: 16:39

SC_2021-05-06_16-39-09
\IQ_2021-05-06_16-39-09

IQ Rate: 20 MS/s
Carrier frequency: 245 MHz
Reference level(dBm):-30
RF attenuation(dB):40
IF attenuation(dB):19.9288

Data file
Samples/records:2^18=262144
Records/File:2^12=4096

SC file:
Entries/file:2^18=262144

Master path:
o:\E143\iq
o:\E143\sc |
| Attachment 1: 1.jpg
|
|
| Attachment 2: 2.jpg
|
|
|
159
|
Wed Jun 30 20:14:44 2021 |
Ragan, Helena | General | Drop in SIS intensity |
There is a drop in SIS intensity and the operators are informed. |
|
42
|
Fri May 7 10:05:06 2021 |
Yuri | Accelerator | E02DS3HG does not drive |
E02DS3HG stays at -35 mm and does not react |
|
14
|
Thu May 6 17:48:48 2021 |
W. Korten, Helmut | General | ESR setting for 72Ge ions with primary beam |
Setting the 78Kr (after the target) to the Brho of the 72Ge beam at 368.4 MeV/u (gamma=1.3955), i.e. 6.79575 Tm, which leads to an energy of 392.93 (of 78Kr).
With the 10mm Be target the beam energy should then be 467.8 MeV/u .
Yes, with my slightly different target thickenss 467.5 MeV/u (Helmut).

For 72Ge at this Brho after the target it then needs 440.95 MeV/u.
LISE in proj. fragmentation option Morissey for projectile energy loss and ATIMA 1.4 with Be 1839 mg/cm^2). |
|
73
|
Sat May 8 10:51:41 2021 |
Akash, Nic, Jelena, Zsolt | Calibration | ESR settings seem different |
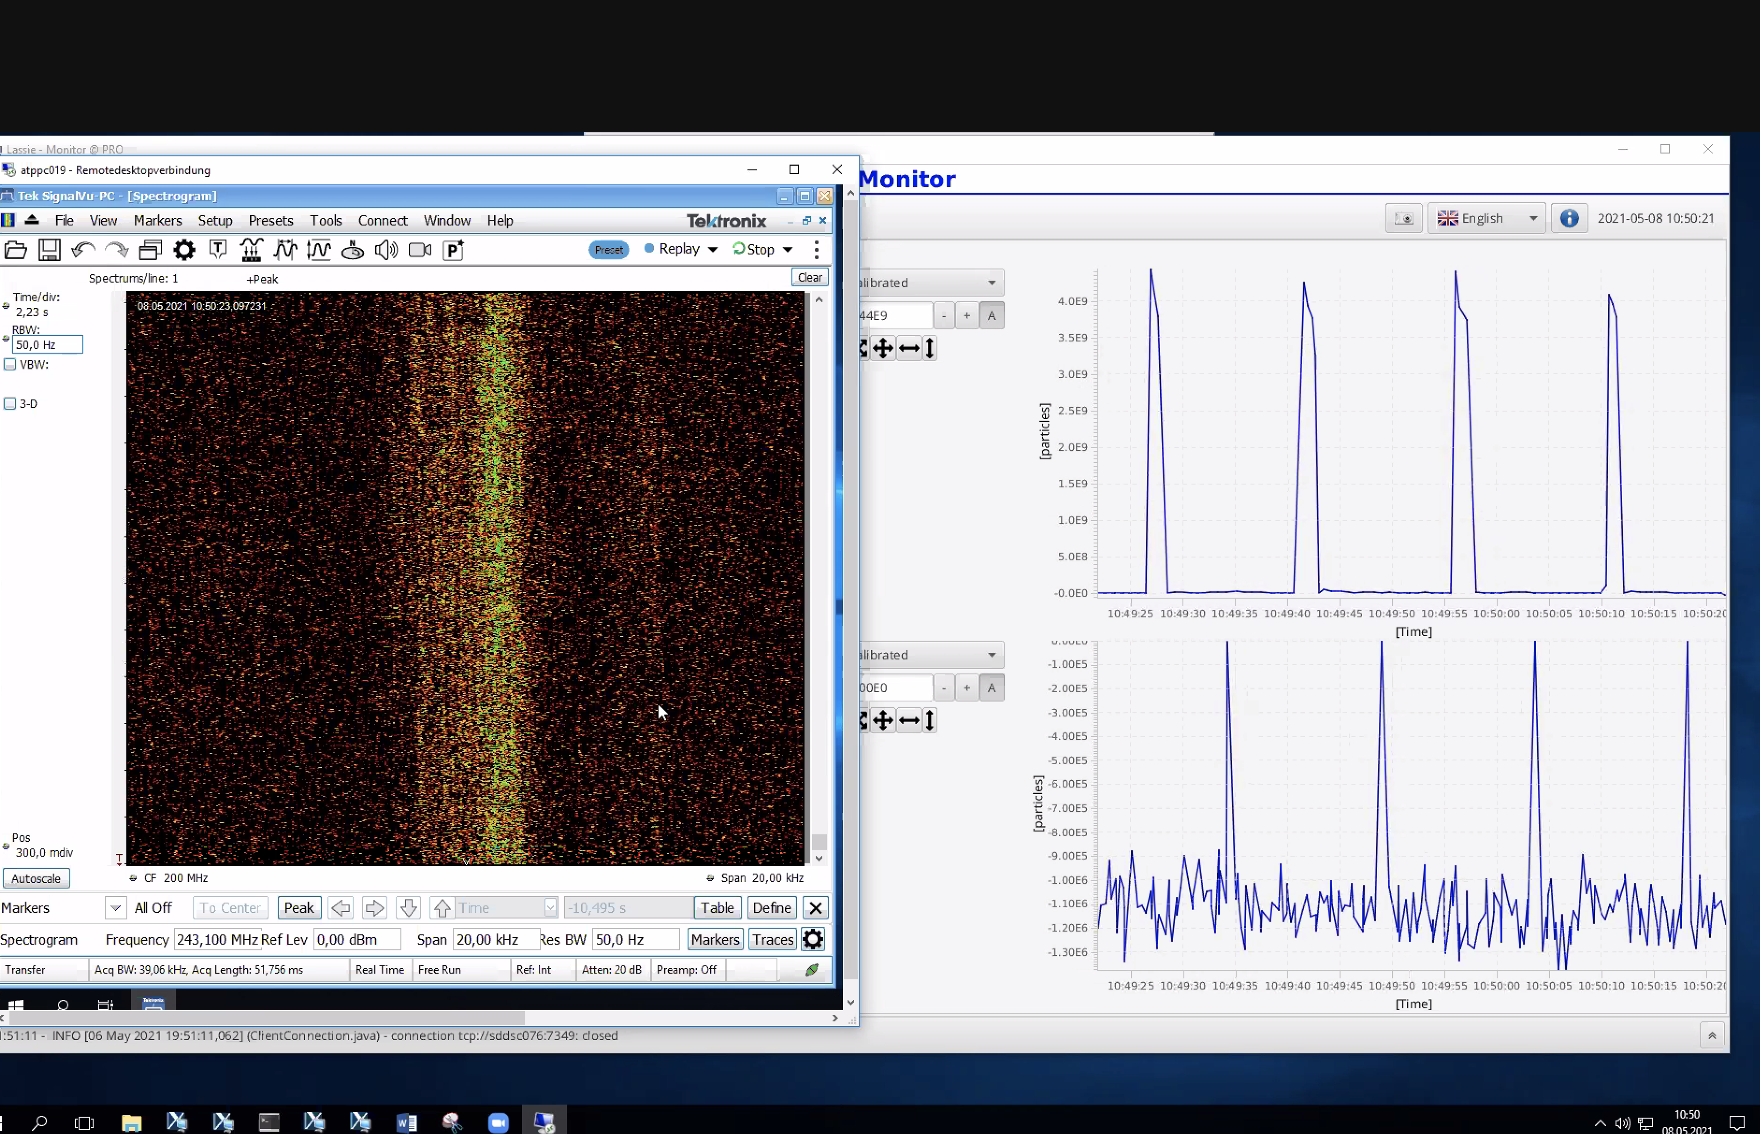
Settings don't look the same...so we are not yet writing files unless sure. |
| Attachment 1: Screenshot_2021-05-08_at_10.50.23.png
|
|
|
211
|
Fri Jul 2 13:44:50 2021 |
Sergey, et al | Accelerator | El cooler |
Up to now, attempts to cool the fat line between Se and Ar were conducted. We give up it now and remove cooling |
|
133
|
Mon May 10 08:49:01 2021 |
Kanika, Alex, RuiJiu | General | End of the measurement |
The beam was stopped at about 08:40. |
|
16
|
Thu May 6 21:26:02 2021 |
Yuri et al. | Accelerator | Energies |
gamma_t = 1.3955
Br(72Ge) corresponds to 6.79575 Tm
E (Kr) at Br(72Ge) = 392.9 MeV/u
ESIS = 467.45 MeV/u (pre-drilling, after 1.8 g/cm2 target)
ESIS = 440.98 MeV/u (final energy for 72Ge)

-during setup, a 20 mm offset in the TE line was observed. Beam centered via changing the Br of the beamline (~4 MeV/u up). Optimized pre-drilling transmission ~20% (with thick target) |